. 2013 Apr 29;14(4):R38.
doi: 10.1186/gb-2013-14-4-r38.

jMOSAiCS: joint analysis of multiple ChIP-seq datasets

jMOSAiCS: joint analysis of multiple ChIP-seq datasets

Xin Zeng et al. Genome Biol. .

Abstract

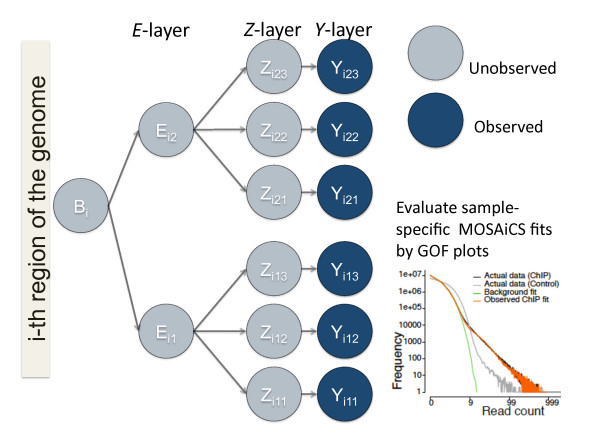
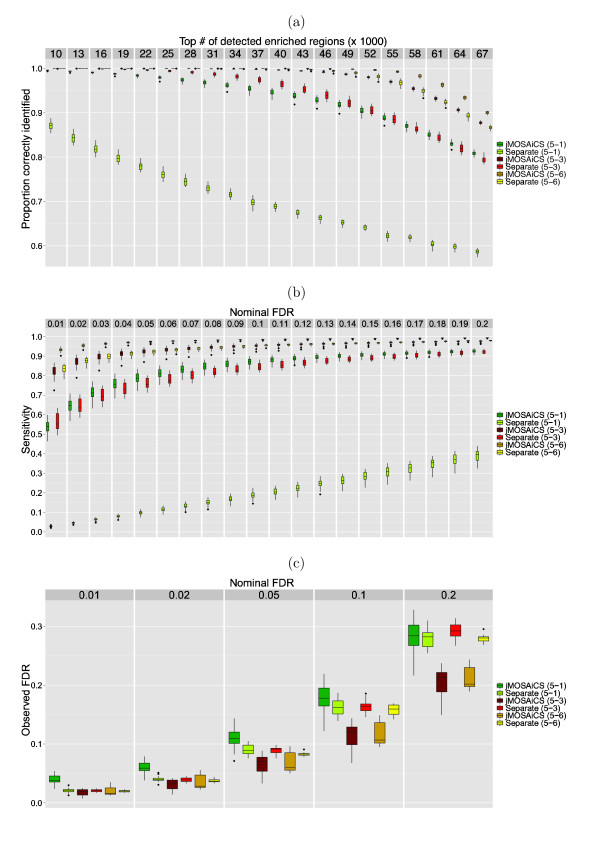
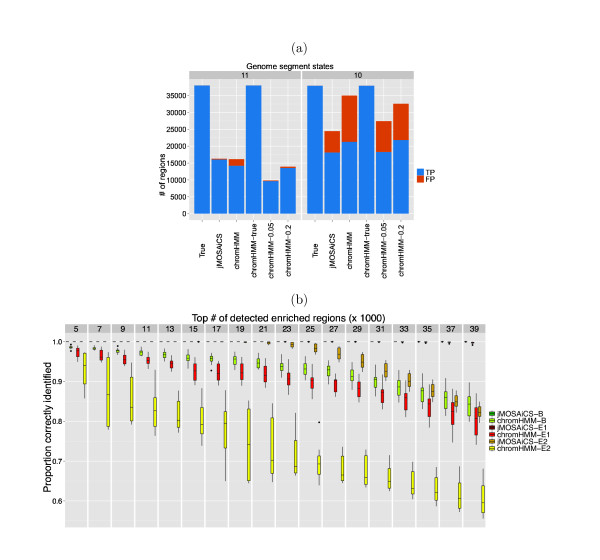
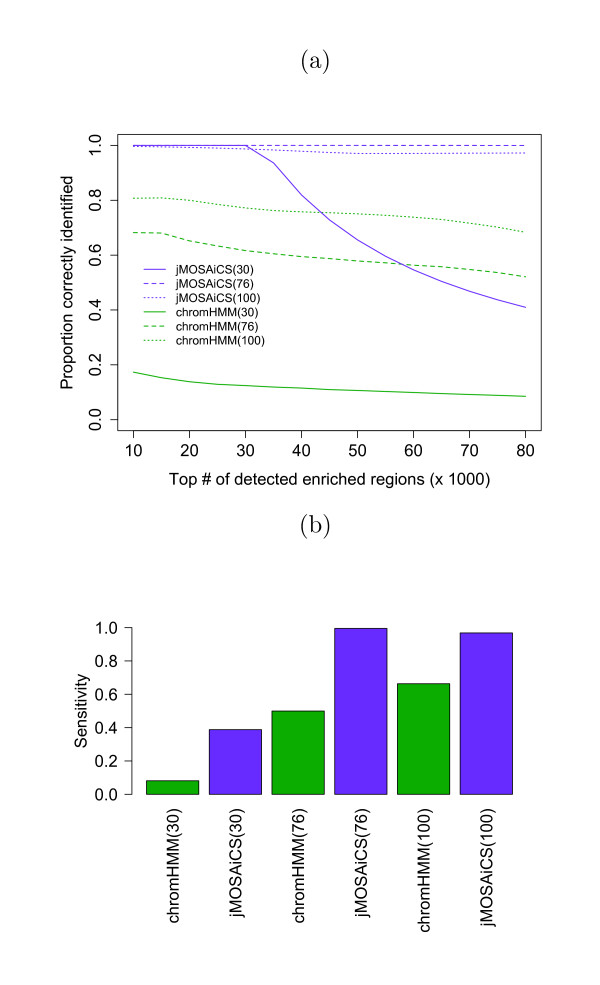
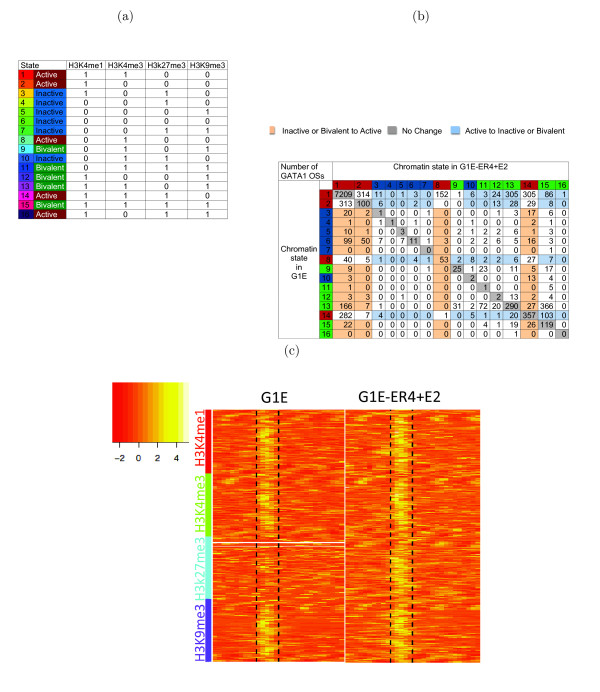
The ChIP-seq technique enables genome-wide mapping of in vivo protein-DNA interactions and chromatin states. Current analytical approaches for ChIP-seq analysis are largely geared towards single-sample investigations, and have limited applicability in comparative settings that aim to identify combinatorial patterns of enrichment across multiple datasets. We describe a novel probabilistic method, jMOSAiCS, for jointly analyzing multiple ChIP-seq datasets. We demonstrate its usefulness with a wide range of data-driven computational experiments and with a case study of histone modifications on GATA1-occupied segments during erythroid differentiation. jMOSAiCS is open source software and can be downloaded from Bioconductor 1.


Figures

Figure 1
Figure 1
Pictorial depiction of the jMOSAiCS model for a region across two ChIP-seq datasets. Region i consists of three bins. The B variable governs whether or not the region is enriched in any of the two samples. The E variables denote sample-specific enrichments and are conditionally independent given the B variable. The Z variables depict enrichment at the bin level and are conditionally independent given the sample-specific E variables. When Eid = 1, one or more consecutive Z variables are set to 1 to capture enrichment. The observed read count Y can be scalar or vector-valued depending on the availability of a control input sample. Data fits at the Y layer are obtained by MOSAiCS [19] on individual samples and evaluated by the goodness-of-fit (GOF) plots. ChIP: chromatin immunoprecipitation; jMOSAiCS: joint model-based one- and two-sample analysis and inference for ChIP-seq; MOSAiCS: model-based analysis and inference for ChIP-seq data
Figure 2
Figure 2
Computational experiments comparing jMOSAiCS with the separate analysis approach on data simulated from the STAT1 ChIP-seq experiment. jMOSAiCS-B, jMOSAiCS-E1, and jMOSAiCS-E2 are results derived from posterior probability inferences of the B, E1, and E2 variables. Separate-B, Separate-E1, and Separate-E2 are results derived from separate analysis of each dataset. (a) Proportion of top ranking enriched regions that are true positives. (b) Sensitivity by nominal FDR. (c) Observed FDR by nominal FDR. ChIP: chromatin immunoprecipitation; FDR: false discovery rate; jMOSAiCS: joint model-based one- and two-sample analysis and inference for ChIP-seq
Figure 3
Figure 3
Computational experiments comparing jMOSAiCS with the separate analysis approach on data simulated from the MeCP2 ChIP-seq experiment. Comparisons of region level (B) results of jMOSAiCS and separate analysis. jMOSAiCS (x-y) and Separate (x-y) refer to jMOSAiCS and separate analysis of x lanes of replicate 1 with y lanes of replicate 2. (a) Proportion of top ranking enriched regions that are true positives. (b) Sensitivity by nominal FDR. (c) Observed FDR by nominal FDR. ChIP: chromatin immunoprecipitation; FDR: false discovery rate; jMOSAiCS: joint model-based one- and two-sample analysis and inference for ChIP-seq
Figure 4
Figure 4
Computational experiments comparing jMOSAiCS with the separate analysis approach on data simulated from the MeCP2 ChIP-seq experiment. Comparison of dataset-specific region-level enrichment detection (E1) by jMOSAiCS and separate analysis on replicate 1. jMOSAiCS (x-y) and Separate (x-y) refer to jMOSAiCS and separate analysis of x lanes of replicate 1 with y lanes of replicate 2. (a) Proportion of top ranking enriched regions that are true positives. (b) Sensitivity by nominal FDR. (c) Observed FDR by nominal FDR. ChIP: chromatin immunoprecipitation; FDR: false discovery rate; jMOSAiCS: joint model-based one- and two-sample analysis and inference for ChIP-seq
Figure 5
Figure 5
Computational experiments comparing jMOSAiCS with the separate analysis approach on data simulated from MeCP2 ChIP-seq data. Comparison of dataset-specific region-level enrichment detection (E2) by jMOSAiCS and separate analysis on replicate 2 for which the number of data lanes varies. jMOSAiCS (x-y) and Separate (x-y) refer to jMOSAiCS and separate analysis of x lanes of replicate 1 with y lanes of replicate 2. (a) Proportion of top ranking enriched regions that are true positives. (b) Sensitivity by nominal FDR. (c) Observed FDR by nominal FDR. ChIP: chromatin immunoprecipitation; FDR: false discovery rate; jMOSAiCS: joint model-based one- and two-sample analysis and inference for ChIP-seq
Figure 6
Figure 6
Comparisons between jMOSAiCS and chromHMM based on data simulated from ChIP-seq experiment of STAT1 in HeLa3 cells (setting SE2). (a) Identification of combinatorial patterns: 11: enriched in both samples; 10: enriched only in sample 1. True: number of enriched regions; chromHMM: results by original four-state chromHMM; chromHMM-true: four-state chromHMM coupled with true binary data for the bins; chromHMM-0.05: four-state chromHMM coupled with MOSAiCS binarization of the bins at an FDR of 0.05; chromHMM-0.2: four-state chromHMM coupled with MOSAiCS binarization of the bins at an FDR of 0.2. (b) Accuracy of enrichment detection at the region (B) and dataset-specific region (E1 and E2) levels by jMOSAiCS and two-state chromHMM. ChIP: chromatin immunoprecipitation; FDR: false discovery rate; FP: false positives; jMOSAiCS: joint model-based one- and two-sample analysis and inference for ChIP-seq TP: true positives
Figure 7
Figure 7
Computational experiments for evaluating scalability of jMOSAiCS to large numbers of datasets using data simulated from ChIP-seq experiment STAT1 in HeLa3 cells (extension of setting SE3). (a) Accuracy of enrichment detection at the combinatorial pattern (state) level for different numbers of states. (b) Sensitivity at varying numbers of states.
Figure 8
Figure 8
Analysis of mouse ENCODE histone ChIP-seq datasets. (a) List of combinatorial patterns identified by jMOSAiCS. Patterns 1 to 6 are also identified by chromHMM. (b) Changes in chromatin states between G1E and G1E-ER4+E2 cells for DNA segments occupied by GATA1 in the latter cells. (c) Heatmap of normalized raw data for a group of 311 GATA1-occupied segments identified to switch from 1101 in G1E cells to 1111 in G1E-ER4+E2 cells by jMOSAiCS. Enriched regions (excluding segments longer than 1,400 bp in size) identified across different marks are aligned and depicted in between the dashed lines.

References

    1. Gentleman R, Carey V, Bates D, Bolstad B, Dettling M, Dudoit S, Ellis B, Gautier L, Ge Y, Gentry J, Hornik K, Hothorn T, Huber W, Iacus S, Irizarry R, Leisch F, Li C, Maechler M, Rossini A, Sawitzki G, Smith C, Smyth G, Tierney L, Yang J, Zhang J. Bioconductor: open software development for computational biology and bioinformatics. Genome Biology. 2004;14:R80+. http://www.bioconductor.org/packages/devel/bioc/html/jmosaics.html - PMC - PubMed
    1. Kasowski M, Grubert F, Heffelfinger C, Hariharan M, Asabere A, Waszak SM, Habegger L, Rozowsky J, Shi M, Urban AE, Hong MY, Karczewski KJ, Huber W, Weissman SM, Gerstein MB, Korbel JO, Snyder M. Variation in transcription factor binding among humans. Science. 2010;14:232–235. doi: 10.1126/science.1183621. - DOI - PMC - PubMed
    1. Zheng W, Zhao H, Mancera E, Steinmetz LM, Snyder M. Genetic analysis of variation in transcription factor binding in yeast. Nature. 2010;14:1187–1191. doi: 10.1038/nature08934. - DOI - PMC - PubMed
    1. Gerstein MB, Lu ZJ, Van Nostrand EL, Cheng C, Arshinoff BI, Liu T, Yip KY, Robilotto R, Rechtsteiner A, Ikegami K, Alves P, Chateigner A, Perry M, Morris M, Auerbach RK, Feng X, Leng J, Vielle A, Niu W, Rhrissorrakrai K, Agarwal A, Alexander RP, Barber G, Brdlik CM, Brennan J, Brouillet JJ, Carr A, Cheung MS, Clawson H, Contrino S. et al. Integrative analysis of the Caenorhabditis elegans genome by the modENCODE project. Science. 2010;14:1775–1787. doi: 10.1126/science.1196914. - DOI - PMC - PubMed
    1. Barski A, Cuddapah S, Cui K, Roh TY, Schones DE, Wang Z, Wei G, Chepelev I, Zhao K. High-resolution profiling of histone methylations in the human genome. Cell. 2007;14:823–837. doi: 10.1016/j.cell.2007.05.009. - DOI - PubMed

Publication types

LinkOut - more resources