Review
. 2013 Aug;29(8):394-406.
doi: 10.1016/j.pt.2013.06.005. Epub 2013 Jul 8.

Glossina fuscipes populations provide insights for human African trypanosomiasis transmission in Uganda

Affiliations
Review

Glossina fuscipes populations provide insights for human African trypanosomiasis transmission in Uganda

Serap Aksoy et al. Trends Parasitol. 2013 Aug.

Abstract

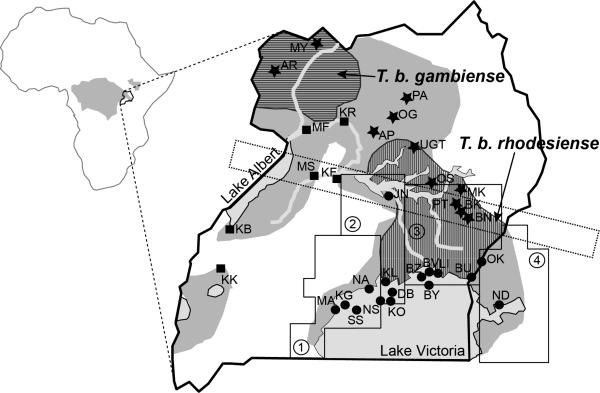
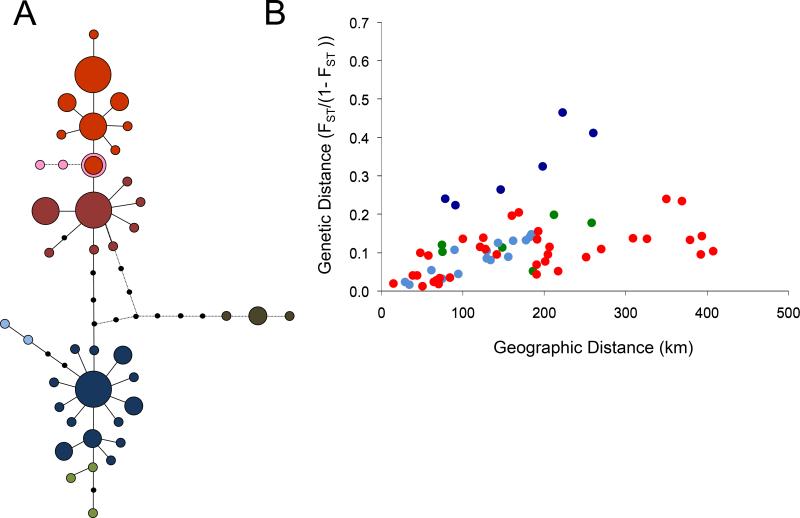
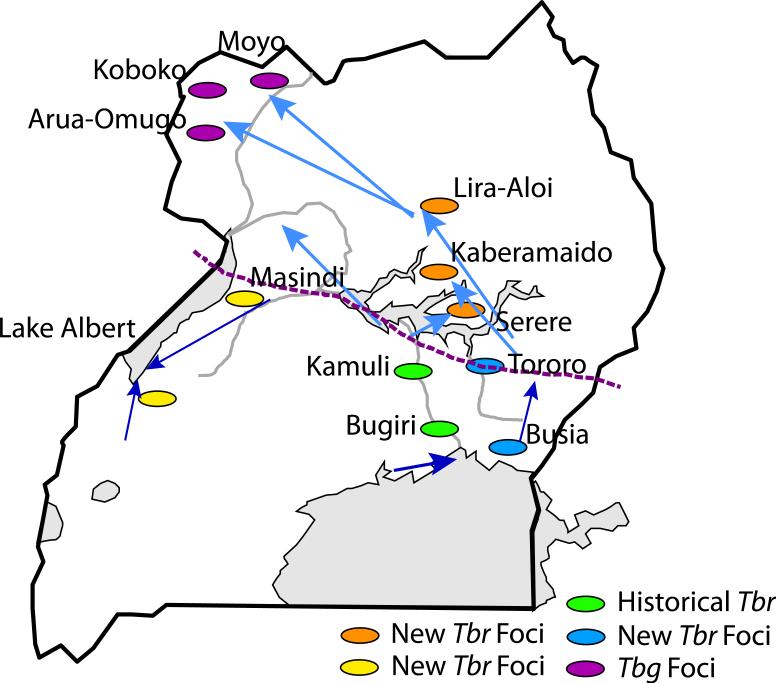
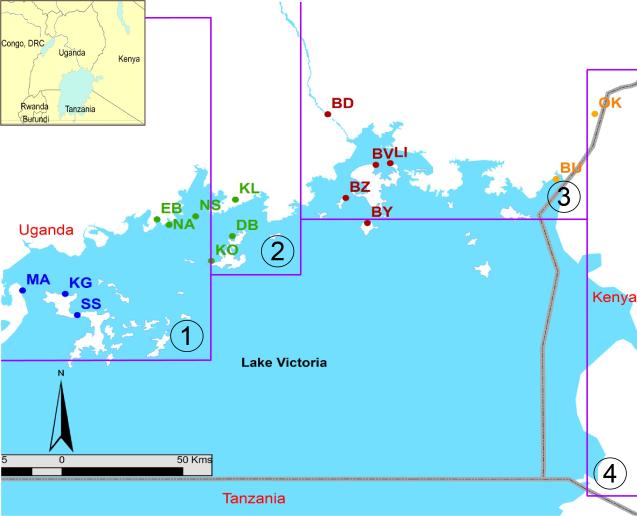
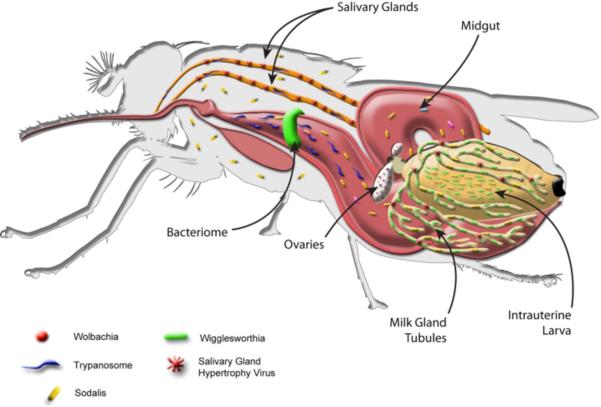
Uganda has both forms of human African trypanosomiasis (HAT): the chronic gambiense disease in the northwest and the acute rhodesiense disease in the south. The recent spread of rhodesiense into central Uganda has raised concerns given the different control strategies the two diseases require. We present knowledge on the population genetics of the major vector species Glossina fuscipes fuscipes in Uganda with a focus on population structure, measures of gene flow between populations, and the occurrence of polyandry. The microbiome composition and diversity is discussed, focusing on their potential role on trypanosome infection outcomes. We discuss the implications of these findings for large-scale tsetse control programs, including suppression or eradication, being undertaken in Uganda, and potential future genetic applications.

Keywords: Glossina fuscipes; Trypanosoma brucei gambiense; Trypanosoma brucei rhodesiense; Uganda; human African trypanosomiasis; population genetics; sleeping sickness; vector control.


Figures

Figure 1
Figure 1. Glossina fuscipes and HAT distribution in Uganda
Left: Map of Africa showing in gray the G. fuscipes distribution and the location of Uganda. Right: Map of Uganda with Gff sampling sites that are referred to in the text. Different shades of gray identify main water bodies (light gray) and the current Gff distribution (gray). The ranges of the human infective Trypanosoma brucei, T. b. rhodesiense and T. b. gambiense, are superimposed on the Gff distribution and identified with a vertical and horizontal hatched pattern, respectively. The populations analyzed genetically in previous studies are identified with two letters and a symbol for their assignment to one of the three main genetic clusters (dot=southern; star=northern; square= western). The dashed rectangle identifies the contact zone around Lake Kyoga in central Uganda where the northern and southern mtDNA haplogroups co-occur. The four operational blocks identified by PATTEC to progressively eradicate Gff from the Lake Victoria basin from west to east are also identified with small dashed lines and numbers [90,91]. The blocks are based on the Food and Agriculture Organization (FAO) predicted habitat suitability for Gff, natural barriers, major urban areas, international borders, and drainage patterns. Block 1 in the western part of the country is the most isolated block due to the expansion of the city of Kampala and subsequent urbanization and habitat fragmentation of the surrounding area. Block 2 in the central area has been targeted for control to create a buffer zone between the eradication block and the rest of the Gff predicted range in Uganda, while only vector population monitoring activities are planned for the other two blocks during phase 1 of the control program. Upon successful eradication in block 1, block 2 would become the eradication target and so on until the whole basin is tsetse-free.
Figure 2
Figure 2. mtDNA based Gff network and isolation by distance
(A) The mtDNA sequences are grouped into genetically distinct haplogroups. The parsimony network of mtDNA sequences shows the evolutionary relationships among mtDNA haplotypes from Gff Ugandan populations and one population from Sudan and DRC. Each circle represents a unique haplotype, and circle size is proportional to its frequency in the Gff populations sampled. Black dots represent unsampled haplotypes, and each line represents one mutation. The different colors identify the geographic location of the haplogroups (blue, southern; red, northern). The pink and brown dots represent haplotypes found in the sampling sites from Sudan (pink) and DRC (brown). The geographic distribution of these haplogroups shows disjunct: one to the North of Lake Kyoga, the other to the South and West of Lake Kyogo, with the exception of a narrow geographic contact zone around Lake Kyoga, (see [40] for details). Figure modified from [39]. (B) Isolation by distance (IBD) analysis illustrates the relationship between geographic and genetic distance within each of the three population clusters for all pairwise comparisons among Gff populations in Uganda within the northern, western, and southern genetic clusters. Linearized FST (i.e, FST/(1-FST) values were regressed against geographic distance (in kilometers). Red dots refer to comparison within the northern genetic cluster. Green and blue dots refer to comparisons within the western and southern genetic clusters, respectively. Strong signals of IBD were evident in both these regions but particularly in the south (R2 values of 0.35 to 0.52), except for comparisons involving a Kenyan population (Ndere Island, ND, dark blue dots). Figure modified from [38].
Figure 3
Figure 3. Inferred patterns of Gff migrations in Uganda based on microsatellite loci analyses
Schematic summary of the migration patterns among Gff population clusters based on the results of genetic assignment test using microsatellite loci variation. The arrows indicate the direction of immigration of fly genotypes from one population cluster to the other with the thickness of each arrow illustrating the proportion of individuals in the receiving population that exhibit recent immigrant ancestry using genetic data. Names refer to historical and recent HAT foci. Grey shading indicates the water bodies. The dotted line in the central region indicates the zone of contact between northern and southern mtDNA haplotypes. The green ovals show the locations of historical Tbr disease foci, the blue, orange, and brown ovals show the locations of the newly emerging Tbr foci. The Tbg foci in the NW are denoted by purple dots.
Figure 4
Figure 4. Genetic differentiation of Gff around Lake Victoria
Sixteen Gff populations were studied by microsatellite analysis from coastal mainland and island sampling sites. The purple lines identify the 4 PATTEC blocks. The map shows the locations of each sampling site (dots) and the genetic assignment (dot color) of each sampling site based on the Bayesian clustering program Structure: orange = cluster 1; brown = cluster 2; green= cluster 3, and blue = cluster 4. This figure shows that the operational blocks do not coincide with the genetic boundaries of the vector. Figure modified from [42].
Figure 5
Figure 5. The tsetse
Multiple maternally transmitted symbiotic microbes have been described from laboratory lines and different field populations of tsetse, including obligate Wigglesworthia, commensal Sodalis, parasitic Wolbachia, and a DNA virus (Salivary Gland Hypertrophy Virus, SGHV), as schematically shown. Also shown are trypanosomes, which are acquired when tsetse feed on infected animals. The parasites reside in the gut and salivary gland organs. The midgut bacteriome organ, the intrauterine larva, and expanded milk gland tubules, which provide nutrients to the intrauterine progeny of the tsetse, are indicated. Wigglesworthia, Sodalis, and SGHV are maternally transmitted to the intrauterine larva of the tsetse in the secretions of mother's milk, while Wolbachia infects gonadal tissues and is vertically transmitted to developing progeny during embryogenesis.

References

    1. Simarro PP, et al. Estimating and mapping the population at risk of sleeping sickness. PLoS Negl Trop Dis. 2012;6:e1859. - PMC - PubMed
    1. Simarro PP, et al. Eliminating human African trypanosomiasis: where do we stand and what comes next? PLoS Med. 2008;5:e55. - PMC - PubMed
    1. Matemba LE, et al. Quantifying the burden of rhodesiense sleeping sickness in Urambo District, Tanzania. PLoS Negl Trop Dis. 2010;4:e868. - PMC - PubMed
    1. Fevre EM, et al. Estimating the burden of rhodesiense sleeping sickness during an outbreak in Serere, eastern Uganda. BMC Public Health. 2008;8:96. - PMC - PubMed
    1. Simarro PP, et al. The human African trypanosomiasis control and surveillance programme of the World Health Organization 2000-2009: the way forward. PLoS Negl Trop Dis. 2011;5:e1007. - PMC - PubMed

Publication types

MeSH terms

Substances

LinkOut - more resources