. 2013 Dec:83:559-68.
doi: 10.1016/j.neuroimage.2013.07.007. Epub 2013 Jul 9.

Reliable quantification of BOLD fMRI cerebrovascular reactivity despite poor breath-hold performance

Affiliations

Reliable quantification of BOLD fMRI cerebrovascular reactivity despite poor breath-hold performance

Molly G Bright et al. Neuroimage. 2013 Dec.

Abstract

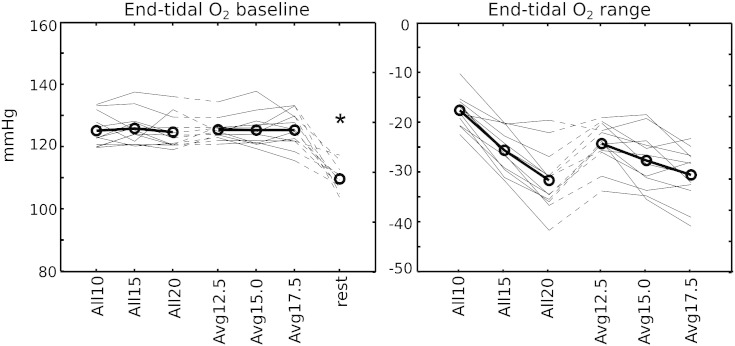
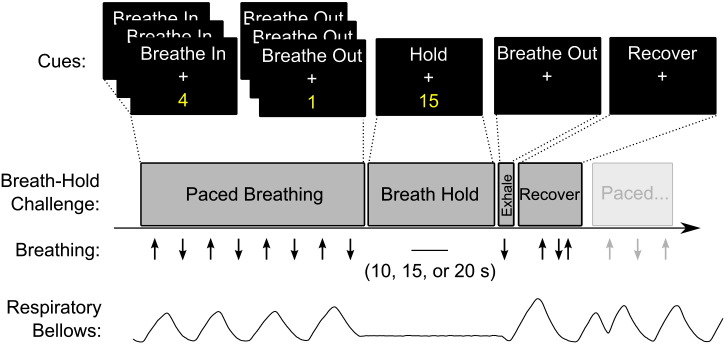
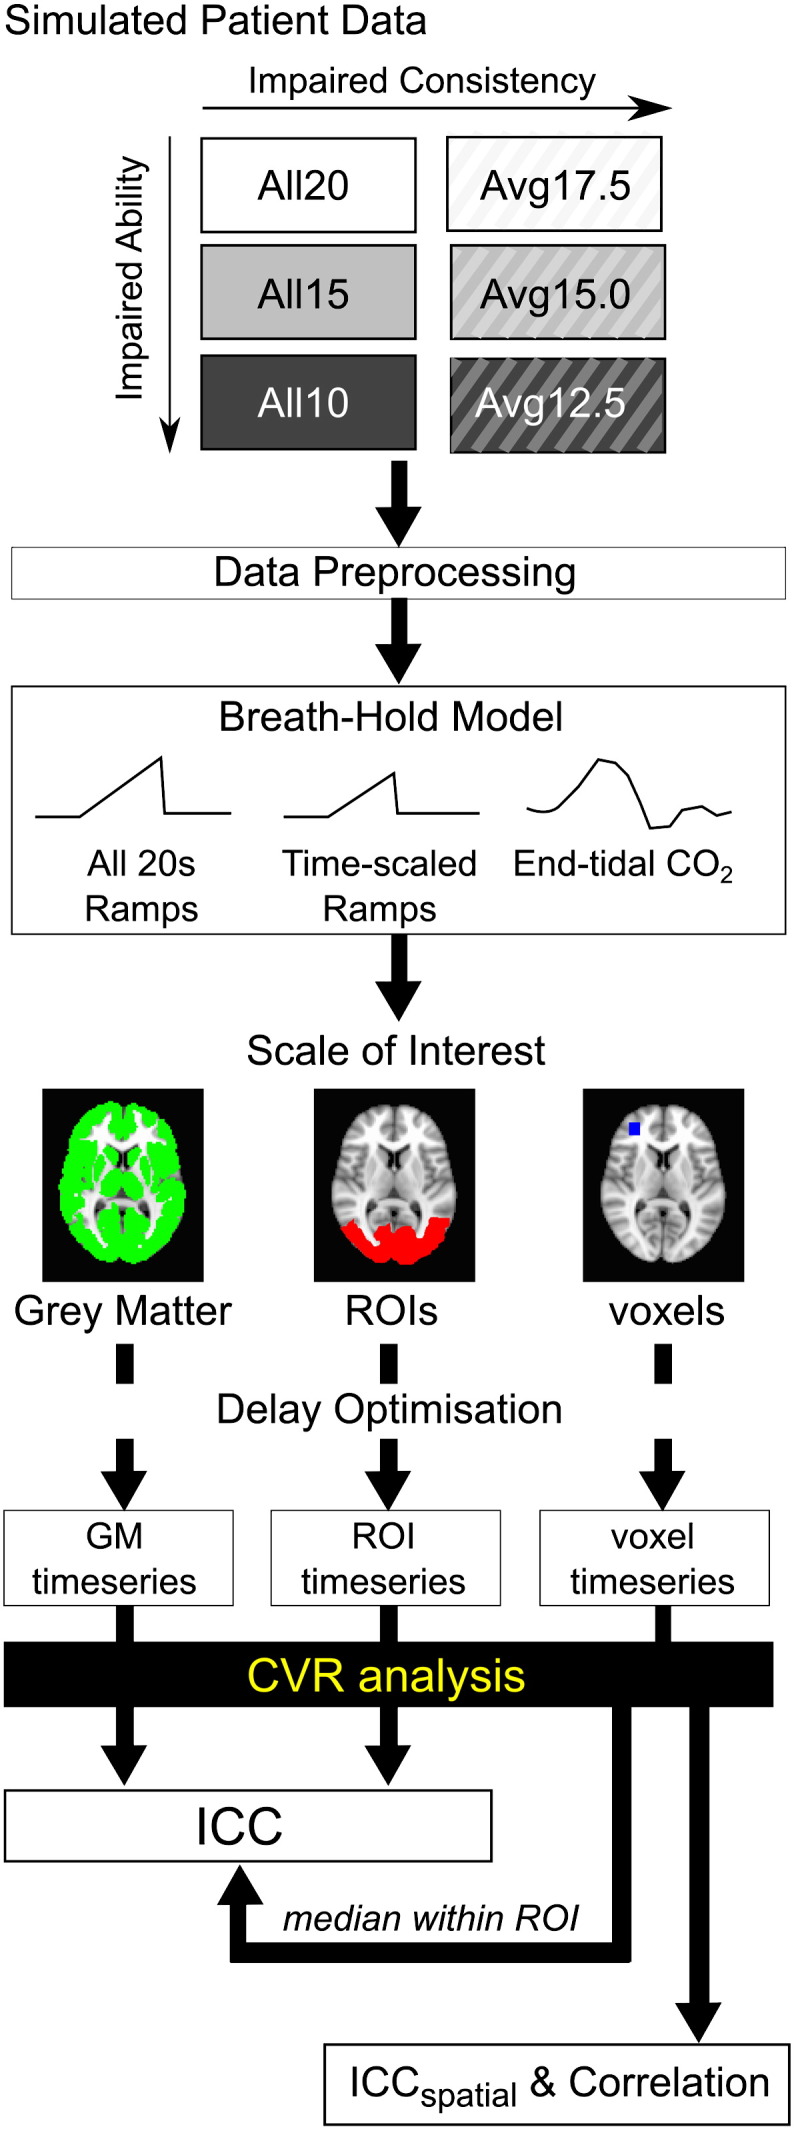
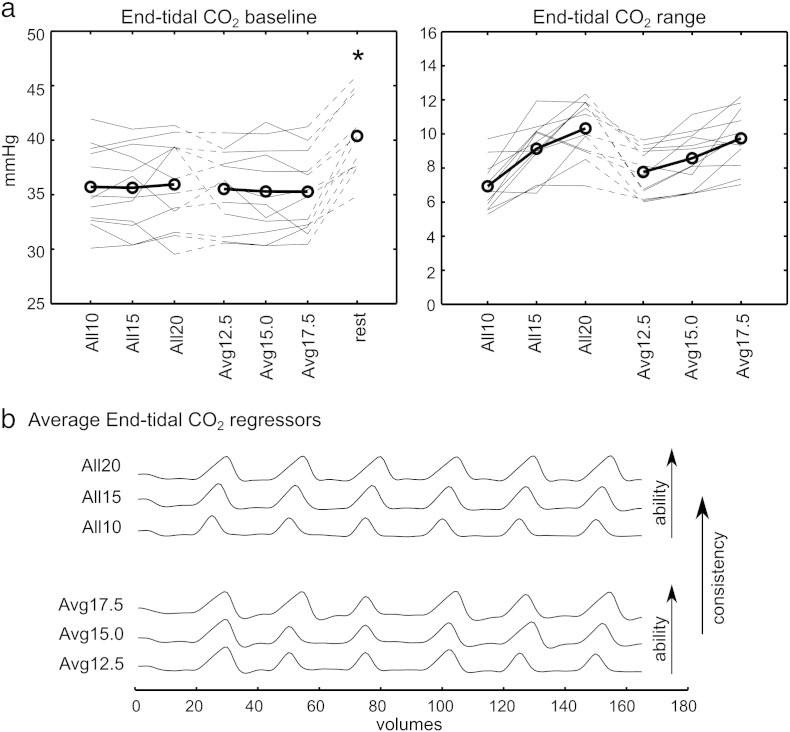
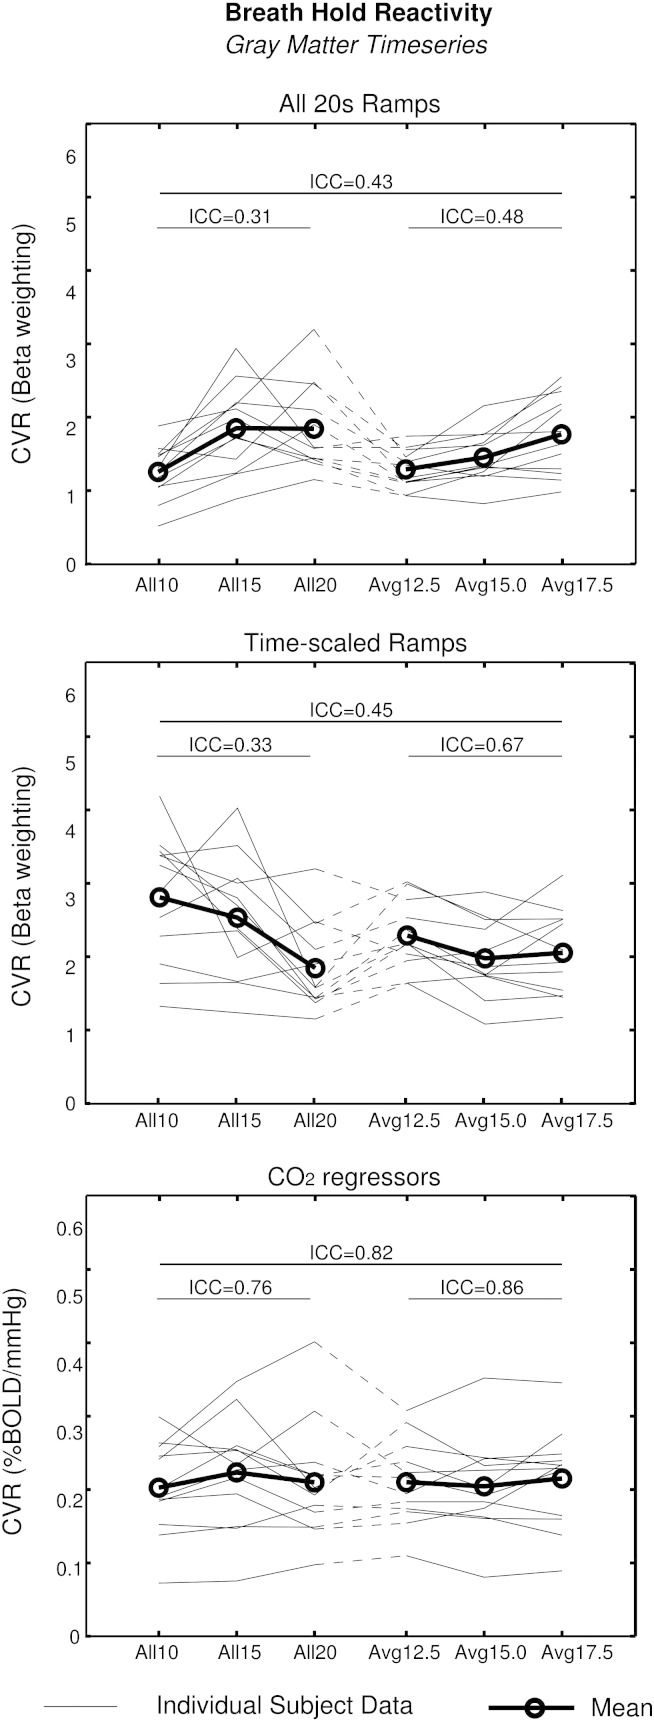
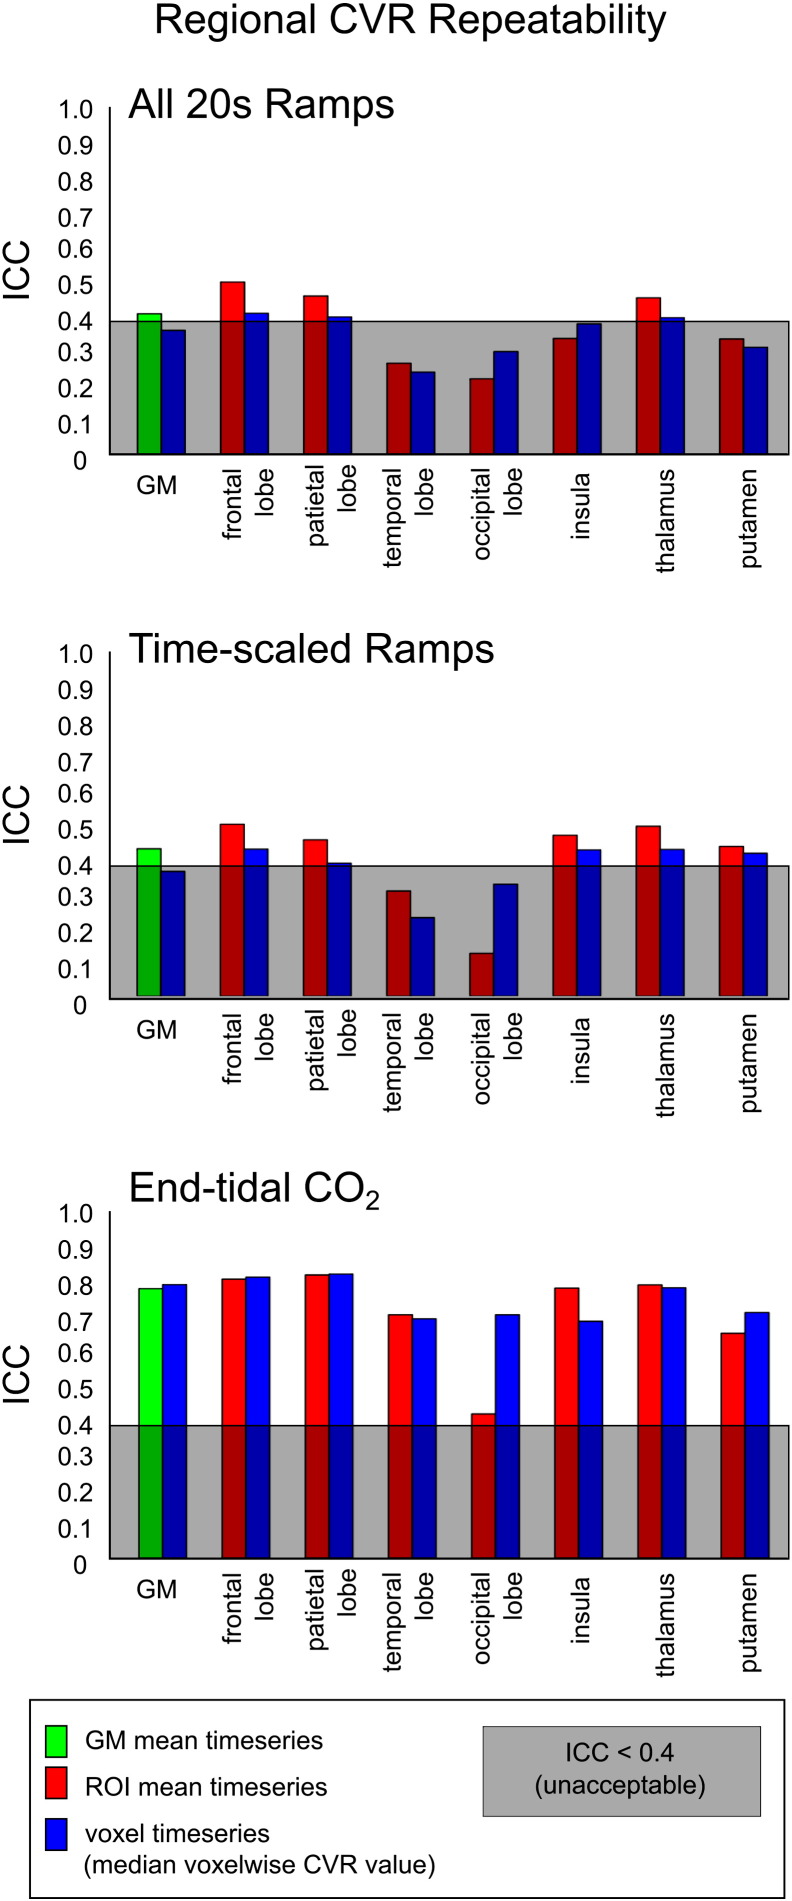
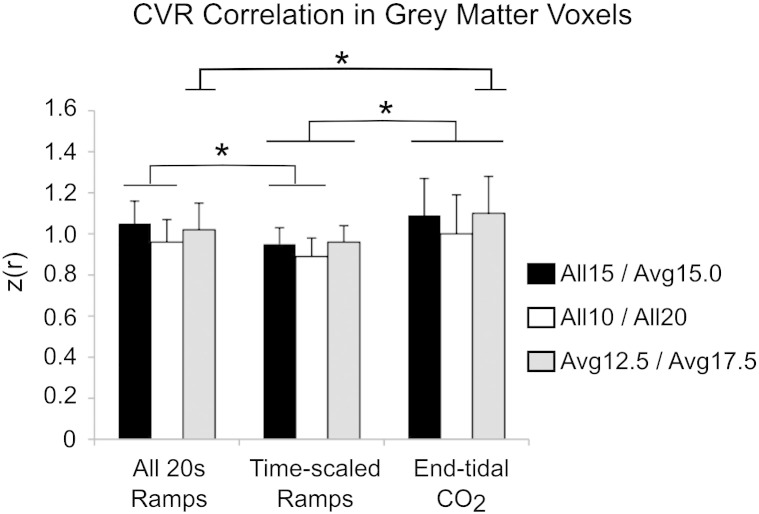
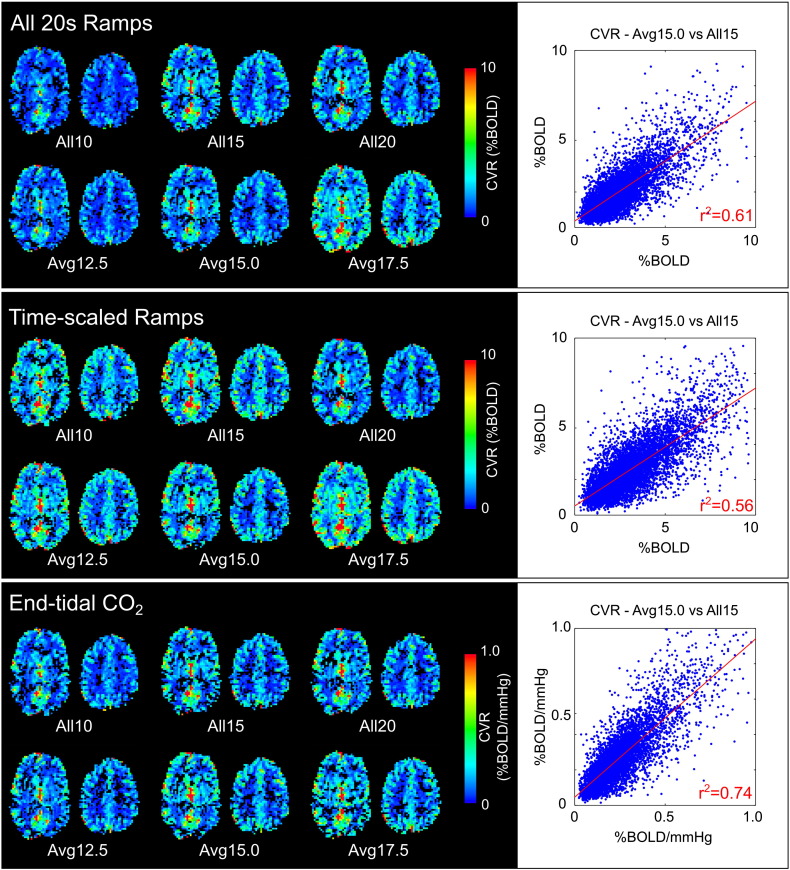
Cerebrovascular reactivity (CVR) can be mapped using BOLD fMRI to provide a clinical insight into vascular health that can be used to diagnose cerebrovascular disease. Breath-holds are a readily accessible method for producing the required arterial CO2 increases but their implementation into clinical studies is limited by concerns that patients will demonstrate highly variable performance of breath-hold challenges. This study assesses the repeatability of CVR measurements despite poor task performance, to determine if and how robust results could be achieved with breath-holds in patients. Twelve healthy volunteers were scanned at 3 T. Six functional scans were acquired, each consisting of 6 breath-hold challenges (10, 15, or 20 s duration) interleaved with periods of paced breathing. These scans simulated the varying breath-hold consistency and ability levels that may occur in patient data. Uniform ramps, time-scaled ramps, and end-tidal CO2 data were used as regressors in a general linear model in order to measure CVR at the grey matter, regional, and voxelwise level. The intraclass correlation coefficient (ICC) quantified the repeatability of the CVR measurement for each breath-hold regressor type and scale of interest across the variable task performances. The ramp regressors did not fully account for variability in breath-hold performance and did not achieve acceptable repeatability (ICC<0.4) in several regions analysed. In contrast, the end-tidal CO2 regressors resulted in "excellent" repeatability (ICC=0.82) in the average grey matter data, and resulted in acceptable repeatability in all smaller regions tested (ICC>0.4). Further analysis of intra-subject CVR variability across the brain (ICCspatial and voxelwise correlation) supported the use of end-tidal CO2 data to extract robust whole-brain CVR maps, despite variability in breath-hold performance. We conclude that the incorporation of end-tidal CO2 monitoring into scanning enables robust, repeatable measurement of CVR that makes breath-hold challenges suitable for routine clinical practice.

Keywords: BOLD; Breath-hold; Cerebrovascular reactivity; Patients; Repeatability.


Figures

Supplementary Figure
Summary of the end-tidal O2 effects associated with the six breath-hold scans. The baseline and range of end-tidal O2 values for each subject are shown and the group mean plotted (circles). The baseline end-tidal O2 values were significantly higher in all six breath-hold scans compared to the resting scan (*p < 0.0005, paired t-tests, Bonferroni corrected for multiple comparisons).
Fig. 1
Fig. 1
Schematic of the breath-hold paradigms. Each challenge was preceded by paced breathing (6 s period) ending on an exhalation, and at the end of the breath-hold a small exhalation was made to provide accurate end-tidal measurements. Following free “recovery” breathing, the paced breathing was resumed. An example trace from the respiratory bellows is provided.
Fig. 2
Fig. 2
Schematic of analysis pipelines used in this study. Six breath-hold scans were acquired to simulate varying levels of ability and consistency. Following standard data preprocessing, CVR was calculated as follows: a breath-hold model was selected, a scale of interest defined, and an optimal delay time between breath-hold regressor and data determined prior to including the regressor in a general linear model. CVR results obtained using grey matter or ROI mean timeseries, as well as the median CVR value obtained from voxelwise values, were used to calculate the intraclass correlation coefficient (ICC) across the 12 subjects and 6 scans. The ICC quantifies the repeatability of a subject's CVR measure despite poor breath-hold performance. The voxelwise CVR values were also compared within an individual subject dataset using correlation analysis and ICCspatial; both of these parameters assess the consistency of spatial patterns of voxelwise CVR values within the grey matter of one subject.
Fig. 3
Fig. 3
Summary of the end-tidal CO2 effects associated with the six breath-hold scans. a) The baseline and range of end-tidal CO2 values for each subject are shown and the group mean plotted (circles). The baseline end-tidal CO2 values were significantly lower in all six breath-hold scans compared to the resting scan (*p < 0.0005, paired t-tests, Bonferroni corrected for multiple comparisons). b) The group average end-tidal CO2 regressor for each of the six scans, accounting for temporal shifts between subjects.
Fig. 4
Fig. 4
Repeatability of CVR values obtained from the GM average timeseries across the six breath-hold scans, for each of the 3 breath-hold models: All 20s Ramps, Time-scaled Ramps, and End-tidal CO2 regressors. CVR values from individual subjects (thin lines) and the group average (thick lines, circles) are shown. The ICC values were calculated from all six breath-hold scans, the three consistent scans (All10, All15 and All20) and the three inconsistent breath-hold scans (Avg12.5, Avg15.0 and Avg17.5) separately, and the results are indicated on the graph.
Fig. 5
Fig. 5
Repeatability of CVR values obtained for a region of interest. CVR was calculated within grey matter (GM) voxels and within 7 additional regions of interest. Values were calculated using both the GM or ROI mean timeseries and by calculating the median voxelwise CVR value. The ICC across the six breath-hold scans was calculated for both sets of results. ICC values below 0.4 (shaded grey) are considered to show “unacceptable” repeatability for fMRI experiments. Across the 8 regions considered, the End-tidal CO2 analysis resulted in significantly greater ICC values, using ROI or voxelwise CVR values, compared to the All 20s Ramps and Time-scaled Ramps analyses (p < 0.0001, paired t-tests, Bonferroni corrected for multiple comparisons).
Fig. 6
Fig. 6
Group results of correlation analysis between pairs of breath-holding datasets that determine the effects of impaired consistency (All15/Avg15.0), impaired ability (All10/All20), or both (Avg12.5/Avg17.5). Voxels within GM showed greater z(r) correlation using the End-tidal CO2 regressors than using the Time-scaled Ramps regressors in all comparisons. The All 20s Ramps model resulted in greater correlation than the Time-scaled Ramps model in the All15/Avg15.0 and All10/All20 comparisons. The End-tidal CO2 model showed greater correlation that the All 20s Ramps model in only the Avg12.5/Avg17.5 comparison (*p < 0.05, paired t-tests, corrected for multiple comparisons).
Fig. 7
Fig. 7
Example CVR maps for one subject. The All 20s Ramps and Time-scaled Ramps analysis result in CVR values with arbitrary units, whereas the End-tidal CO2 analysis results in quantitative CVR values in units of %BOLD/mm Hg. All values within the modified grey matter mask are plotted for the All15 and Avg15.0 data, and the linear fit (red line) and correlation values indicated.

References

    1. Abbott D.F., Opdam H.I., Briellmann R.S., Jackson G.D. Brief breath holding may confound functional magnetic resonance imaging studies. Hum. Brain Mapp. 2005;24:284–290. - PMC - PubMed
    1. Aron A.R., Gluck M.A., Poldrack R.A. Long-term test–retest reliability of functional MRI in a classification learning task. NeuroImage. 2006;29:1000–1006. - PMC - PubMed
    1. Bandettini P.A., Wong E.C., Hinks R.S., Tikofsky R.S., Hyde J.S. Time course EPI of human brain function during task activation. Magn. Reson. Med. 1992;25:390–397. - PubMed
    1. Bodurka J., Ye F., Petridou N., Murphy K., Bandettini P.A. Mapping the MRI voxel volume in which thermal noise matches physiological noise—implications for fMRI. NeuroImage. 2007;34:542–549. - PMC - PubMed
    1. Bright M.G., Bulte D.P., Jezzard P., Duyn J.H. Characterization of regional heterogeneity in cerebrovascular reactivity dynamics using novel hypocapnia task and BOLD fMRI. NeuroImage. 2009;48:166–175. - PMC - PubMed

Publication types