. 2013 Jul 8;24(1):15-29.
doi: 10.1016/j.ccr.2013.05.014.

A genetic progression model of Braf(V600E)-induced intestinal tumorigenesis reveals targets for therapeutic intervention

Affiliations

A genetic progression model of Braf(V600E)-induced intestinal tumorigenesis reveals targets for therapeutic intervention

Roland Rad et al. Cancer Cell. .

Abstract

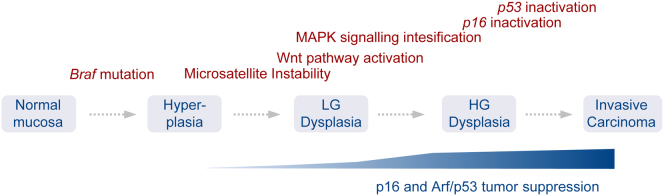
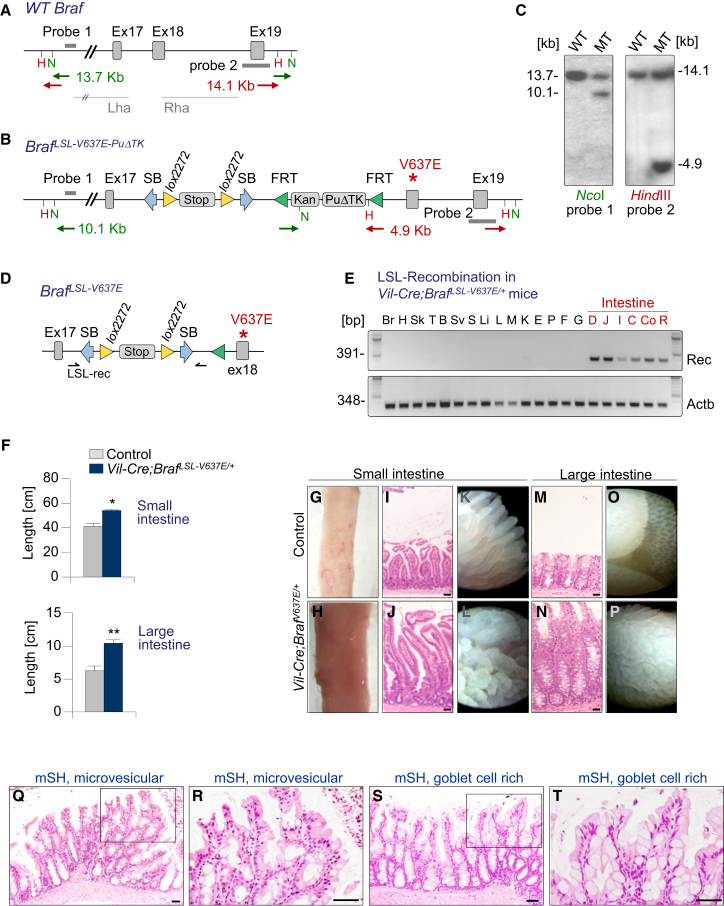
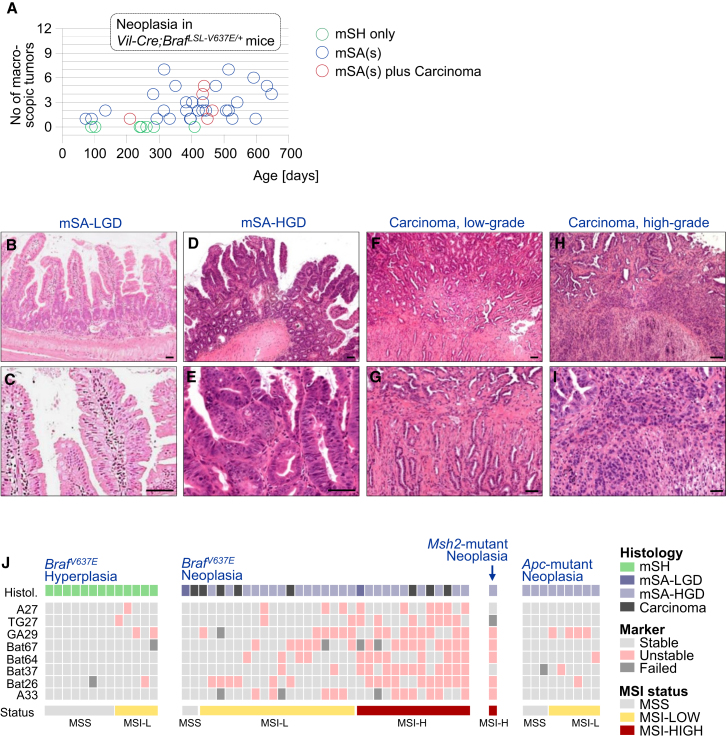
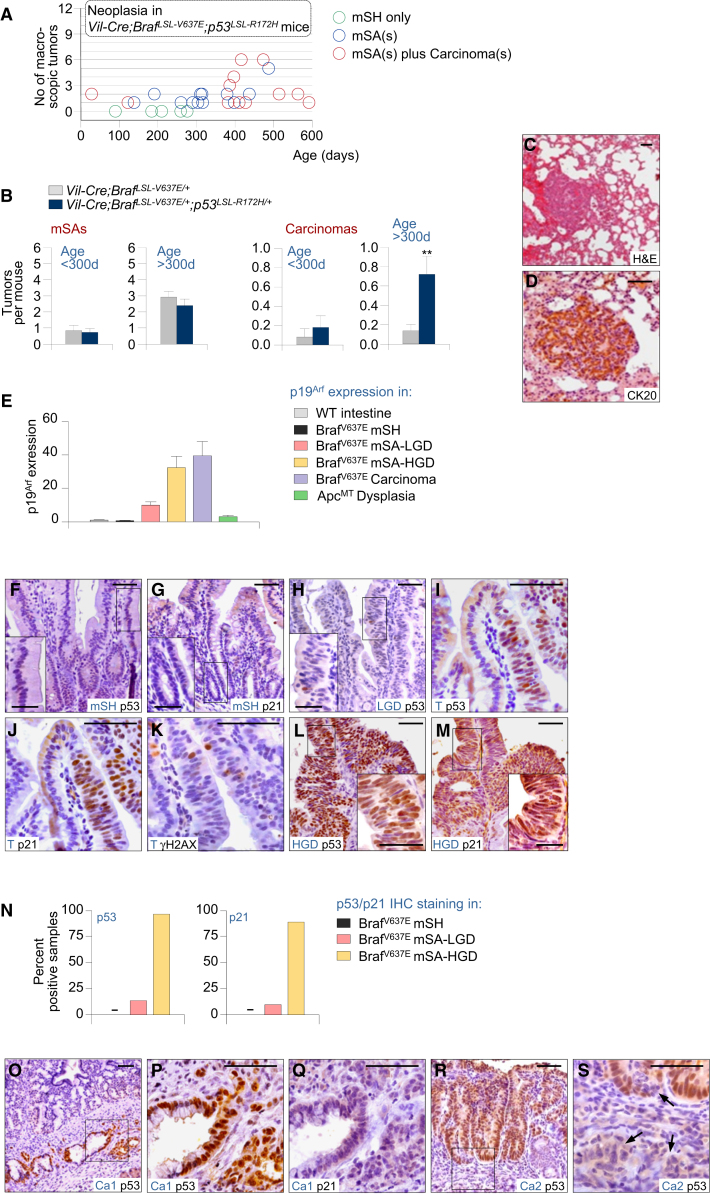
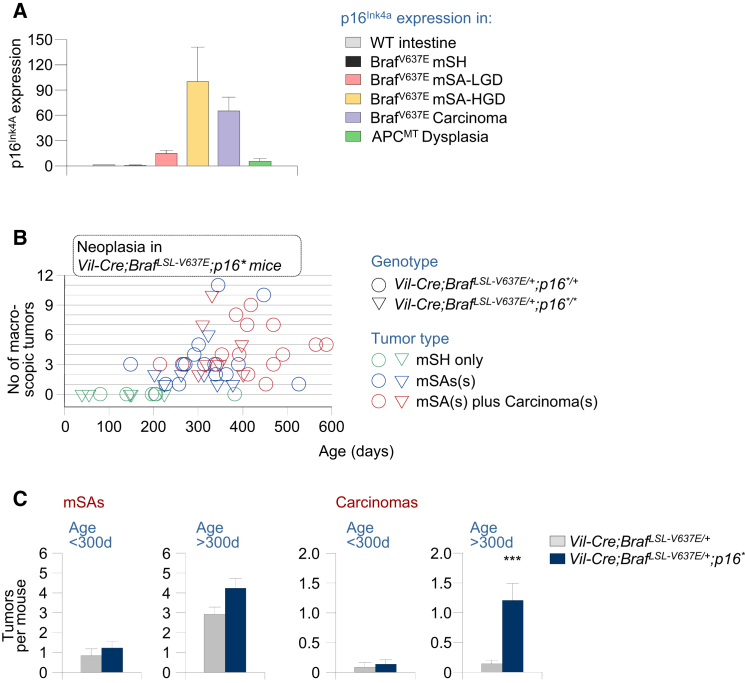
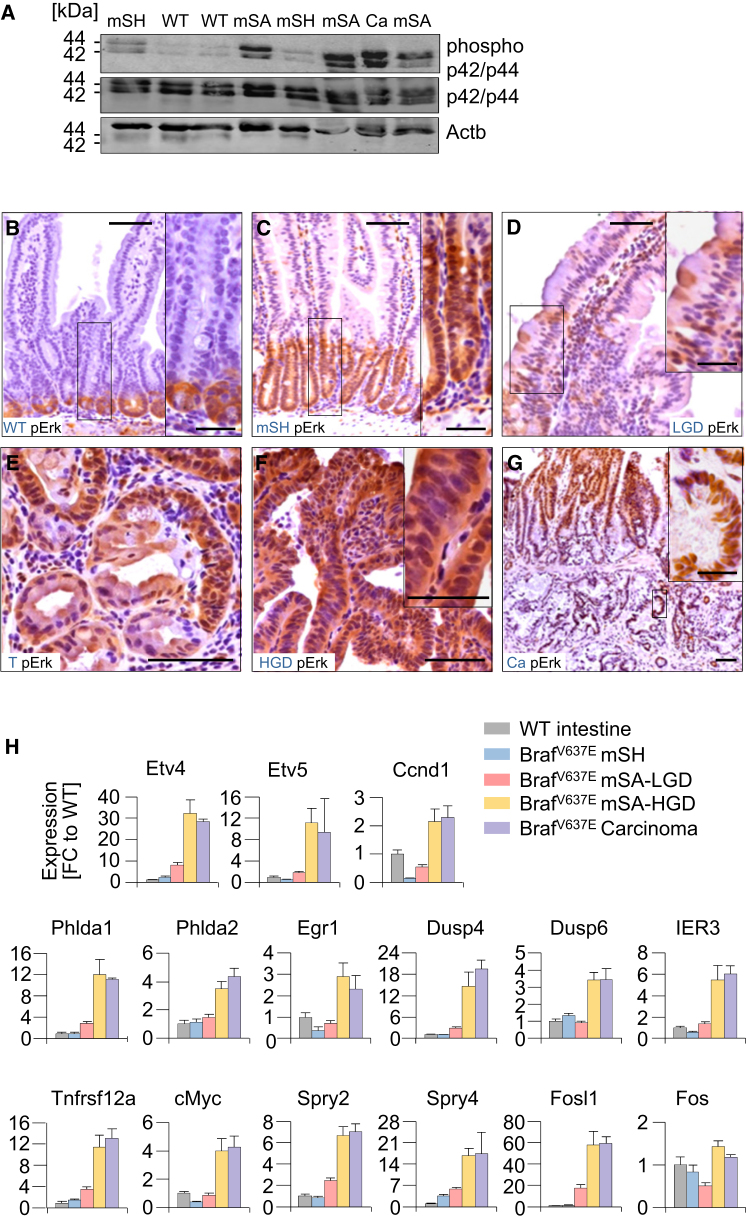
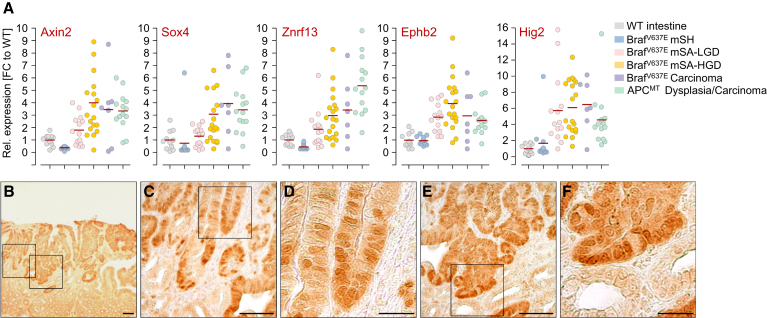
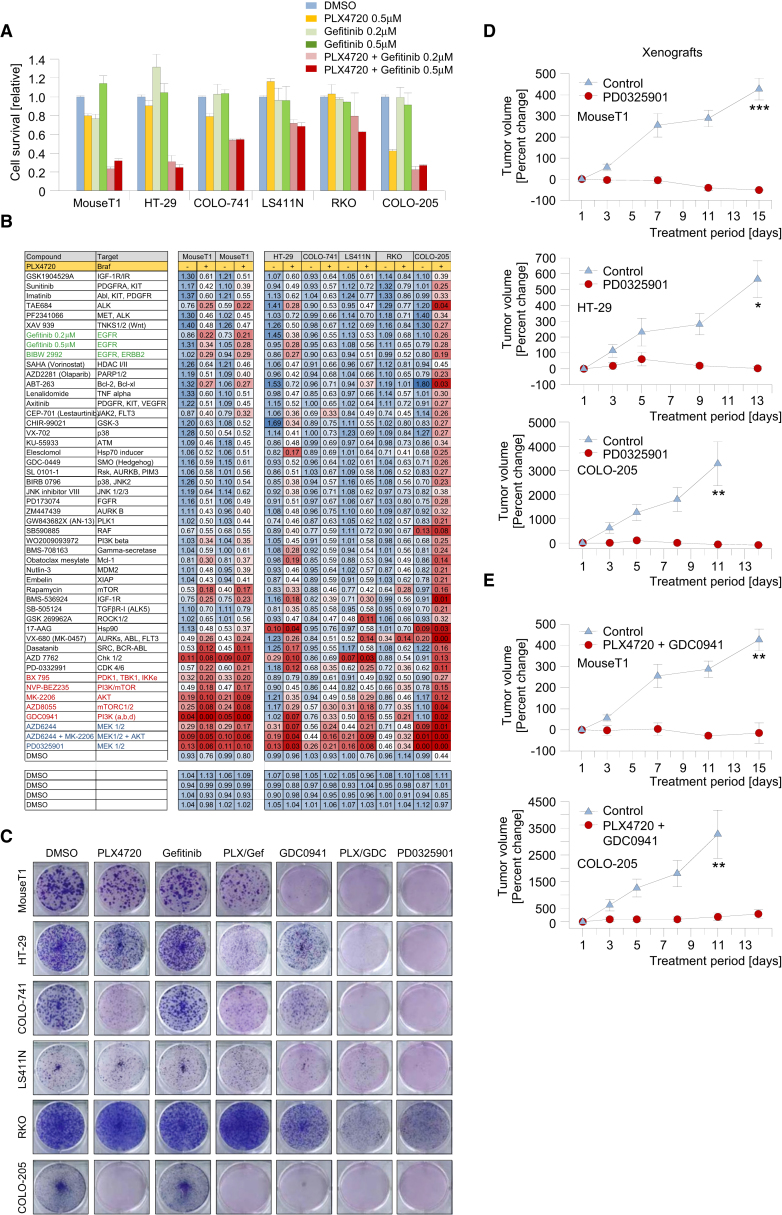
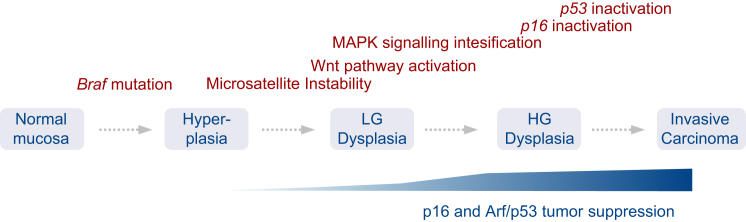
We show that BRAF(V600E) initiates an alternative pathway to colorectal cancer (CRC), which progresses through a hyperplasia/adenoma/carcinoma sequence. This pathway underlies significant subsets of CRCs with distinctive pathomorphologic/genetic/epidemiologic/clinical characteristics. Genetic and functional analyses in mice revealed a series of stage-specific molecular alterations driving different phases of tumor evolution and uncovered mechanisms underlying this stage specificity. We further demonstrate dose-dependent effects of oncogenic signaling, with physiologic Braf(V600E) expression being sufficient for hyperplasia induction, but later stage intensified Mapk-signaling driving both tumor progression and activation of intrinsic tumor suppression. Such phenomena explain, for example, the inability of p53 to restrain tumor initiation as well as its importance in invasiveness control, and the late stage specificity of its somatic mutation. Finally, systematic drug screening revealed sensitivity of this CRC subtype to targeted therapeutics, including Mek or combinatorial PI3K/Braf inhibition.


Figures

None
Graphical abstract
Figure 1
Figure 1
A Mouse Model of BrafV600E-Induced Intestinal Pathology (A–D) Knockin strategy of the BrafV637E allele. Wild-type mouse Braf locus. Lha/Rha, left and right homology arms (A). Targeted Braf-locus (B). The Lox-STOP-Lox cassette has an Engrailed-2 splice acceptor and 4 SV40 polyadenylation sites. It is flanked by Sleeping Beauty inverted terminal repeats permitting SB transposase-dependent V637E activation, a feature not exploited in this study. Southern blot confirming correct targeting (C). F1 males were mated to Rosa26-FlpE females to remove the FRT flanked puromycin resistance cassette (PuΔTK), producing offspring with the BRAFLSL-V637E conditional allele (D). (E) Villin-Cre-induced recombination of the STOP cassette in BrafLSL-V637E/+ mice. Br, brain; H, heart; Sk, skin; T, testis; B, bladder; SV, seminal vesicle; S, spleen; Li, liver; L, lung; M, muscle; K, kidney; E, esophagus; P, pancreas; F, forestomach; G, glandular stomach; D, duodenum; J, jejunum; I, ileum; C, coecum; Co, colon; R, rectum. (F–P) Pronounced generalized intestinal hyperplasia in Vil-Cre;BrafLSL-V637E/+ mice. Length of the small (SI) and large intestine (LI) in Vil-Cre;BrafLSL-V637E/+ mice and BrafLSL-V637E/+ control animals (F). Error bars, SEM; n > 15 per group; p < 0.05; ∗∗p < 0.001 by t test. Thickening and elongation of intestines in Vil-Cre;BrafLSL-V637E/+ mice (G–P). Representative macroscopic (G/H), microscopic (I/J/M/N), and endoscopic (K/L/O/P) images of SI and LI from BrafLSL-V637E/+ controls and Vil-Cre;BrafLSL-V637E/+ mice. Scale bars, 50 μm. (Q–T) Serrated hyperplasia in Vil-Cre;BrafLSL-V637E/+mice. Microvesicular hyperplasia in the SI showing crypt elongation and serrated epithelium. mSH, murine serrated hyperplasia (Q and R). Goblet cell-rich hyperplasia in the large intestine with crypt elongation, sparsely serrated epithelium and large numbers of goblet cells in the large intestine (S and T). Scale bars, 50 μm. See also Figure S1.
Figure 2
Figure 2
Intestinal Neoplasia Development in Vil-Cre;BrafLSL-V637E/+Mice (A) Overview of intestinal neoplasia development in Vil-Cre;BrafLSL-V637E/+mice. Each circle represents one mouse. Green circles, mice without macroscopic neoplasia. Blue circles, mice with macroscopic serrated adenomas mSAs (defined as tumors > 2 mm with dysplasia, identified at necropsy). The mSA number is indicated on the y axis. Animals represented by red circles had mSA(s) plus at least one carcinoma. Microscopic dysplasia is not shown. (B–I) Serrated dysplasia and adenocarcinoma in Vil-Cre;BrafLSL-V637E/+mice. Scale bars, 50 μm. Murine serrated adenoma with low-grade dysplasia (mSA-LGD) in the small intestine showing tubulovillous architecture and serrated, eosinophilic adenomatous epithelium (B and C). Murine serrated adenoma with high-grade dysplasia (mSA-HGD), showing tubulovillous architecture, sparse serration, and a high degree of atypia (D and E). Low-grade adenocarcinoma, showing predominant tubular differentiation (F and G). High-grade adenocarcinoma with remnants of tubular structures in the upper left part, but predominant loss of tubular differentiation in other areas (H and I). (J) Microsatellite instability in BrafV637E-induced hyperplasia/neoplasia as well as Apc- and Msh2 mutant tumors. Eight markers were used for MSI-typing (see the Supplemental Experimental Procedures). Each column represents one sample. Samples were defined as microsatellite stable (MSS; all eight markers stable), MSI-Low (MSI-L; one or more, but < 40% of markers unstable) or MSI-H (≥40% of markers unstable). See also Figure S2 and Table S1.
Figure 3
Figure 3
P53 Is Activated Late during BrafV637E-Induced Intestinal Tumorigenesis and Plays an Important Role in Invasiveness Control (A) Intestinal tumor type, number, and latency in Vil-Cre;BrafLSL-V637E/+;p53LSL-R172H/+ mice. Each circle represents one mouse. Green circles, mice without macroscopic neoplasia. Blue circles, mice with macroscopic serrated adenomas mSAs (defined as tumors > 2 mm with dysplasia, identified at necropsy). (B) Average adenoma and carcinoma number in Vil-Cre;BrafLSL-V637E/+;p53LSL-R172H/+ mice as compared to Vil-Cre;BrafLSL-V637E/+ animals. ∗∗p < 0.01, Mann-Whitney rank sum test. Error bars, SEM. (C and D) Lung metastasis of intestinal cancer in a Vil-Cre;BrafLSL-V637E/+;p53LSL-R172H/+ mouse stains positive for the enterocytes-specific marker CK20. Scale bars, 50 μm. (E) Expression of p19Arf in small intestinal samples with the indicated genotypes and histology; n = 55 (total); error bars, SEM p19Arf was normalized to Actb expression. mSH, murine serrated hyperplasia; mSA-LGD, murine serrated adenoma with low-grade dypslasia; mSA-HGD, murine serrated adenoma with high-grade dysplasia. Error bars, SEM. (F–M) p53, p21, or γH2AX staining in SI samples from Vil-Cre;BrafLSL-V637E/+ mice: hyperplasia (F and G), low-grade dysplasia (H), area with hyperplasia and dysplasia (I–K), high-grade dysplasia (L and M). T, transition hyperplasia/dysplasia; Scale bars, 50 μm for micrographs, 20 μm for insets. (N) Frequency of positive staining for p53 and p21 in indicated sample types from Vil-Cre;BrafV637E/+ mice. N = 110 (for p53); n = 35 (for p21). (O–S) p53 and p21 staining in two carcinomas from Vil-Cre;BrafLSL-V637E/+ mice. A cancer with spontaneous p53 mutation (S152R) stains positive for p53 but negative for p21 (Q and R). In a second cancer there was loss of p53 expression in invading cancer cells (arrows) but not in the area of dysplasia (R and S). Ca, carcinoma. Scale bars, 50 μm. See also Tables S2 and S3.
Figure 4
Figure 4
The Role of p16-Dependent Tumor Suppression in BrafV637E-Induced Intestinal Carcinogenesis (A) p16Ink4a expression (qRT-PCR; normalized to Gapdh) in SI samples with the indicated genotypes and histology; n = 55 (total); Error bars, SEM. (B) Intestinal tumor type, number, and latency in Vil-Cre;BrafLSL-V637E/+;p16/+ and Vil-Cre;BrafLSL-V637E/+;p16/ mice. Each circle/triangle represents one mouse. Green circles/triangles, mice without macroscopic neoplasia. Blue circles/triangles, mice with macroscopic serrated adenomas mSAs (defined as tumors > 2 mm with dysplasia, identified at necropsy). Note that some mice had multiple independent cancers. (C) Average mSA and carcinoma number in Vil-Cre;BrafLSL-V637E/+;p16 mice as compared to Vil-Cre;BrafLSL-V637E/+ animals. p16 indicates all p16 mutant mice (hetero- and homozygous); p < 0.001, Mann-Whitney rank sum test. Error bars, SEM. See also Figure S3 and Tables S4 and S5.
Figure 5
Figure 5
Dysplasia Progression Is Associated with Stage-Specific MAPK Signaling Amplification (A–H) Map-kinase pathway activation and signaling output at different stages of BrafV637E-induced tumor development. Phospho Erk1/2 (phospho-p42/p44) and Erk1/2 (p42/p44) western blot in indicated samples (A). Phospho-Erk IHC staining in indicated samples (B–G). Note in (E) the pErk positive/negative cells in dysplastic/nondysplastic areas of one gland. mSH, murine serrated hyperplasia; LGD, low-grade dypslasia; T, transition (hyperplasia/dysplasia); HGD, high-grade dysplasia; Ca, carcinoma. Scale bars, 50 μm for micrographs, 20 μm for insets. (H) Expression of Erk target genes (qRT-PCR; normalized to Gapdh) in SI samples with the indicated histology and genotypes. FC, fold-change compared to wild-type intestine; n = 41; Error bars, SEM. See also Figure S4.
Figure 6
Figure 6
Frequent Wnt Pathway Activation during BrafV637E-Induced Dysplasia Progression (A) Expression of Wnt target genes (qRT-PCR; normalized to Gapdh) in SI samples with indicated histology and genotypes. n = 11 (wild-type), 53 (Braf mutant), and 14 (Apc mutant tissues). Red lines, mean. (B–F) β-Catenin staining in BrafV637E-induced hyperplasia/dysplasia. Scale bars, 50 μm (B, C, and E) or 20 μm (D and F). See also Figure S5 and Table S6.
Figure 7
Figure 7
Systematic Drug Screening Identifies Targets for Therapeutic Intervention in BrafV637E-Induced Murine and Human Cancers (A) In vitro growth inhibition assays (CellTiter-Blue assay) using a murine and five human BRAF mutant intestinal cancer cell lines. Drug treatment was performed for 6 days. Error bars, SEM; n = 2. (B) Systematic drug sensitivity screens using 50 compounds. For each cell line, drugs were used as single agents (left columns) or in combination with 0.5 μM PLX4720 (right columns). Cell viability was determined after 6 days of treatment using CellTiter-Blue. Results are shown relative to DMSO control treatment. One of two determinations with similar results is shown. (C) Long-term colony-forming assays. Cells were treated with PLX4720 (0.5 μM), Gefitinib (0.5 μM), the PI3K inhibitor GDC0941 (0.5 μM), and the Mek inhibitor PD0325901 (0.002 μM) as single agents or their combination as indicated. One of two determinations with similar results is shown. (D) The Mek inhibitor PD0325901 suppresses tumor growth in allo- and xenograft models. The Braf mutant murine (MouseT1) and human (HT-29 and COLO-205) cell lines were transplanted s.c. into Nod Scid IL12Rgnull (NSG) mice. Treatment was started when tumors were palpable (day 1). Animals were treated once daily with vehicle (control) or 25 mg/kg/day of PD0325901 for 15 days by oral gavage. p < 0.05; ∗∗p < 0.01; ∗∗∗p < 0.001; Mann-Whitney rank sum or t test; Error bars, SEM; n = 4–5 mice per group. (E) Combinatorial Braf/PI3K inhibition suppresses tumor growth of MouseT1 and COLO-205 cells, transplanted s.c. into NSG mice. Animals were treated with vehicle (control) or PLX4720 50 mg/kg/day once daily plus GDC09041 75 mg/kg/day twice daily by oral gavage. Error bars, SEM; n = 3–5 mice per group; ∗∗p < 0.01; t test. See also Figure S6 and Table S7.
Figure 8
Figure 8
Progression Model of BrafV637E-Induced Intestinal Cancer Development Braf mutation induces sustained hyperplasia. MSI-H develops in 40% of cases and is observed in all subsequent stages of tumorigenesis, suggesting its early development. Dysplasia progression is driven by stage-specific Wnt pathway activation and Braf/Mek/Erk signaling intensification. Selective pressure for inactivation of the p16/Rb and Arf/p53 pathways develops late during tumorigenesis and promotes invasion and metastasis but does not accelerate early adenoma initiation. This late-stage specificity results from the inability of low-dose Mapk signaling to activate these tumor suppressors at early stages of tumorigenesis.

Similar articles

Cited by

References

    1. Bennecke M., Kriegl L., Bajbouj M., Retzlaff K., Robine S., Jung A., Arkan M.C., Kirchner T., Greten F.R. Ink4a/Arf and oncogene-induced senescence prevent tumor progression during alternative colorectal tumorigenesis. Cancer Cell. 2010;18:135–146. - PubMed
    1. Bettington M., Walker N., Clouston A., Brown I., Leggett B., Whitehall V. The serrated pathway to colorectal carcinoma: current concepts and challenges. Histopathology. 2013;62:367–386. - PubMed
    1. Bond C.E., Umapathy A., Ramsnes I., Greco S.A., Zhao Z.Z., Mallitt K.A., Buttenshaw R.L., Montgomery G.W., Leggett B.A., Whitehall V.L. P53 mutation is common in microsatellite stable, BRAF mutant colorectal cancers. Int. J. Cancer. 2011;130:1567–1576. - PubMed
    1. Burd C.E., Sorrentino J.A., Clark K.S., Darr D.B., Krishnamurthy J., Deal A.M., Bardeesy N., Castrillon D.H., Beach D.H., Sharpless N.E. Monitoring tumorigenesis and senescence in vivo with a p16(INK4a)-luciferase model. Cell. 2013;152:340–351. - PMC - PubMed
    1. Carragher L.A., Snell K.R., Giblett S.M., Aldridge V.S., Patel B., Cook S.J., Winton D.J., Marais R., Pritchard C.A. V600EBraf induces gastrointestinal crypt senescence and promotes tumour progression through enhanced CpG methylation of p16INK4a. EMBO Mol Med. 2010;2:458–471. - PMC - PubMed

Publication types

MeSH terms

Substances