Review
. 2013 Jul;6(7):806-22.
doi: 10.1016/j.jcmg.2013.05.005.

Advances in parametric mapping with CMR imaging

Affiliations
Review

Advances in parametric mapping with CMR imaging

Michael Salerno et al. JACC Cardiovasc Imaging. 2013 Jul.

Erratum in

  • JACC Cardiovasc Imaging. 2013 Aug;6(8):929-30

Abstract

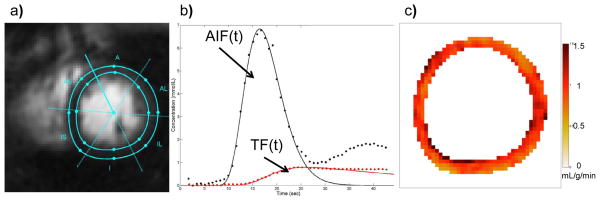
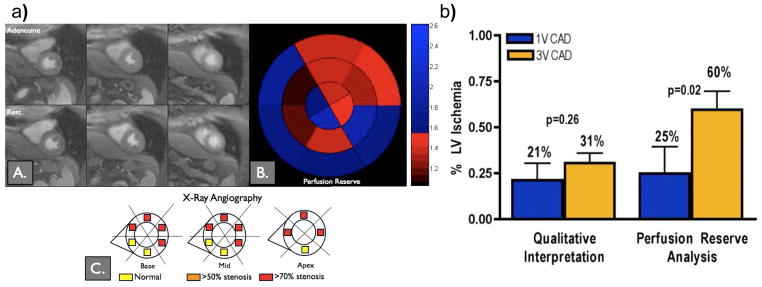
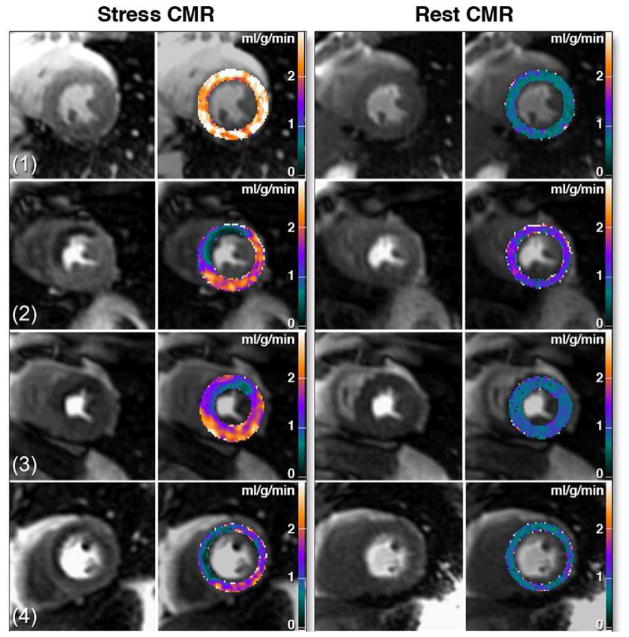
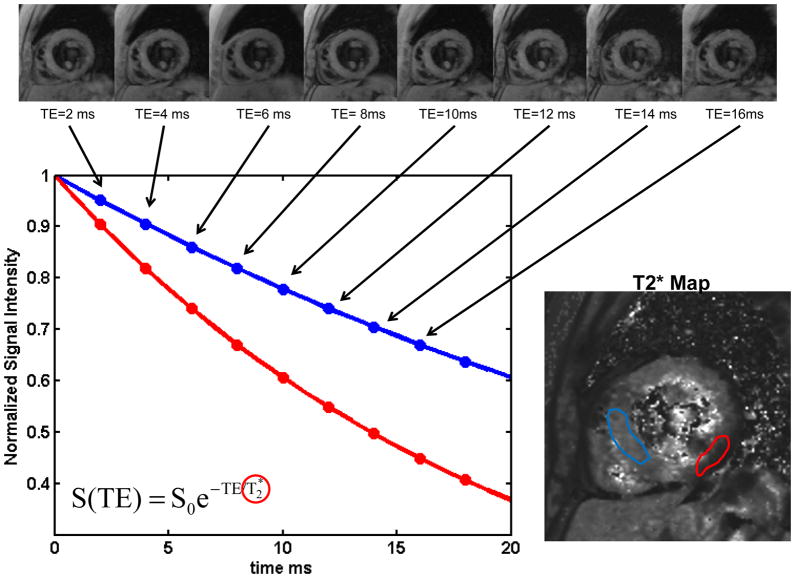
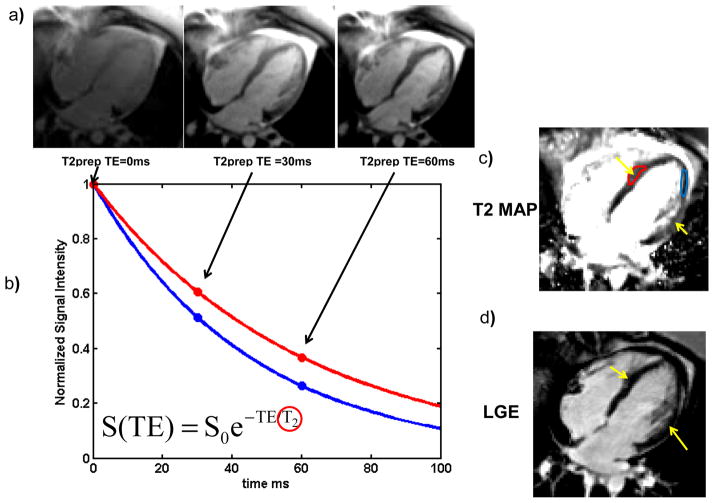
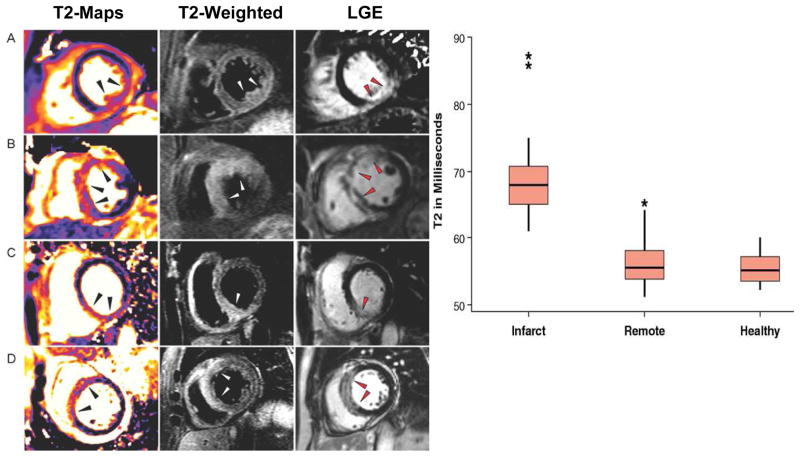
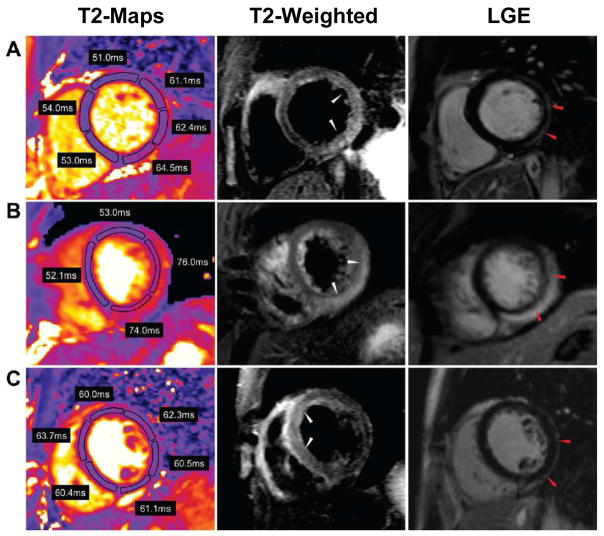
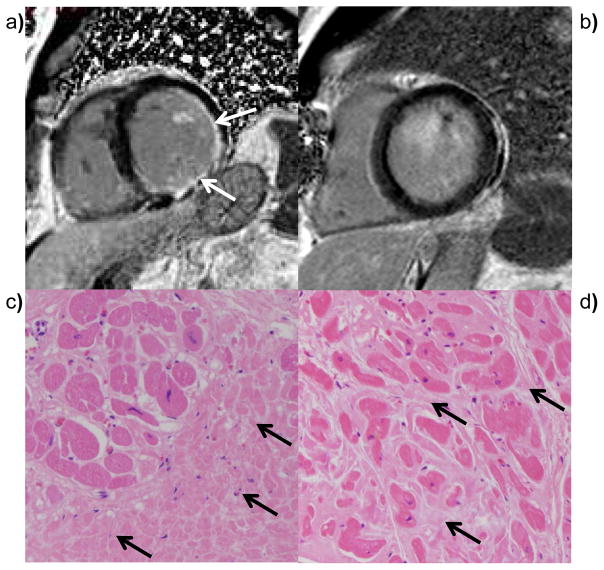
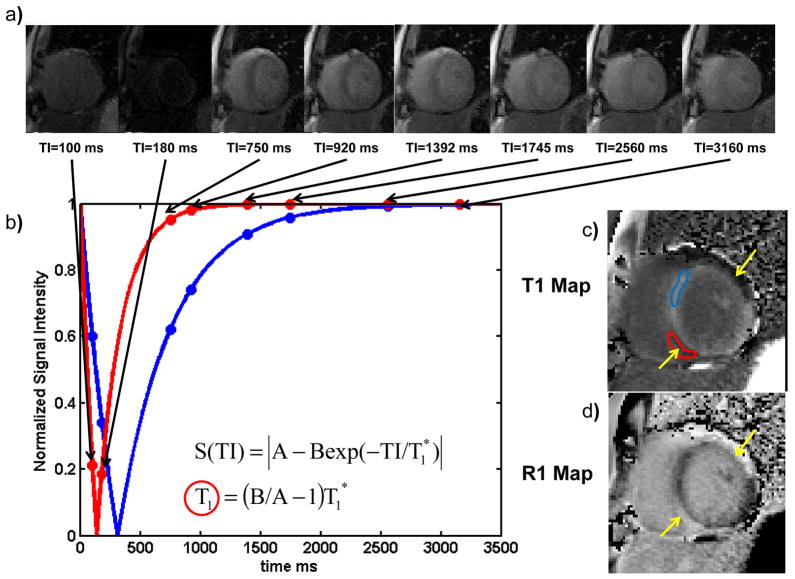
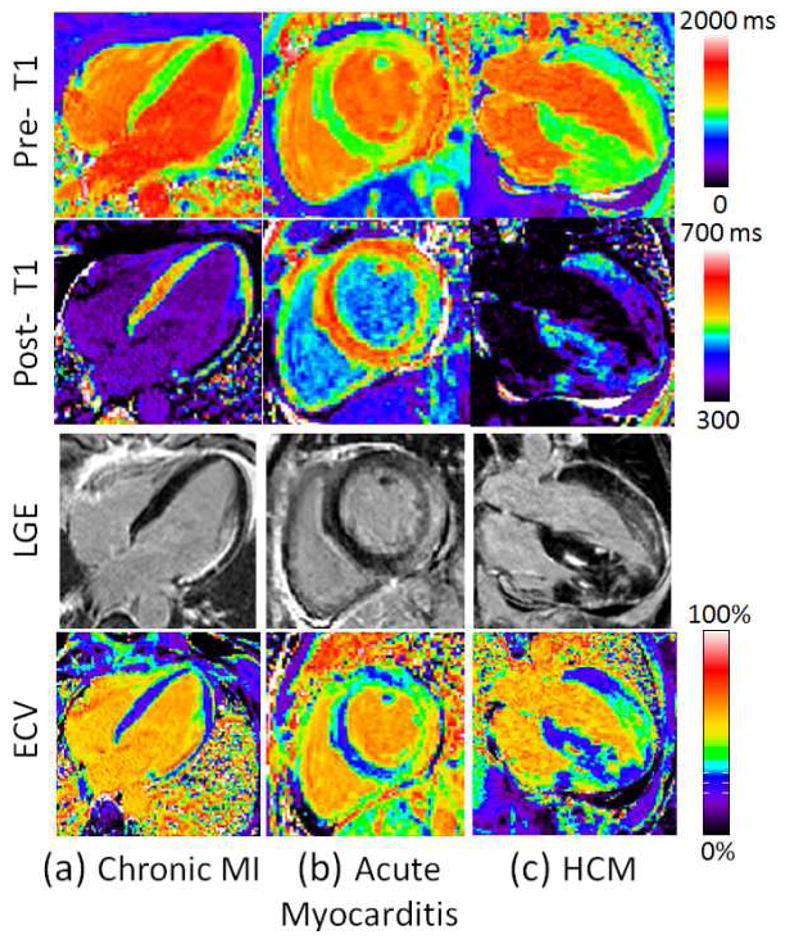
Cardiac magnetic resonance imaging (CMR) is well established and considered the gold standard for assessing myocardial volumes and function, and for quantifying myocardial fibrosis in both ischemic and nonischemic heart disease. Recent developments in CMR imaging techniques are enabling clinically-feasible rapid parametric mapping of myocardial perfusion and magnetic relaxation properties (T1, T2, and T2* relaxation times) that are further expanding the range of unique tissue parameters that can be assessed using CMR. To generate a parametric map of perfusion or relaxation times, multiple images of the same region of the myocardium are acquired with different sensitivity to the parameter of interest, and the signal intensities of these images are fit to a model which describes the underlying physiology or relaxation parameters. The parametric map is an image of the fitted perfusion parameters or relaxation times. Parametric mapping requires acquisition of multiple images typically within a breath-hold and thus requires specialized rapid acquisition techniques. Quantitative perfusion imaging techniques can more accurately determine the extent of myocardial ischemia in coronary artery disease and provide the opportunity to evaluate microvascular disease with CMR. T1 mapping techniques performed both with and without contrast are enabling quantification of diffuse myocardial fibrosis and myocardial infiltration. Myocardial edema and inflammation can be evaluated using T2 mapping techniques. T2* mapping provides an assessment of myocardial iron-overload and myocardial hemorrhage. There is a growing body of evidence for the clinical utility of quantitative assessment of perfusion and relaxation times, although current techniques still have some important limitations. This article will review the current imaging technologies for parametric mapping, emerging applications, current limitations, and potential of CMR parametric mapping of the myocardium. The specific focus will be the assessment and quantification of myocardial perfusion and magnetic relaxation times.


Figures

Figure 1
Figure 1. Absolute Quantification of Perfusion using Fermi-function deconvolution from a dual-sequence spiral trajectory acquisition
(a) The myocardium is segmented to generate time intensity curves for the myocardial tissue function (TF). (b) The signal intensity is converted into concentration of gadolinium for both the arterial input function (AIF) and tissue function prior to deconvolution. (c) a pixel-by-pixel perfusion map shows uniform perfusion of 1mL/g-min in this normal volunteer.
Figure 2
Figure 2. Quantitative Perfusion may be useful in determining extent of ischemia in multi-vessel disease
(a) Visual analysis of the stress images does not show a significant perfusion abnormality, however quantification shows a region of reduced perfusion reserve corresponding to an abnormality found in the LAD at cardiac catheterization. (b) Although visual and quantitative analysis had similar diagnostic accuracy, quantitative analysis revealed a larger area of ischemia in 3 vessel disease as compared to single vessel disease and may be important for quantifying the volume of ischemic myocardium. (Adapted from Patel et al. figures 4 and 5(2))
Figure 3
Figure 3. Pixel-wise CMR perfusion maps at stress and rest from a healthy volunteer (1) and from 3 patients with coronary artery disease
High quality pixel-wise maps are feasible using non-rigid registration for motion correction. (Adapted from Hsu et. al. figure 7 (33))
Figure 4
Figure 4. Calculation of T2* maps in a normal subject
(a) A set of gradient echo images acquired with different echo times (TE) from 2ms to 18 ms are acquired. As the TE is increased the signal intensity decreases due to static field inhomogeneities resulting in T2* decay. (b) The data from each pixel is fit to a T2* decay curve. Pixels with longer T2* decay more slowly (red curve) as compared to regions with shorter T2* blue curve). (c) the T2* map shows a region of reduced T2* in the inferolateral wall which is caused by susceptibility artifact and can be seen even in normal subjects.
Figure 5
Figure 5. Calculation of T2 maps using a T2-PREP pulse sequence in a patient with atypical Takusubo cardiomyopathy
(a) Multiple images with T2-Prepations with different TE are acquired. As the TE is increased for this spin-echo-based preparation, the myocardial signal intensity decreases due to T2 decay. (b) The data from each pixel is fit to a T2 decay curve, pixels with longer T2 (red curve) decay more slowly than regions with shorter T2 (blue curve). (c) The T2 map shows a region of edema (Yellow arrows and Red ROI) in this patient. (d) The absence of LGE confirms the diagnosis of atypical Takusubo cardiomyopathy.
Figure 6
Figure 6
(a) T2 maps, T2-weighted and LGE images from patients with acute myocardial infarction. (b) The T2 relaxation time was significantly increased in the region of the infarct as compared to remote and healthy myocardium. (Adapted from Verhaert et. al. figures 1 and 2 (6))
Figure 7
Figure 7. T2 maps, T2-weighted and LGE images from 3 patients with acute myocarditis
T2 is increased in multiple regions of the myocardium and may show more diffuse involvement than is evident on T2-weighted images. (Adapted from Thavendiranathan et. al. figure #(7))
Figure 8
Figure 8. Calculation of post contrast T1 maps using a modified MOLLI pulse sequence in a patient with myocarditis
Following an inversion pulse, images are obtained in subsequent heart beats to obtain images at multiple different inversion times during the same phase of the cardiac cycle. As the inversion time increases the longitudinal magnetization increases due to T1 recovery. (b) The data are sorted by inversion time and fit to T1 relaxation curves. Pixels with inflammation have shorter T1-s post contrast and recover more rapidly (red curve) than regions of normal myocardium. (d) T1 mapping shows two epicardial regions with inflammation (yellow arrows and red ROI). (e) By inverting the pixel values an R1 map can be generated which has a contrast appearance similar to conventional LGE images.
Figure 9
Figure 9. Diffuse fibrosis is not apparent on conventional LGE images. (a) LGE images from an ischemic cardiomyopathy demonstrate a focal region of LGE corresponding to prior myocardial infarction
(b) This region of increased signal intensity corresponds to focal fibrosis in the infarct on H&E stained myocardium. (c) LGE images from a patient with dilated cardiomyopathy do not demonstrate any focal LGE, however (d) histological evaluation would demonstrate diffuse interstitial fibrosis this is not identifiable by LGE imaging.
Figure 10
Figure 10
(a) Examples illustrating excellent agreement between LGE and ECV in cases of focal abnormalities in myocardial ECV. Pre-contrast T1-maps (top row), post-contrast T1-maps (2nd row), late gadolinium enhancement (3rd row), and ECV maps (bottom row) for patients with: (a) chronic MI, (b) acute myocarditis, and (c) HCM. (Adapted from Kellman et al. figure 4 (71))

Comment in

  • Evolution and revolution in CMR imaging.
    Nagel E, Narula J. Nagel E, et al. JACC Cardiovasc Imaging. 2013 Jul;6(7):837-8. doi: 10.1016/j.jcmg.2013.05.007. JACC Cardiovasc Imaging. 2013. PMID: 23845577 No abstract available.

References

    1. Lorenz CH, Walker ES, Morgan VL, Klein SS, Graham TP., Jr Normal human right and left ventricular mass, systolic function, and gender differences by cine magnetic resonance imaging. J Cardiovasc Magn Reson. 1999;1:7–21. - PubMed
    1. Patel AR, Antkowiak PF, Nandalur KR, et al. Assessment of advanced coronary artery disease: advantages of quantitative cardiac magnetic resonance perfusion analysis. J Am Coll Cardiol. 2010;56:561–9. - PMC - PubMed
    1. Jerosch-Herold M, Sheridan DC, Kushner JD, et al. Cardiac magnetic resonance imaging of myocardial contrast uptake and blood flow in patients affected with idiopathic or familial dilated cardiomyopathy. Am J Physiol Heart Circ Physiol. 2008;295:H1234–H1242. - PMC - PubMed
    1. Iles L, Pfluger H, Phrommintikul A, et al. Evaluation of diffuse myocardial fibrosis in heart failure with cardiac magnetic resonance contrast-enhanced T1 mapping. J Am Coll Cardiol. 2008;52:1574–80. - PubMed
    1. Flett AS, Hayward MP, Ashworth MT, et al. Equilibrium contrast cardiovascular magnetic resonance for the measurement of diffuse myocardial fibrosis: preliminary validation in humans. Circulation. 2010;122:138–44. - PubMed

Publication types