

Fast acquisition and reconstruction of optical coherence tomography images via sparse representation
- PMID: 23846467
- PMCID: PMC4000559
- DOI: 10.1109/TMI.2013.2271904
Fast acquisition and reconstruction of optical coherence tomography images via sparse representation
Abstract
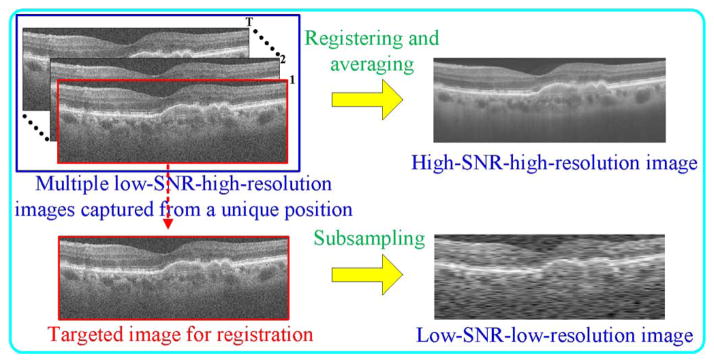
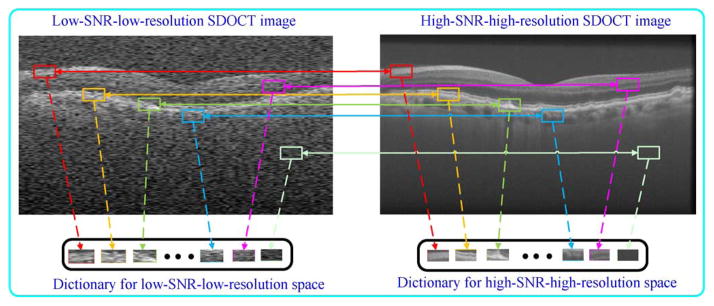
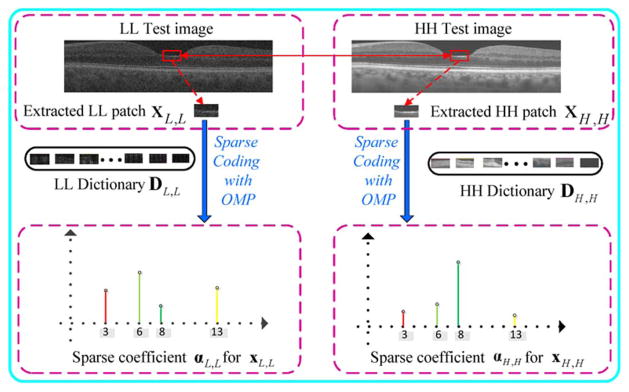
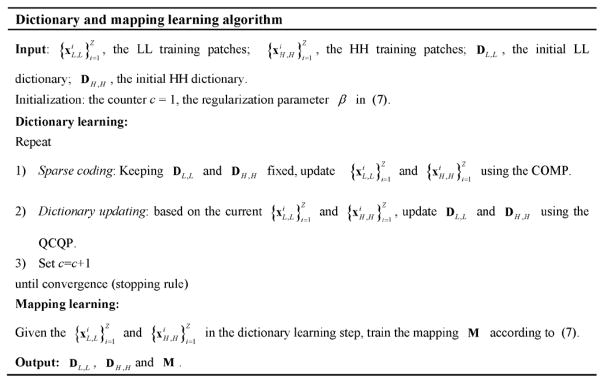
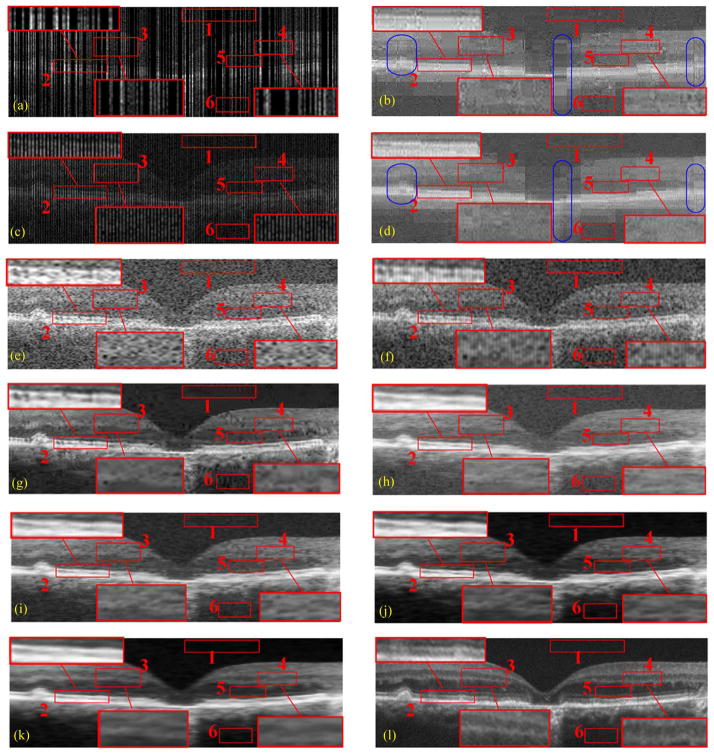
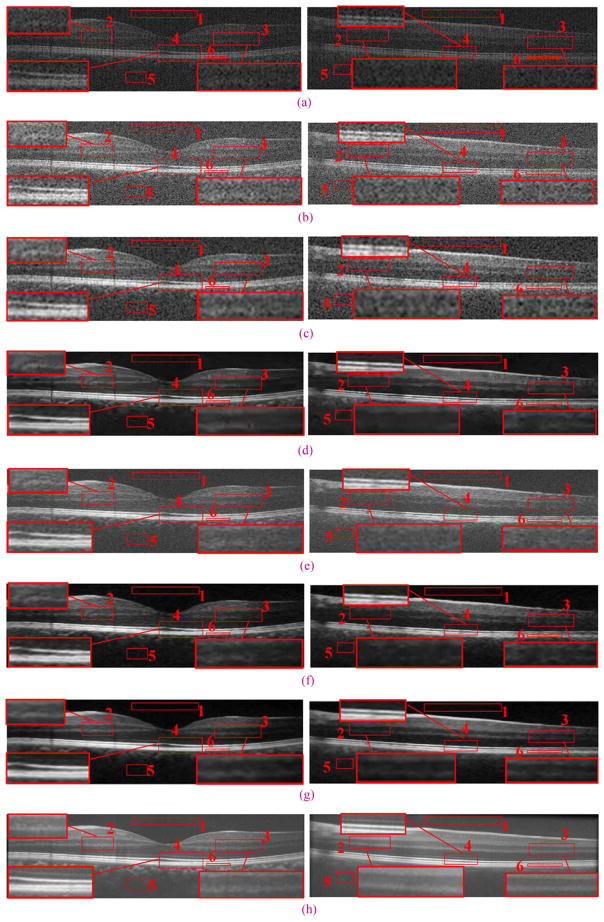
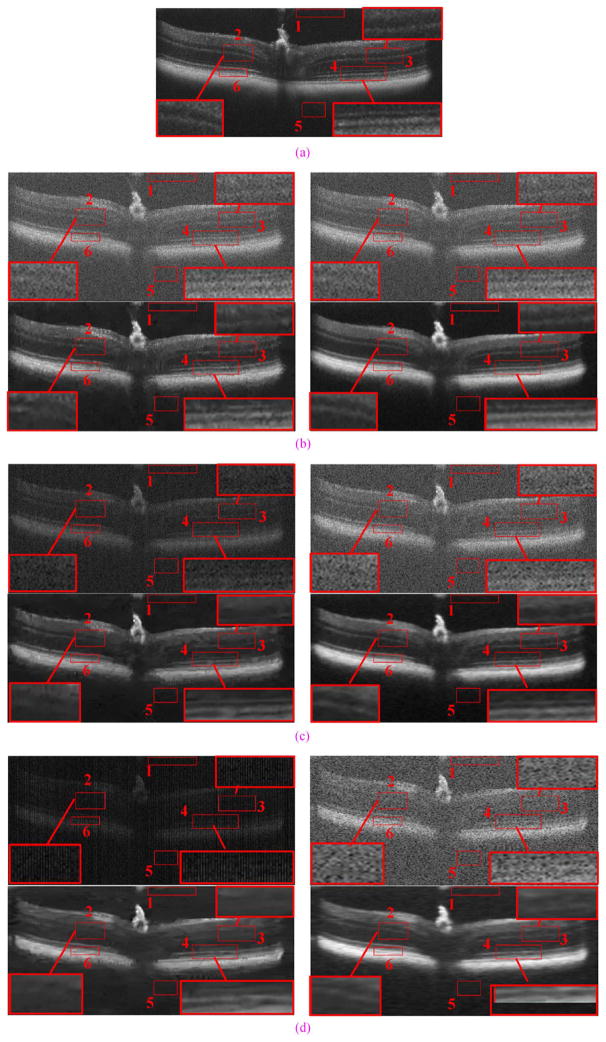
In this paper, we present a novel technique, based on compressive sensing principles, for reconstruction and enhancement of multi-dimensional image data. Our method is a major improvement and generalization of the multi-scale sparsity based tomographic denoising (MSBTD) algorithm we recently introduced for reducing speckle noise. Our new technique exhibits several advantages over MSBTD, including its capability to simultaneously reduce noise and interpolate missing data. Unlike MSBTD, our new method does not require an a priori high-quality image from the target imaging subject and thus offers the potential to shorten clinical imaging sessions. This novel image restoration method, which we termed sparsity based simultaneous denoising and interpolation (SBSDI), utilizes sparse representation dictionaries constructed from previously collected datasets. We tested the SBSDI algorithm on retinal spectral domain optical coherence tomography images captured in the clinic. Experiments showed that the SBSDI algorithm qualitatively and quantitatively outperforms other state-of-the-art methods.
Figures
Similar articles
-
Sparsity based denoising of spectral domain optical coherence tomography images.Biomed Opt Express. 2012 May 1;3(5):927-42. doi: 10.1364/BOE.3.000927. Epub 2012 Apr 12. Biomed Opt Express. 2012. PMID: 22567586 Free PMC article.
-
Optical coherence tomography retinal image reconstruction via nonlocal weighted sparse representation.J Biomed Opt. 2018 Mar;23(3):1-11. doi: 10.1117/1.JBO.23.3.036011. J Biomed Opt. 2018. PMID: 29575829
-
3-D Adaptive Sparsity Based Image Compression With Applications to Optical Coherence Tomography.IEEE Trans Med Imaging. 2015 Jun;34(6):1306-20. doi: 10.1109/TMI.2014.2387336. Epub 2015 Jan 1. IEEE Trans Med Imaging. 2015. PMID: 25561591 Free PMC article.
-
Optical coherence tomography of the retina and optic nerve - a review.Clin Exp Ophthalmol. 2009 Jan;37(1):90-9. doi: 10.1111/j.1442-9071.2009.02015.x. Clin Exp Ophthalmol. 2009. PMID: 19338607 Review.
-
Automatic Anisotropic Diffusion Filtering and Graph-search Segmentation of Macular Spectral-domain Optical Coherence Tomographic (SD-OCT) Images.Curr Med Imaging Rev. 2019;15(3):308-318. doi: 10.2174/1573405613666171201155119. Curr Med Imaging Rev. 2019. PMID: 31989882 Review.
Cited by
-
Automatic segmentation of up to ten layer boundaries in SD-OCT images of the mouse retina with and without missing layers due to pathology.Biomed Opt Express. 2014 Jan 7;5(2):348-65. doi: 10.1364/BOE.5.000348. eCollection 2014 Feb 1. Biomed Opt Express. 2014. PMID: 24575332 Free PMC article.
-
Self-supervised speckle noise reduction of optical coherence tomography without clean data.Biomed Opt Express. 2022 Nov 10;13(12):6357-6372. doi: 10.1364/BOE.471497. eCollection 2022 Dec 1. Biomed Opt Express. 2022. PMID: 36589594 Free PMC article.
-
Shared-hole graph search with adaptive constraints for 3D optic nerve head optical coherence tomography image segmentation.Biomed Opt Express. 2018 Feb 2;9(3):962-983. doi: 10.1364/BOE.9.000962. eCollection 2018 Mar 1. Biomed Opt Express. 2018. PMID: 29541497 Free PMC article.
-
Automated intraretinal segmentation of SD-OCT images in normal and age-related macular degeneration eyes.Biomed Opt Express. 2017 Feb 28;8(3):1926-1949. doi: 10.1364/BOE.8.001926. eCollection 2017 Mar 1. Biomed Opt Express. 2017. PMID: 28663874 Free PMC article.
-
High signal-to-noise ratio reconstruction of low bit-depth optical coherence tomography using deep learning.J Biomed Opt. 2020 Nov;25(12):123702. doi: 10.1117/1.JBO.25.12.123702. J Biomed Opt. 2020. PMID: 33191687 Free PMC article.
References
-
- Choma M, Sarunic M, Yang C, Izatt J. Sensitivity advantage of swept source and Fourier domain optical coherence tomography. Opt Exp. 2003;11(18):2183–2189. - PubMed
-
- Robinson MD, Chiu SJ, Toth CA, Izatt J, Lo JY, Farsiu S. Novel applications of super-resolution in medical imaging. In: Milanfar P, editor. Super-Resolution Imaging. Boca Raton, FL: CRC Press; 2010. pp. 383–412.
Publication types
MeSH terms
Grants and funding
LinkOut - more resources
Full Text Sources
Other Literature Sources
