. 2013 Jul 11;499(7457):166-71.
doi: 10.1038/nature12308.

Temporal regulation of EGF signalling networks by the scaffold protein Shc1

Affiliations

Temporal regulation of EGF signalling networks by the scaffold protein Shc1

Yong Zheng et al. Nature. .

Abstract

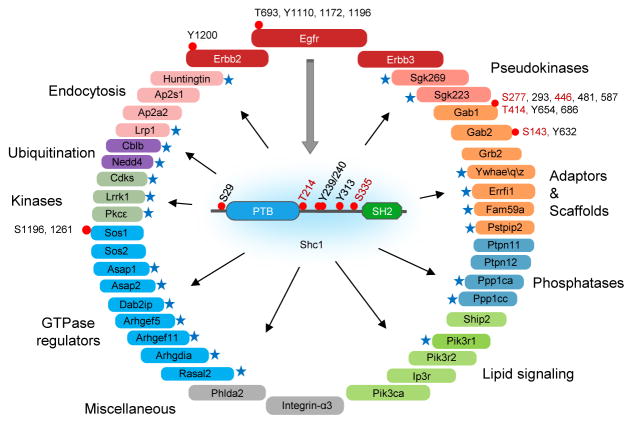
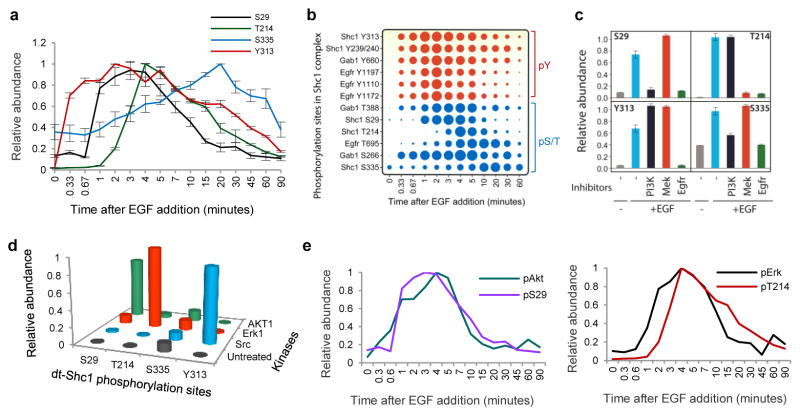
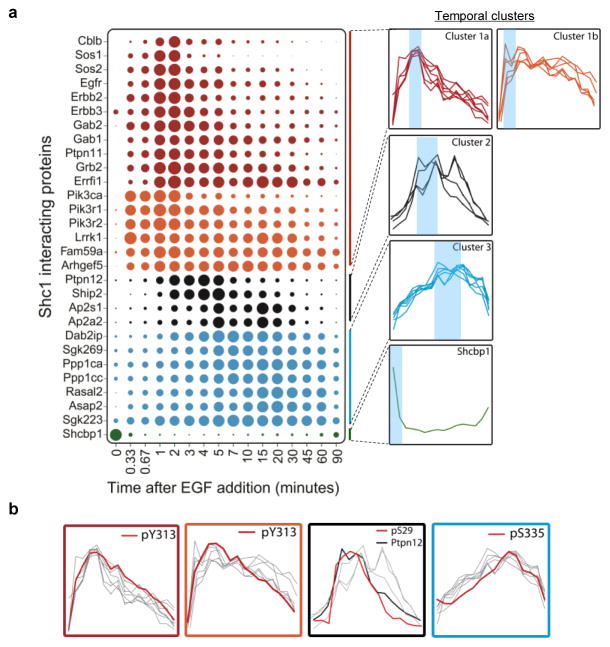
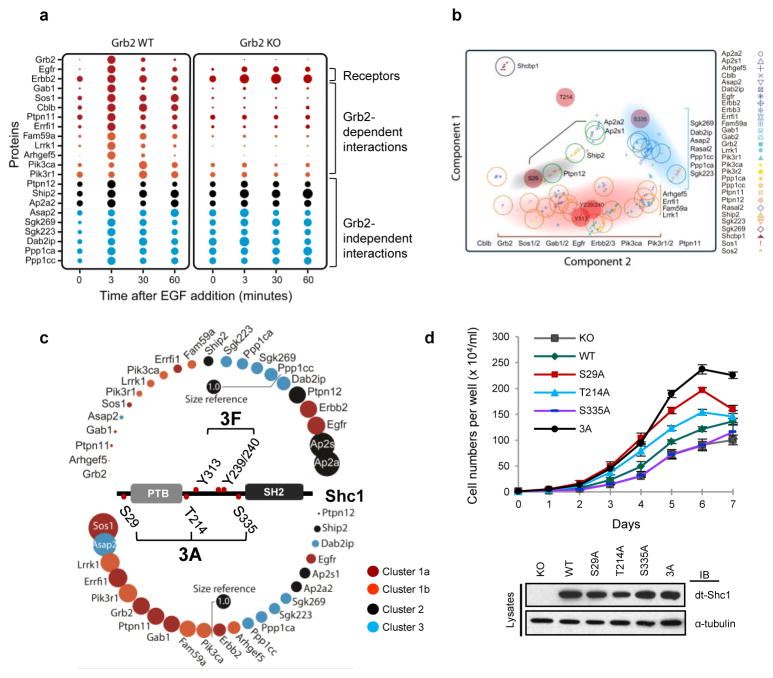
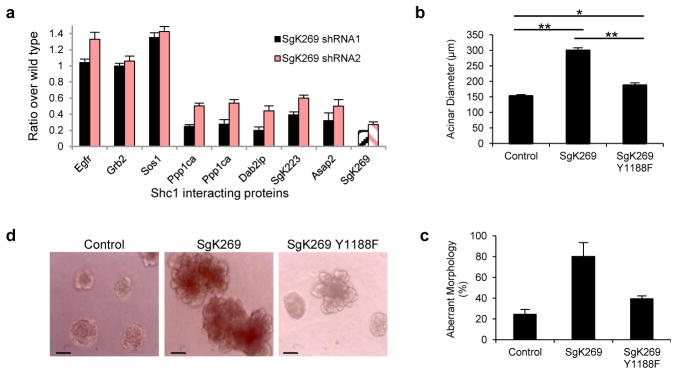
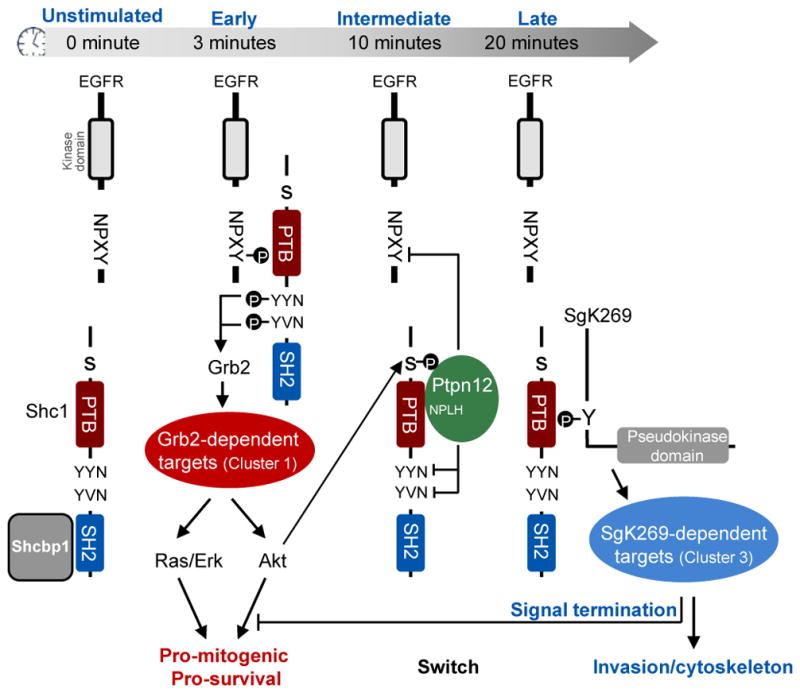
Cell-surface receptors frequently use scaffold proteins to recruit cytoplasmic targets, but the rationale for this is uncertain. Activated receptor tyrosine kinases, for example, engage scaffolds such as Shc1 that contain phosphotyrosine (pTyr)-binding (PTB) domains. Using quantitative mass spectrometry, here we show that mammalian Shc1 responds to epidermal growth factor (EGF) stimulation through multiple waves of distinct phosphorylation events and protein interactions. After stimulation, Shc1 rapidly binds a group of proteins that activate pro-mitogenic or survival pathways dependent on recruitment of the Grb2 adaptor to Shc1 pTyr sites. Akt-mediated feedback phosphorylation of Shc1 Ser 29 then recruits the Ptpn12 tyrosine phosphatase. This is followed by a sub-network of proteins involved in cytoskeletal reorganization, trafficking and signal termination that binds Shc1 with delayed kinetics, largely through the SgK269 pseudokinase/adaptor protein. Ptpn12 acts as a switch to convert Shc1 from pTyr/Grb2-based signalling to SgK269-mediated pathways that regulate cell invasion and morphogenesis. The Shc1 scaffold therefore directs the temporal flow of signalling information after EGF stimulation.


Conflict of interest statement

The authors declare competing financial interests: S.A.T. is an employee of AB SCIEX. AB SCIEX has provided support for the Ontario Research Fund grant (awarded to T.P.).

Figures

Figure 1
Figure 1. EGF-dependent Shc1 phosphorylation and interactome
EGF-dependent Shc1 phosphorylation and protein interaction network identified by LC/MS in discovery mode. Novel Shc1-interacting proteins are marked by blue stars. Phosphorylation sites are shown by a red dot, with novel sites highlighted in red. Proteins are coloured according to functional groups.
Figure 2
Figure 2. Dynamic phosphorylation of Shc1 and interacting proteins
a, Temporal profiles of individual Shc1 phosphorylation sites following EGF stimulation. dt-Shc1 was affinity purified from EGF-stimulated fibroblasts at various time points. Relative abundance of dt-Shc1 phosphopeptides was quantified by sMRM and plotted using a quasi logarithm time scale to expand the early phase of phosphorylation. b, Temporal profiles of all analyzed phosphorylation sites in the EGF-induced Shc1 complex. The size of each dot is proportional to the relative abundance of the corresponding phosphopeptide. c, Differential inhibition of Shc1 phosphorylation by kinase inhibitors as quantified by sMRM. d, In vitro kinase/sMRM analysis. Affinity purified dt-Shc1 was incubated with recombinant kinases in vitro. Phosphorylation of dt-Shc1 sites was quantified by sMRM. e, Activation kinetics of Akt and Erk1 were measured by quantitative immunoblotting, and overlaid with the phosphorylation kinetics of Shc1 S29 and T214 from panel a, respectively. Inhibitors used: EGFR: AG1478; PI3K: LY294002; Mek: PD98059. Results are representative of three independent experiments. Error bars are s. d. from all transitions for a given protein/peptide from all technical repeats.
Figure 3
Figure 3. Temporal profiles of the Shc1 signaling network
a, dt-Shc1 associated proteins were quantified as a function of time following EGF stimulation. The size of each dot is proportional to the relative abundance of the associated protein. Proteins were divided into three clusters based on the similarity of their association rates with dt-Shc1 and were colour-coded accordingly. Shcbp1 has a unique binding profile. At right: individual binding curves from each cluster were overlaid, with blue shading over the regions with maximal protein binding. b, Overlays of each temporal cluster with kinetic profiles of Shc1 phosphorylation sites (pY313 vs. Cluster1a and 1b; pS29 vs. Cluster 2; pS335 vs. Cluster 3).
Figure 4
Figure 4. Grb2-independent, serine/threonine-dependent Shc1 protein interactions
a, EGF-induced dt-Shc1 protein interactions were quantified by sMRM in Grb2flox/flox MEFs, with (WT) or without (KO) functional Grb2. Dots are coloured according to the temporal clusters defined in Fig. 3a. b, Correlations between Shc1 phosphorylation and protein binding revealed by PCA. The center of each open circle marks the mean PCA value for each protein. The open circles are coloured according to the protein’s cluster assignment. The red-filled circles are Shc1 phosphorylation sites. Shaded areas indicate co-modulations between specific Shc1 phosphorylation sites and binding clusters. c, Shc1 complex assembly in Shc1-deficient MEFs stably expressing WT dt-Shc1 compared to phosphosite mutants (3F: Y239/240/313F; 3A: S29/335/T214A) at 5 minutes post-EGF stimulation. The relative abundance of each protein from the WT dt-Shc1 complex was set at 1.0 (Size reference). Changes in protein-binding to Shc1 mutants are represented as the fold change over WT. d, Proliferation of Shc1-deficient MEFs expressing WT or mutant dt-Shc1 as quantified by cell counting. Lower panel: expression levels of dt-Shc1 variants. Error bars are +/− s.d. from three technical replicates. All results represent a minimum of three independent experiments.
Figure 5
Figure 5. SgK269 mediates late phase Shc1 protein interactions and regulates acinar morphology of breast epithelial cells in 3D culture
a, Cells stably infected with shRNAs for SgK269 or luciferase were stimulated with EGF. Association of Shc1 with Cluster 3 proteins and representative Cluster 1 proteins was quantified by sMRM. Error bars are +/− s. d. from all transitions for a given protein/peptide from all technical repeats. b–c, Effects of the SgK269 Y1188F mutation on acini size and morphology were analyzed 12 days after inoculation into Matrigel. The diameters of ~100 acini were measured (+/− s.e.m., ** p<0.0001, * p<0.001). Data in a–c are representative of two independent experiments. d, Representative images of acini.
Figure 6
Figure 6. Model for temporal regulation of Shc1 signaling following EGFR activation
The figure depicts the different phosphorylation events and protein interactions involving Shc1 as a funtion of time following EGF stimulation. See text for details.

Comment in

References

    1. Good MC, Zalatan JG, Lim WA. Scaffold proteins: hubs for controlling the flow of cellular information. Science. 2011;332:680–686. - PMC - PubMed
    1. Lemmon MA, Schlessinger J. Cell signaling by receptor tyrosine kinases. Cell. 2010;141:1117–1134. - PMC - PubMed
    1. Uhlik MT, et al. Structural and evolutionary division of phosphotyrosine binding (PTB) domains. J Mol Biol. 2005;345:1–20. - PubMed
    1. Luzi L, Confalonieri S, Di Fiore PP, Pelicci PG. Evolution of Shc functions from nematode to human. Curr Opin Genet Dev. 2000;10:668–674. - PubMed
    1. van der Geer P, Wiley S, Gish GD, Pawson T. The Shc adaptor protein is highly phosphorylated at conserved, twin tyrosine residues (Y239/240) that mediate protein-protein interactions. Curr Biol. 1996;6:1435–1444. - PubMed

Publication types

MeSH terms

Substances