. 2013 Aug 23;288(34):24351-62.
doi: 10.1074/jbc.M113.455725. Epub 2013 Jul 11.

Inhibition of protein kinase C signaling maintains rat embryonic stem cell pluripotency

Affiliations

Inhibition of protein kinase C signaling maintains rat embryonic stem cell pluripotency

Ganeshkumar Rajendran et al. J Biol Chem. .

Abstract

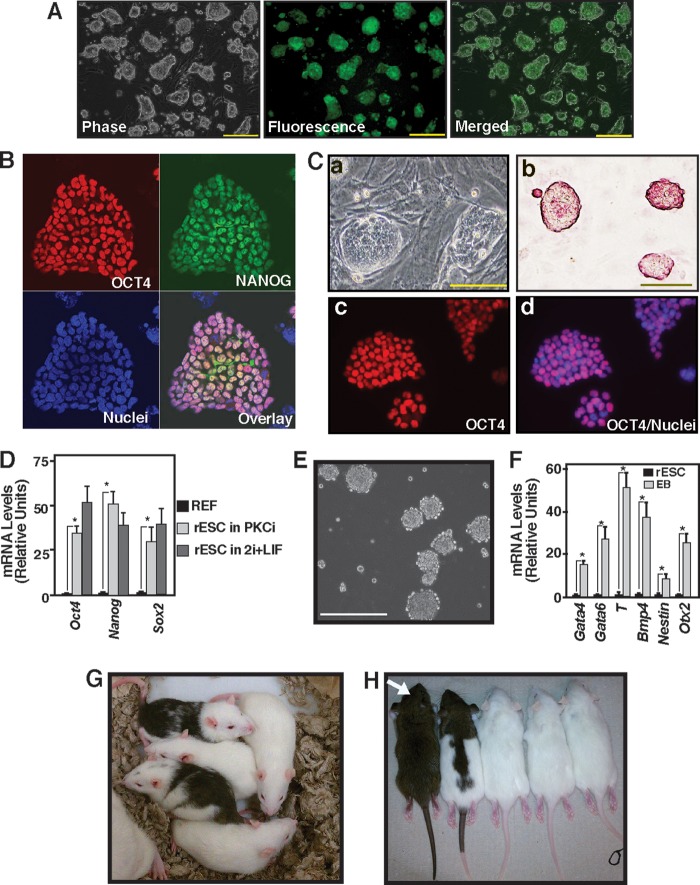
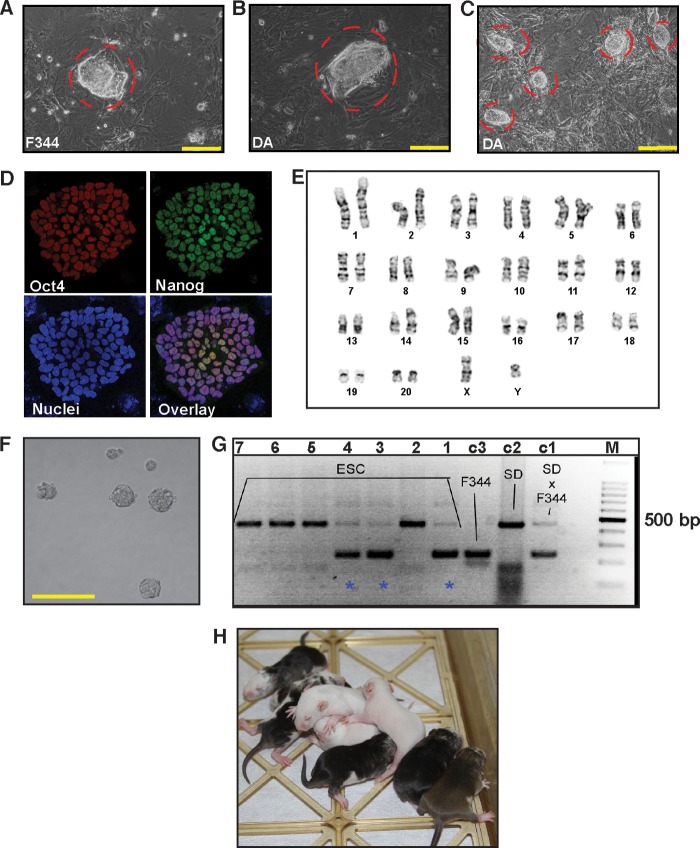
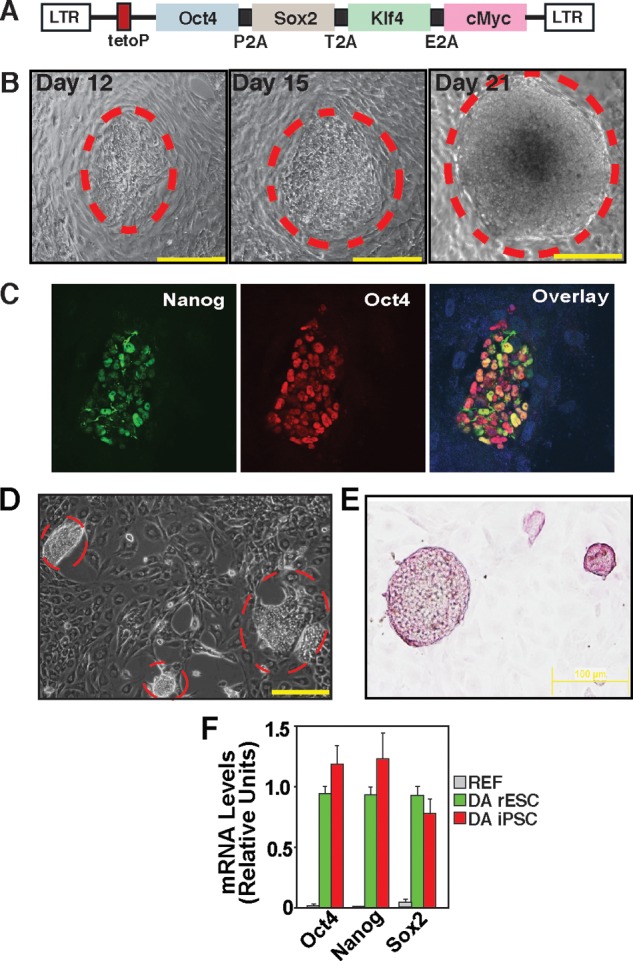
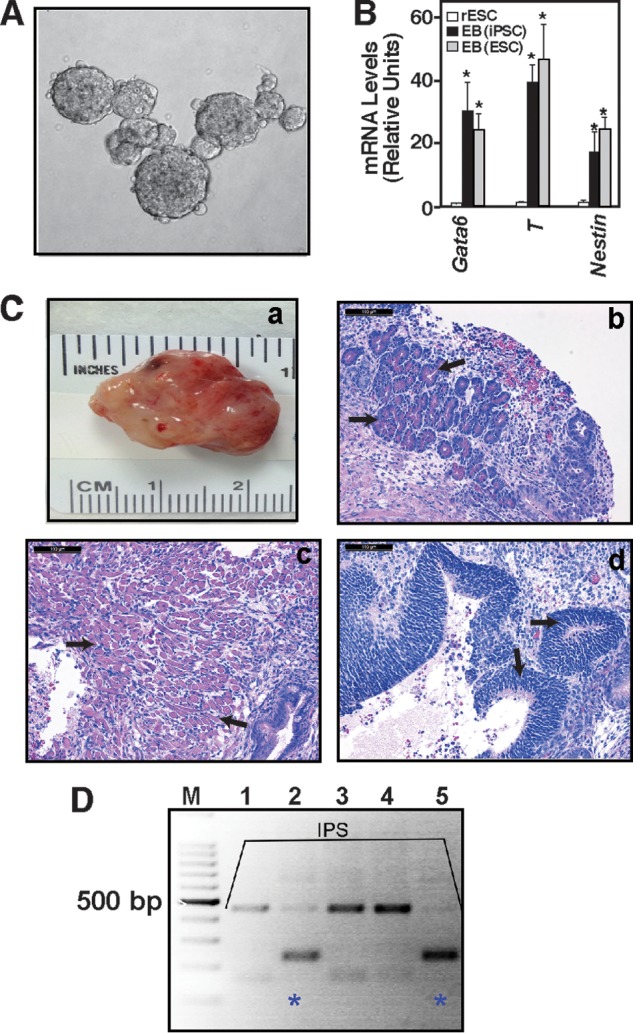
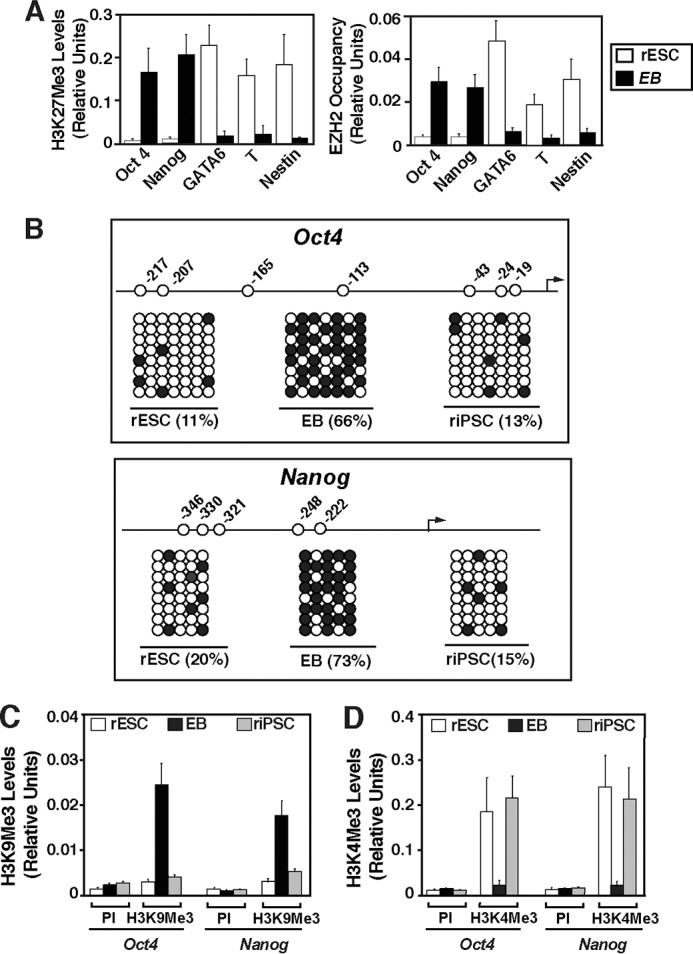
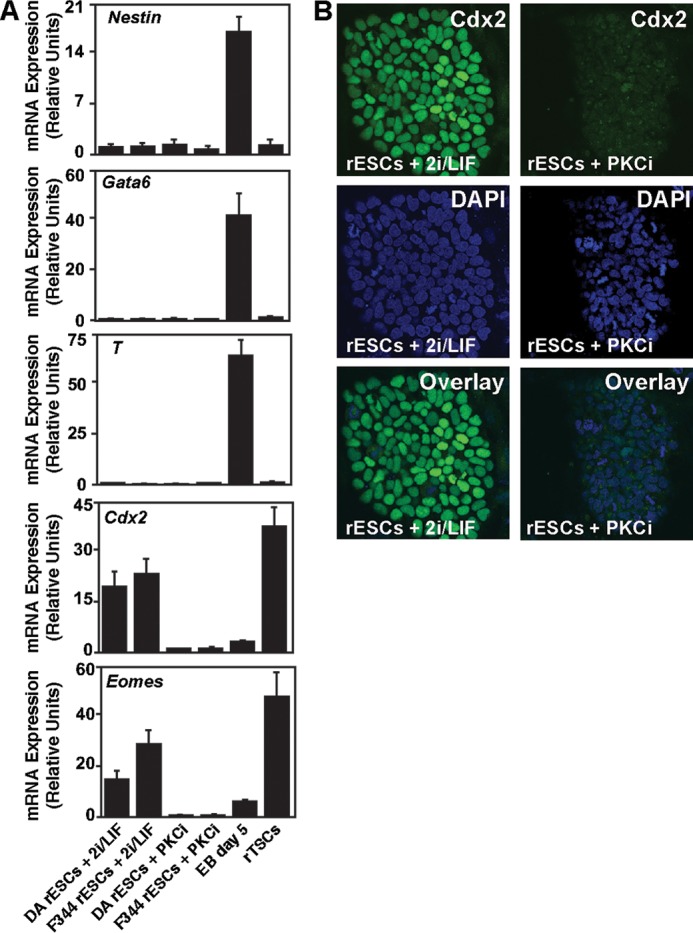
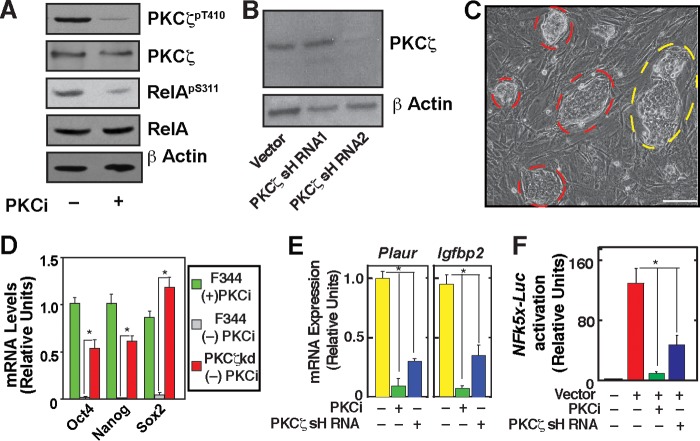
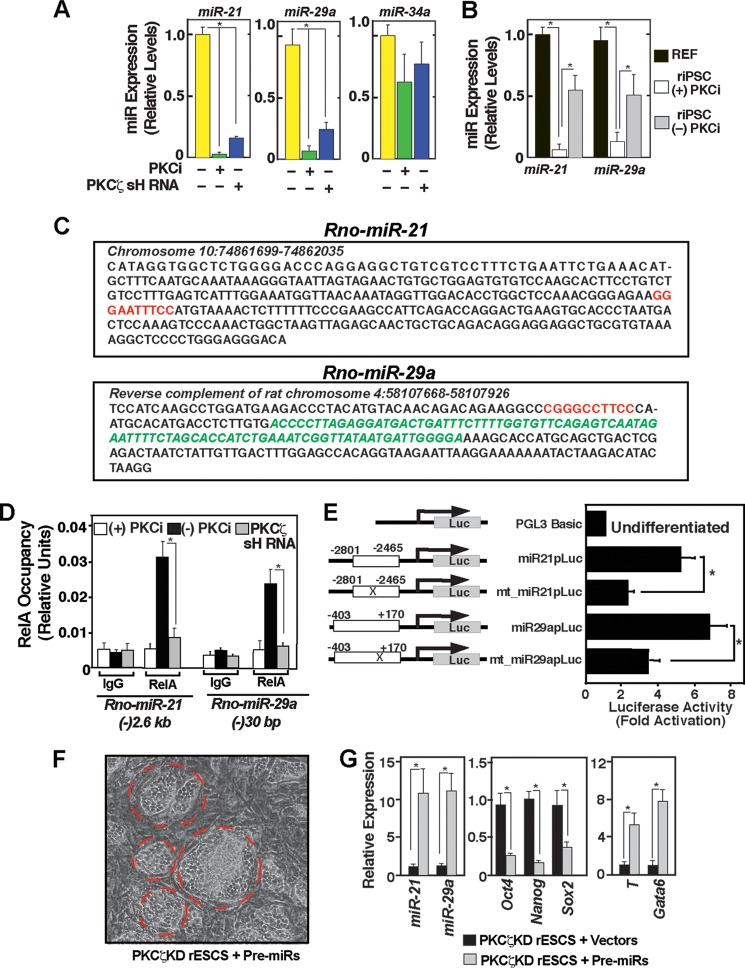
Embryonic stem cell (ESC) pluripotency is orchestrated by distinct signaling pathways that are often targeted to maintain ESC self-renewal or their differentiation to other lineages. We showed earlier that inhibition of PKC signaling maintains pluripotency in mouse ESCs. Therefore, in this study, we investigated the importance of protein kinase C signaling in the context of rat ESC (rESC) pluripotency. Here we show that inhibition of PKC signaling is an efficient strategy to establish and maintain pluripotent rESCs and to facilitate reprogramming of rat embryonic fibroblasts to rat induced pluripotent stem cells. The complete developmental potential of rESCs was confirmed with viable chimeras and germ line transmission. Our molecular analyses indicated that inhibition of a PKCζ-NF-κB-microRNA-21/microRNA-29 regulatory axis contributes to the maintenance of rESC self-renewal. In addition, PKC inhibition maintains ESC-specific epigenetic modifications at the chromatin domains of pluripotency genes and, thereby, maintains their expression. Our results indicate a conserved function of PKC signaling in balancing self-renewal versus differentiation of both mouse and rat ESCs and indicate that targeting PKC signaling might be an efficient strategy to establish ESCs from other mammalian species.

Keywords: Chromatin Modification; Embryonic Stem Cell; NF-κB; PKC; Rat.


Figures

FIGURE 1.
FIGURE 1.
Inhibition of PKC signaling supports rESC self-renewal. A, micrographs of an OCT4-EGFP reporter expressing F344 rESCs showing undifferentiated colony morphology and reporter GFP expression after they were cultured for five consecutive passages with PKCi. Scale bars = 250 μm. B, immunofluorescence images show OCT4 and NANOG expression in F344 rESCs that were maintained with PKCi for seven consecutive passages. C, micrographs showing undifferentiated colony morphology (a), presence of alkaline phosphatase (b), and OCT4 expression in the nuclei (c and d) in DA rESCs after culturing for seven consecutive passages with PKCi. Scale bars = 100 μm. D, plot showing relative mRNA expression of the pluripotency genes Oct4, Nanog, and Sox2 in DA rESCs after they were maintained for seven passages in PKCi and 2i/LIF culture conditions. DA REFs were used as negative controls. Gene expressions were measured by qRT-PCR analyses (mean ± S.E., three independent experiments). *, p ≤ 0.05. E, micrograph showing day 5 EBs that were formed from DA rESCs after PKCi withdrawal. Scale bar = 250 μm. F, differentiation potency in PKCi-maintained DA rESCs was determined by measuring mRNA expression (mean ± S.E., three independent experiments) in day 5 EBs. Undifferentiated DA rESCs were used as a control. The plot shows significant (p ≤ 0.01) induction in lineage-specific markers (Gata4 and Gata6 for endoderm, Bmp4 and T for mesoderm, and Nestin and Otx2 for ectoderm) after a 5-day absence of PKCi and EB formation. G, chimeric rats generated with DA rESCs that were cultured with PKCi. H, germ line offspring (white arrow) from the DA chimeras shown in G.
FIGURE 2.
FIGURE 2.
PKC inhibition facilitates de novo derivation of rESCs. A, passage 1 ESC colony (red border) derived from F344 rat blastocyst with PKCi. Scale bar = 250 μm. B, passage 1 ESC colony derived from DA rat blastocyst with PKCi and the MEK inhibitor PD0325901. Scale bar = 250 μm. C, newly derived DA rESCs of B were cultured for five consecutive passages with PKCi alone. The image shows that newly derived DA rESCs maintain undifferentiated ESC colony morphology in the PKCi-alone culture condition. Scale bar = 250 μm. D, confocal images showing expression of OCT4 and NANOG in passage 6, PKCi-maintained, newly derived DA rESCs. E, karyotype analysis in F344 rESCs that were derived and maintained for five passages with PKCi. F, micrograph showing EBs (day 5) developed from newly derived, PKCi-maintained (passage 6) DA rESCs after PKCi withdrawal. Scale bar = 250 μm. G, analyses of chimera generation with PKCi-derived and maintained (passage five) F344 rESCs. The F344 ESCs were injected into SD blastocysts, genomic DNA was isolated from pups that were born from ESC-injected blastocysts (lanes 1–7), and chimera generation was confirmed (pups. 1, 3, and 4, blue stars) by analyzing rat microsatellite D17rat165 via PCR and gel electrophoresis. Lanes c1, c2, and c3 show microsatellite analyses with DNAs isolated from known control rat strains (F344 and SD cross, SD, and F344 strains, respectively). Lane M indicates the DNA ladder. H, chimeric rats generated with PKCi and MEK inhibitor-derived DA ESCs after maintaining in PKCi for six passages.
FIGURE 3.
FIGURE 3.
Reprogramming of differentiated rat cells to riPSCs in the PKCi culture condition. A, schematic of the Dox-inducible, OSKM-expressing, lentiviral vector (11). LTR, long terminal repeat. B, micrographs showing an F344 riPSC colony in the PKCi culture condition at days 12, 15, and 21. Scale bars = 250 μm. C, confocal images showing expression of endogenous OCT4 and NANOG in a F344 REF-derived nascent (day 13) iPSC colony in the PKCi culture condition. D, micrograph showing riPSC colonies derived from DA REFs in the PKCi culture condition (day 21). Scale bar = 250 μm. E, micrograph showing alkaline phosphatase activity in PKCi-derived and maintained (passage 5) DA iPSC colonies. F, plot showing relative mRNA expression of pluripotency genes in newly derived DA rESCs and DA riPSCs after they were cultured for six passages with PKCi. DA REFs were used as negative control cells.
FIGURE 4.
FIGURE 4.
PKCi culture-derived riPSCs maintain in vivo developmental potency. A, micrograph showing EBs (day 5) developed from newly derived, PKCi-maintained (passage 6) DA riPSCs after PKCi withdrawal. B, expression of differentiation markers was analyzed in day 5 EBs generated from newly derived DA rESCs and DA riPSCs (qRT-PCR analyses, mean ± S.E., three independent experiments). The plot shows significant (*, p ≤ 0.01) induction of lineage-specific markers in EBs from both rESCs and riPSCs compared with undifferentiated DA rESCs. C, the in vivo developmental potency of DA riPSCs that were maintained for six passages in PKCi was assessed via teratoma formation analyses. The micrographs show isolated teratomas (a) with pancreatic tissue (endoderm, black arrows, b), muscle (mesoderm, black arrows, c), and neuronal rosette (ectoderm, black arrows, d) characterized by H&E staining. D, the in vivo developmental potency of F344 rIPSCs was assessed via chimera generation. F344 rIPSCs were injected into SD blastocysts, genomic DNA was isolated from pups that were born from transferred blastocysts (lanes 1–5), and chimera generation was confirmed (pups 2 and 5, blue stars) by analyzing rat microsatellite D17rat165 via PCR.
FIGURE 5.
FIGURE 5.
PKC inhibition maintains ES cell-specific epigenetic modifications at the pluripotency genes. A, quantitative ChIP analysis (mean ± S. E., three independent experiments) showing low levels of H3K27Me3 (left panel) and EZH2 (right panel) at the promoter regions of the Oct4 and Nanog genes in F344 rESCs derived and cultured with PKCi. The plots also show that the promoter regions of lineage-specific genes have high levels of H3K27Me3 and EZH2 in undifferentiated rESCs. These patterns reversed in EBs after 6 days of PKCi removal. B, plots showing the position of CpG sites in the rat Oct4 (top panel) and Nanog (bottom panel) promoter and the extent of DNA methylation (●) at the promoter regions of the Oct4 and Nanog loci. F344 rESCs and riPSCs derived and cultured with PKCi and day-6 EBs derived from F344 rESCs were analyzed. Black arrows, transcription start sites. C, and D, quantitative ChIP analyses (mean ± S.E., three independent experiments) showing lack of H3K9Me3 but enrichment of H3K4Me3, respectively, at the Oct4 and Nanog promoters in PKCi-treated F344 rESCs and riPSCs analyzed in B. Preimmune serum (PI) was used as a negative control for ChIP analyses.
FIGURE 6.
FIGURE 6.
The PKCi culture condition represses TSC-specific gene expression in rESCs. A, qRT-PCR analysis (means ± S. E., three independent experiments) showing high-level expressions of the TSC-specific genes Cdx2 and Eomes in 2i/LIF-cultured rESCs. However, the PKCi culture condition strongly represses their expression. B, confocal images show high levels of CDX2 protein expression in 2i/LIF-cultured F344 rESCs but not in PKCi-cultured F344 rESCs.
FIGURE 7.
FIGURE 7.
Maintenance of self-renewal in PKCζ-depleted rESCs. A, Western blot analyses showing the inhibition of phosphorylation of PKCζ at threonine (T) 410 and RelA at serine (S) 311) in PKCi-cultured F344 rESCs. B, Western blot analyses showing knockdown of PKCζ in F344 rESC with shRNA molecules targeted against the 3′ UTR region of PKCζ mRNA. shRNA2 but not shRNA1 showed strong RNAi. C, micrograph showing PKCζkd F344 rESC cells that were cultured in the absence of PKCi for four consecutive passages (20 days). The red borders indicate undifferentiated rESC colonies. The yellow border indicates a colony in which individual cells are visible, an indication of differentiation. Scale bar = 250 μm. D, relative mRNA expression of pluripotency genes was analyzed (mean ± S.E., three independent experiments). The plot shows significantly high (p ≤ 0.01) expression of pluripotency genes in PKCζkd F344 rESCs (passage 4) compared with expression levels in control F344 rESCs (passage 1) when cultured without PKCi. F344 rESCs, maintained in PKCi for four passages, were used as control cells. E, qRT-PCR analysis (mean ± S.E., three independent experiments) of NF-κB target gene (Plaur and Igfpb2) expression in F344 rESCs. F344 rESCs were cultured with PKCi for four passages and without PKCi for 5 days, and gene expression was compared with PKCζkd F344 rESCs cultured without PKCi for three passages. F, analysis (mean ± S.E., three independent experiments) of NFk5x-Luc reporter activation in cells analyzed in E. *, p ≤ 0.05.
FIGURE 8.
FIGURE 8.
Downstream to PKCζ, a NF-κB-miR-21/miR-29a regulatory axis contributes to rESC differentiation. A, plot showing qRT-PCR analyses of miRNA expression in F344 rESCs with or without PKCi treatment and PKCζ depletion (mean ± S.E., three independent experiments). Cells were cultured for 5 days before expression analysis. *, p ≤ 0.05. B, plot showing miR-21 and miR-29a expressions in F344 REFs and iPSCs (derived and cultured with PKCi). C, nucleotide sequences of rat miR-21 (Rno-miR-21) and miR-29a (Rno-miR-29a) genes showing conserved putative NF-κB binding motifs (red letters). Green letters indicate the pre-miR sequences. D, quantitative ChIP analyses showing RelA occupancy at the rat miR-21 and miR-29a loci in control F344 rESCs when cultured without PKCi. However, the RelA occupancy is lost in the PKCi culture condition or in PKCζ-depleted rESCs. E, F344 rESCs were transiently transfected with plasmids in which the miR-21 and miR-29a promoter regions (miR-21p and miR-29ap) were fused in front of a luciferase (Luc) reporter gene. In mutated (mt_miR-21p and mt_miR-29ap) constructs, conserved NF-κB motifs (mentioned in C) were deleted. All cells were cultured without PKCi. The plot depicts relative luciferase activity in the cell lysates normalized by the protein concentration of the lysates (mean ± S.E., three independent experiments). F, micrograph showing passage 2 PKCζkd F344 rESC colonies (red border) after 4 days of transduction with pre-miR-21- and pre-miR-29a-expressing lentiviral vectors. The image shows that the rESC colonies lost the undifferentiated ESC-like morphology. G, PKCζkd F344 rESCs were transduced either with pre-miR-21- or pre-miR-29a-expressing lentiviral vectors or empty vectors, total RNAs were isolated after 5 days, and qRT-PCR analyses were performed to compare expressions of miRNAs, pluripotency genes (Oct4, Nanog, Sox2), and lineage-specific genes (T, Gata6).

Similar articles

Cited by

References

    1. Jacob H. J., Kwitek A. E. (2002) Rat genetics. Attaching physiology and pharmacology to the genome. Nat. Rev. Genet. 3, 33–42 - PubMed
    1. Li P., Tong C., Mehrian-Shai R., Jia L., Wu N., Yan Y., Maxson R. E., Schulze E. N., Song H., Hsieh C. L., Pera M. F., Ying Q. L. (2008) Germline competent embryonic stem cells derived from rat blastocysts. Cell 135, 1299–1310 - PMC - PubMed
    1. Buehr M., Meek S., Blair K., Yang J., Ure J., Silva J., McLay R., Hall J., Ying Q. L., Smith A. (2008) Capture of authentic embryonic stem cells from rat blastocysts. Cell 135, 1287–1298 - PubMed
    1. Hong J., He H., Weiss M. L. (2012) Derivation and characterization of embryonic stem cells lines derived from transgenic Fischer 344 and Dark Agouti rats. Stem Cells Dev. 21, 1571–1586 - PMC - PubMed
    1. Tong C., Li P., Wu N. L., Yan Y., Ying Q. L. (2010) Production of p53 gene knockout rats by homologous recombination in embryonic stem cells. Nature 467, 211–213 - PMC - PubMed

Publication types

MeSH terms