

Engineering the pattern of protein glycosylation modulates the thermostability of a GH11 xylanase
- PMID: 23846692
- PMCID: PMC3757213
- DOI: 10.1074/jbc.M113.485953
Engineering the pattern of protein glycosylation modulates the thermostability of a GH11 xylanase
Abstract
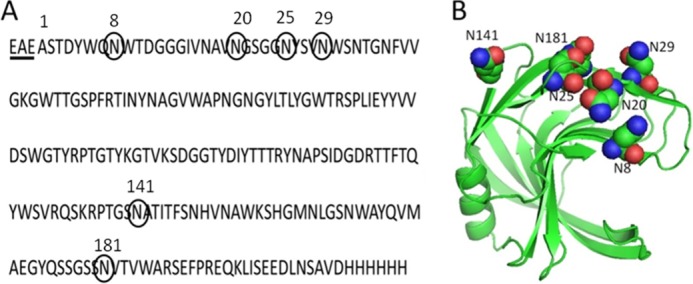
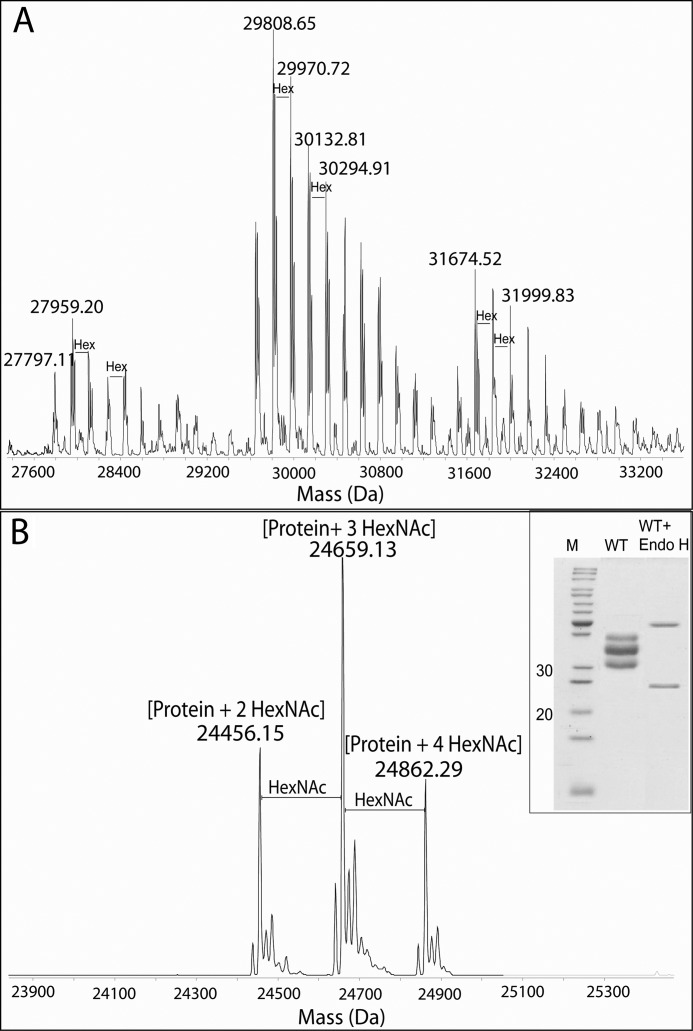
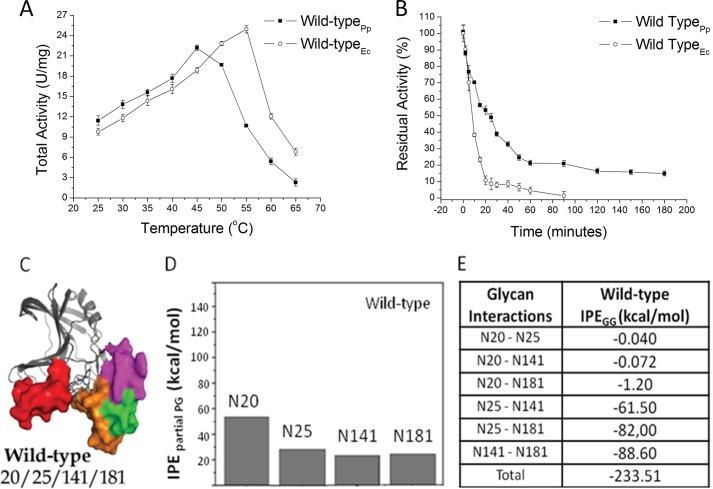
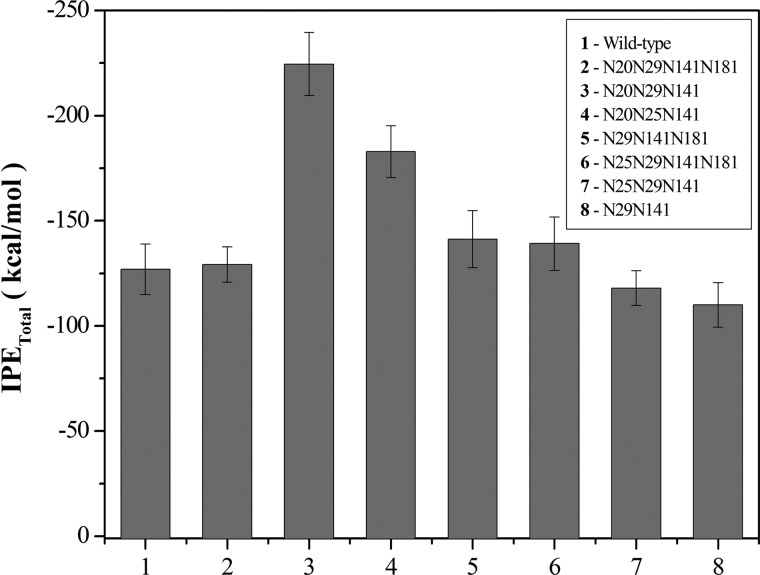
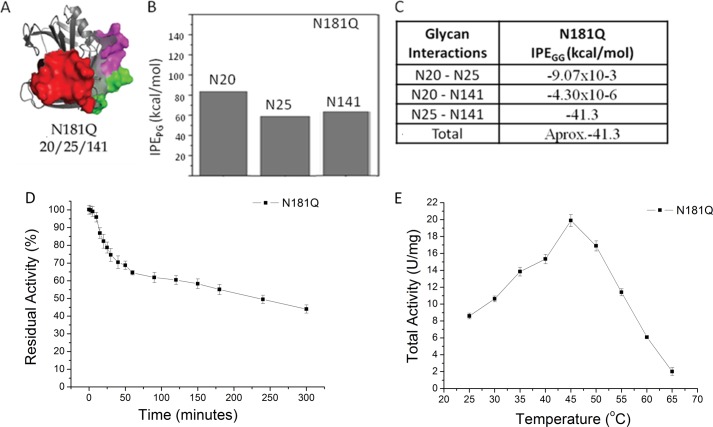
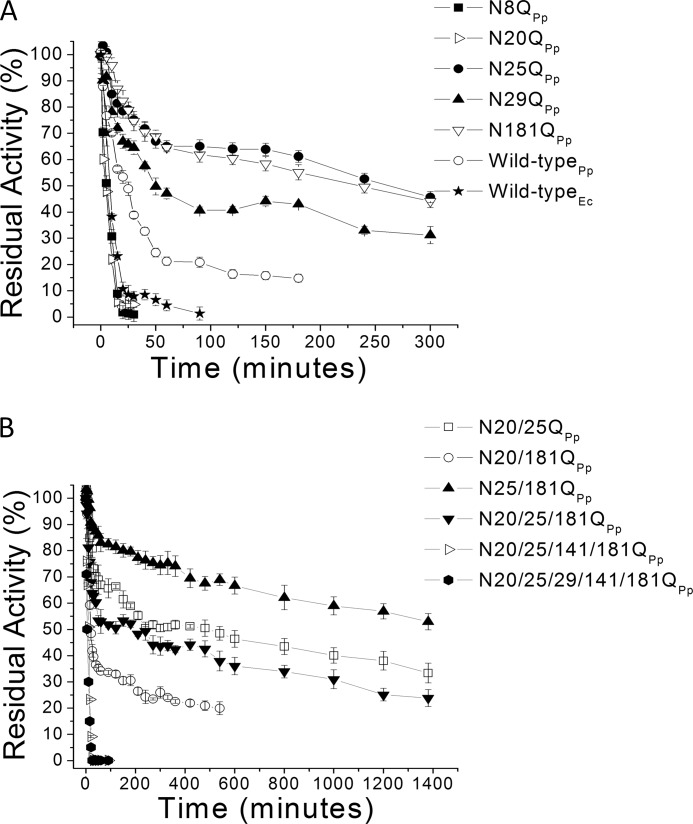
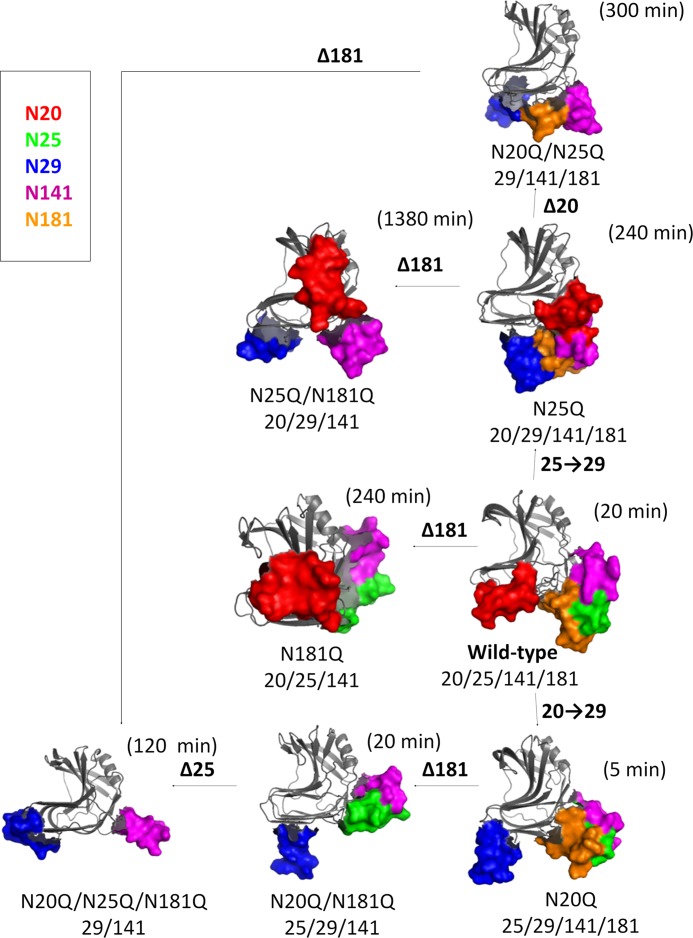
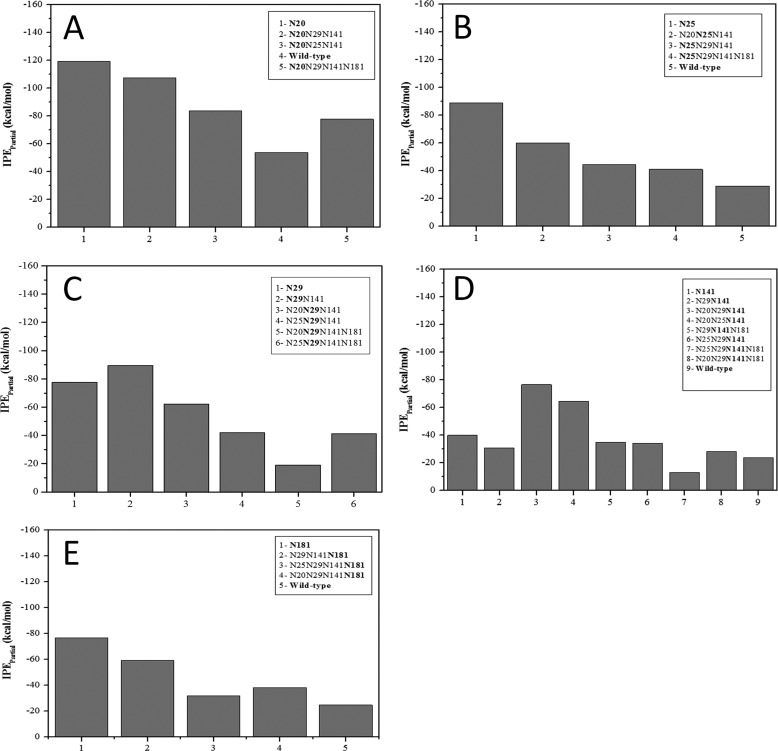
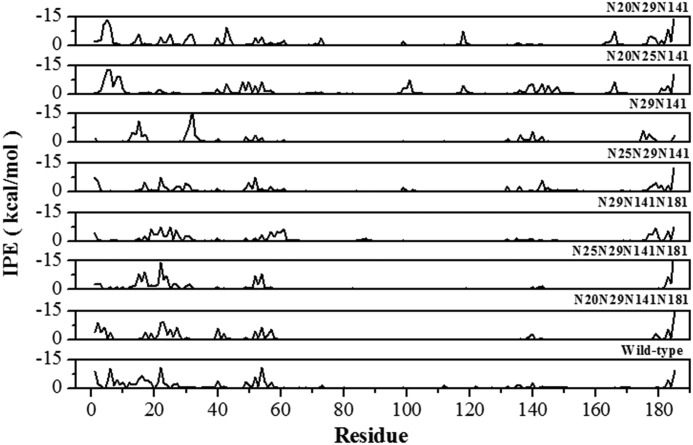
Protein glycosylation is a common post-translational modification, the effect of which on protein conformational and stability is incompletely understood. Here we have investigated the effects of glycosylation on the thermostability of Bacillus subtilis xylanase A (XynA) expressed in Pichia pastoris. Intact mass analysis of the heterologous wild-type XynA revealed two, three, or four Hex(8-16)GlcNAc2 modifications involving asparagine residues at positions 20, 25, 141, and 181. Molecular dynamics (MD) simulations of the XynA modified with various combinations of branched Hex9GlcNAc2 at these positions indicated a significant contribution from protein-glycan interactions to the overall energy of the glycoproteins. The effect of glycan content and glycosylation position on protein stability was evaluated by combinatorial mutagenesis of all six potential N-glycosylation sites. The majority of glycosylated enzymes expressed in P. pastoris presented increased thermostability in comparison with their unglycosylated counterparts expressed in Escherichia coli. Steric effects of multiple glycosylation events were apparent, and glycosylation position rather than the number of glycosylation events determined increases in thermostability. The MD simulations also indicated that clustered glycan chains tended to favor less stabilizing glycan-glycan interactions, whereas more dispersed glycosylation patterns favored stabilizing protein-glycan interactions.
Keywords: Glycoside Hydrolases; Glycosylation; Mass Spectrometry (MS); Molecular Dynamics Simulation; Protein Design; Protein Engineering; Protein Thermostability.
Figures
Similar articles
-
Computational design-based molecular engineering of the glycosyl hydrolase family 11 B. subtilis XynA endoxylanase improves its acid stability.Protein Eng Des Sel. 2009 Oct;22(10):587-96. doi: 10.1093/protein/gzp024. Epub 2009 Jun 16. Protein Eng Des Sel. 2009. PMID: 19531602
-
Improving the catalytic performance of a GH11 xylanase by rational protein engineering.Appl Microbiol Biotechnol. 2015 Nov;99(22):9503-10. doi: 10.1007/s00253-015-6712-0. Epub 2015 Jun 19. Appl Microbiol Biotechnol. 2015. PMID: 26088174
-
Effects of helix and fingertip mutations on the thermostability of xyn11A investigated by molecular dynamics simulations and enzyme activity assays.J Biomol Struct Dyn. 2018 Nov;36(15):3978-3992. doi: 10.1080/07391102.2017.1404934. Epub 2017 Dec 4. J Biomol Struct Dyn. 2018. PMID: 29129140
-
Heterologous expression in Pichia pastoris and characterization of a novel GH11 xylanase from saline-alkali soil with excellent tolerance to high pH, high salt concentrations and ethanol.Protein Expr Purif. 2017 Nov;139:71-77. doi: 10.1016/j.pep.2017.06.003. Epub 2017 Jun 7. Protein Expr Purif. 2017. PMID: 28602686 Review.
-
Thermostable microbial xylanases for pulp and paper industries: trends, applications and further perspectives.World J Microbiol Biotechnol. 2016 Feb;32(2):34. doi: 10.1007/s11274-015-2005-0. Epub 2016 Jan 11. World J Microbiol Biotechnol. 2016. PMID: 26754672 Review.
Cited by
-
Activity and Thermostability of GH5 Endoglucanase Chimeras from Mesophilic and Thermophilic Parents.Appl Environ Microbiol. 2019 Feb 20;85(5):e02079-18. doi: 10.1128/AEM.02079-18. Print 2019 Mar 1. Appl Environ Microbiol. 2019. PMID: 30552196 Free PMC article.
-
Multiscale Simulations of Biological Membranes: The Challenge To Understand Biological Phenomena in a Living Substance.Chem Rev. 2019 May 8;119(9):5607-5774. doi: 10.1021/acs.chemrev.8b00538. Epub 2019 Mar 12. Chem Rev. 2019. PMID: 30859819 Free PMC article.
-
Recombinant Proteins for Assembling as Nano- and Micro-Scale Materials for Drug Delivery: A Host Comparative Overview.Pharmaceutics. 2023 Apr 9;15(4):1197. doi: 10.3390/pharmaceutics15041197. Pharmaceutics. 2023. PMID: 37111682 Free PMC article.
-
Inhibitory effect of lignin on the hydrolysis of xylan by thermophilic and thermolabile GH11 xylanases.Biotechnol Biofuels Bioprod. 2022 May 14;15(1):49. doi: 10.1186/s13068-022-02148-4. Biotechnol Biofuels Bioprod. 2022. PMID: 35568899 Free PMC article.
-
An Overview of Antennal Esterases in Lepidoptera.Front Physiol. 2021 Mar 31;12:643281. doi: 10.3389/fphys.2021.643281. eCollection 2021. Front Physiol. 2021. PMID: 33868009 Free PMC article. Review.
References
-
- Rothman J. E., Lodish H. F. (1977) Synchronised transmembrane insertion and glycosylation of a nascent membrane protein. Nature 269, 775–780 - PubMed
-
- Apweiler R., Hermjakob H., Sharon N. (1999) On the frequency of protein glycosylation, as deduced from analysis of the SWISS-PROT database. Biochim. Biophys. Acta 1473, 4–8 - PubMed
-
- Burda P., Aebi M. (1999) The dolichol pathway of N-linked glycosylation. Biochim. Biophys. Acta 1426, 239–257 - PubMed
-
- Taylor M. E., Drickamer K. (2011) Introduction to Glycobiology, Oxford University Press, United Kingdom
-
- Ohtsubo K., Marth J. D. (2006) Glycosylation in cellular mechanisms of health and disease. Cell 126, 855–867 - PubMed
Publication types
MeSH terms
Substances
LinkOut - more resources
Full Text Sources
Other Literature Sources
Molecular Biology Databases
