. 2013 Aug 16;288(33):23884-92.
doi: 10.1074/jbc.M113.470674. Epub 2013 Jul 11.

Copper import into the mitochondrial matrix in Saccharomyces cerevisiae is mediated by Pic2, a mitochondrial carrier family protein

Affiliations

Copper import into the mitochondrial matrix in Saccharomyces cerevisiae is mediated by Pic2, a mitochondrial carrier family protein

Katherine E Vest et al. J Biol Chem. .

Abstract

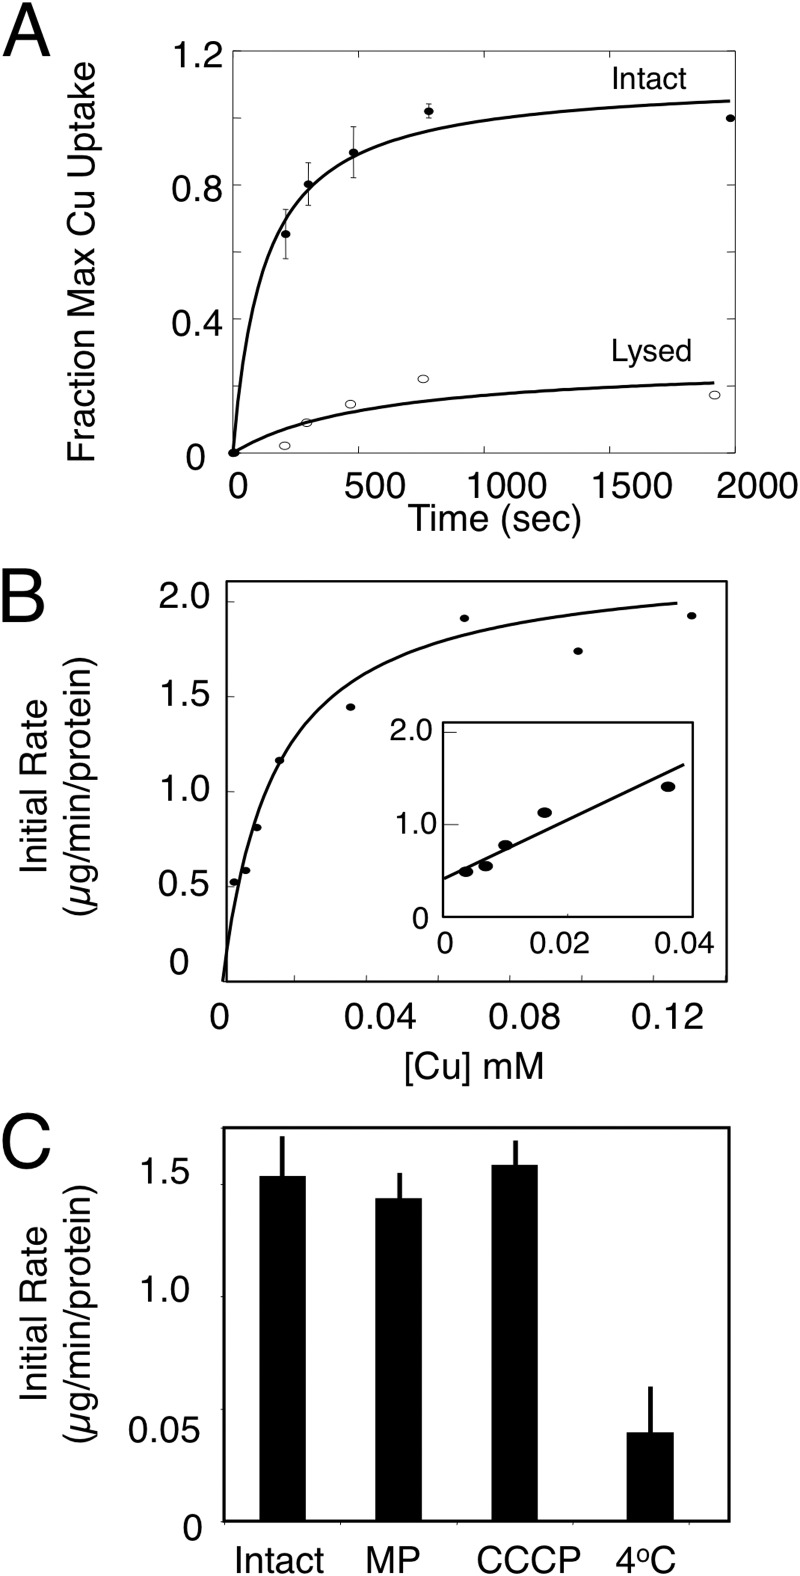
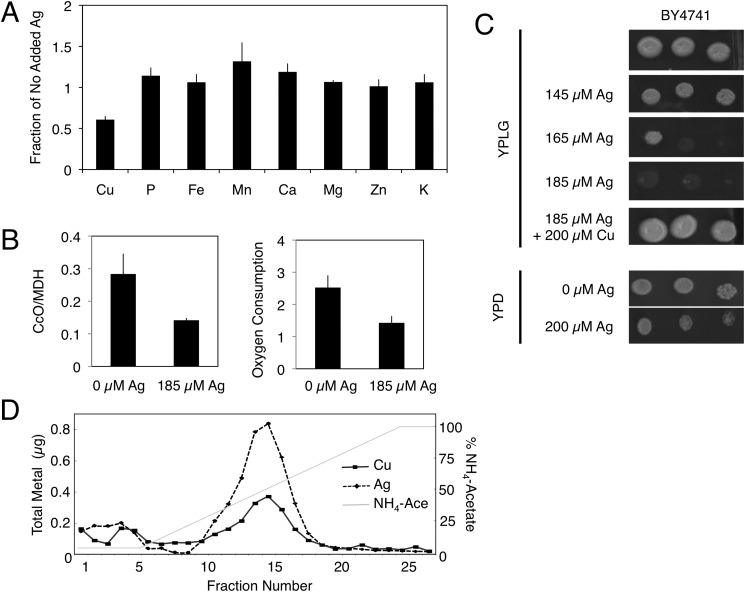
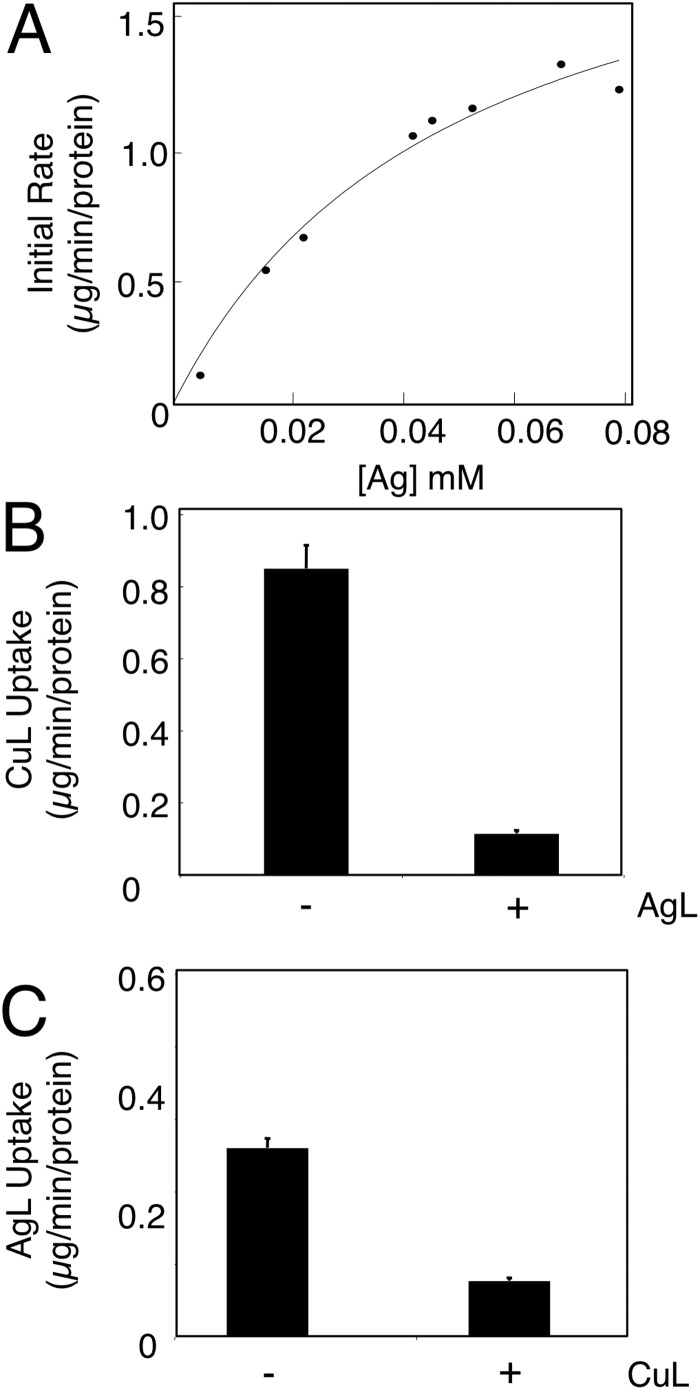
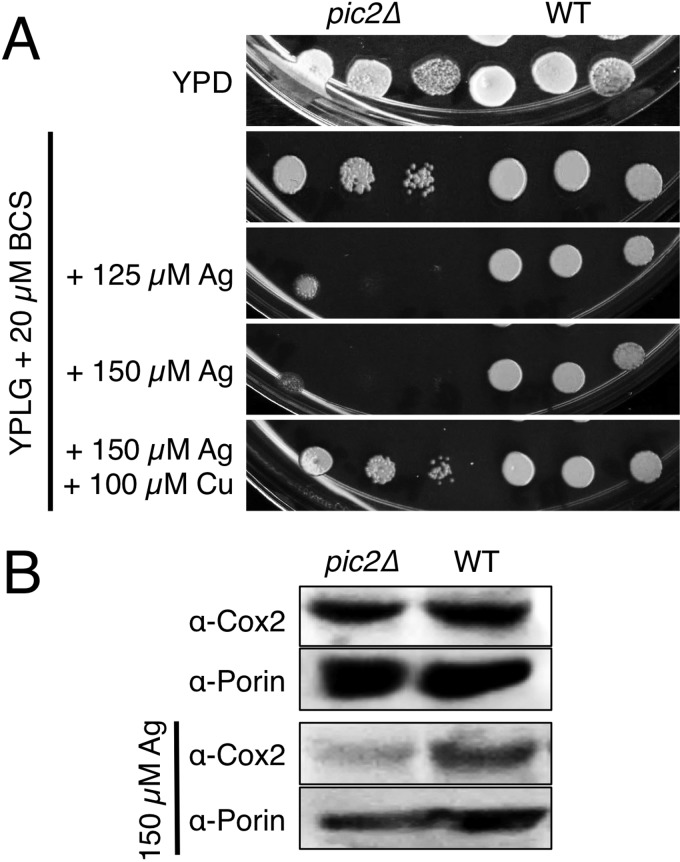
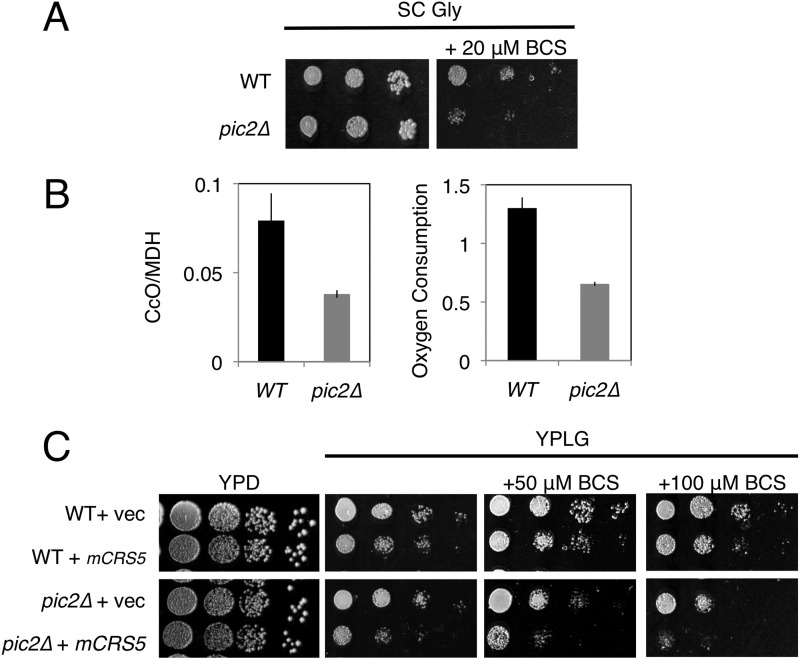
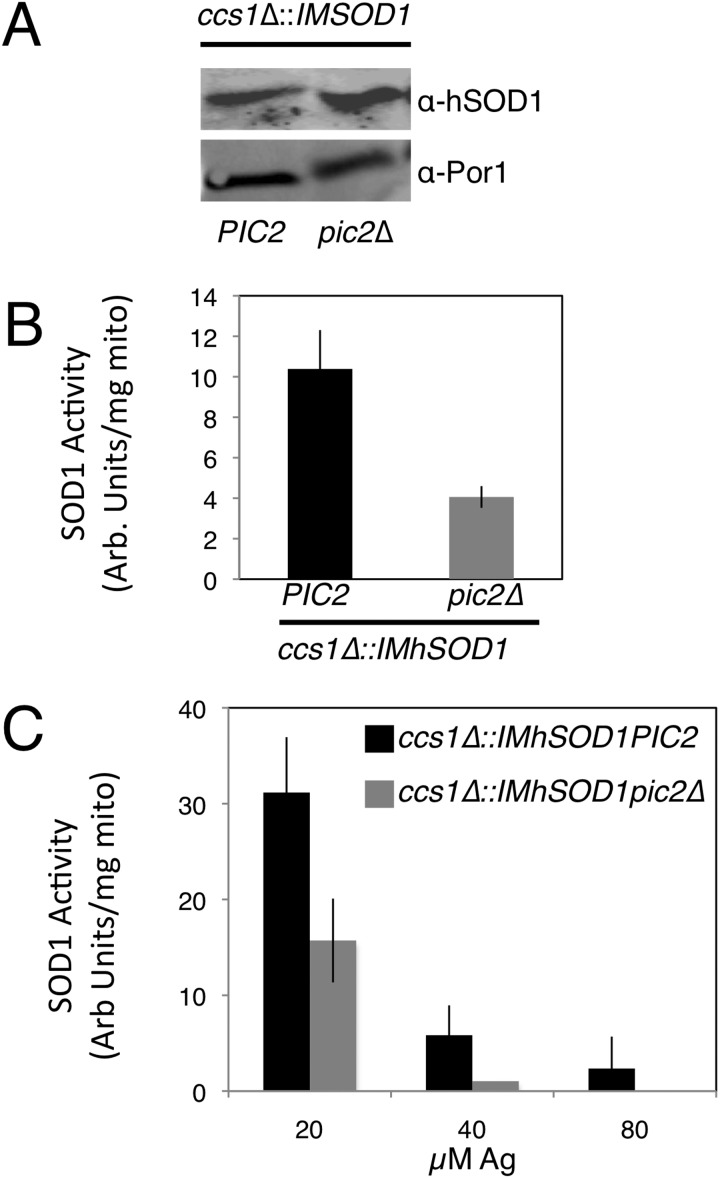
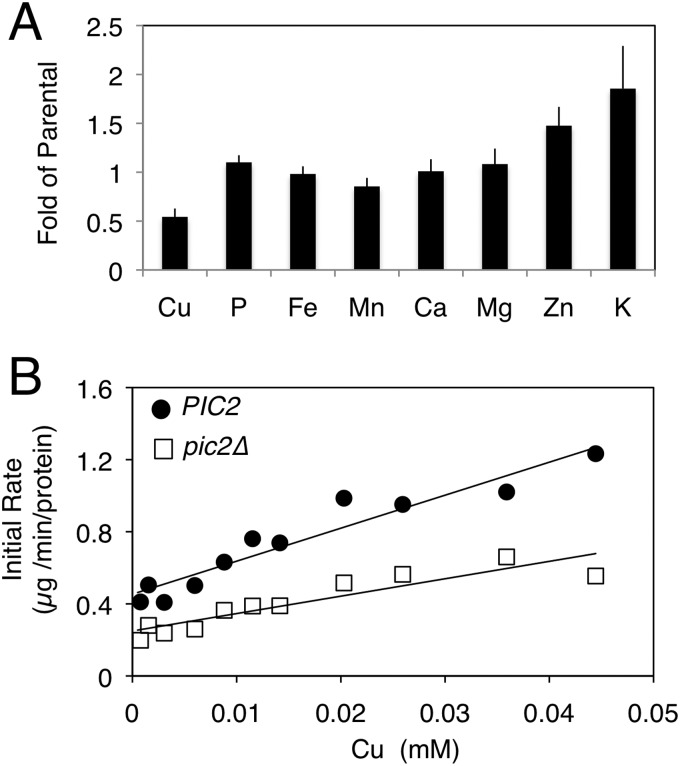
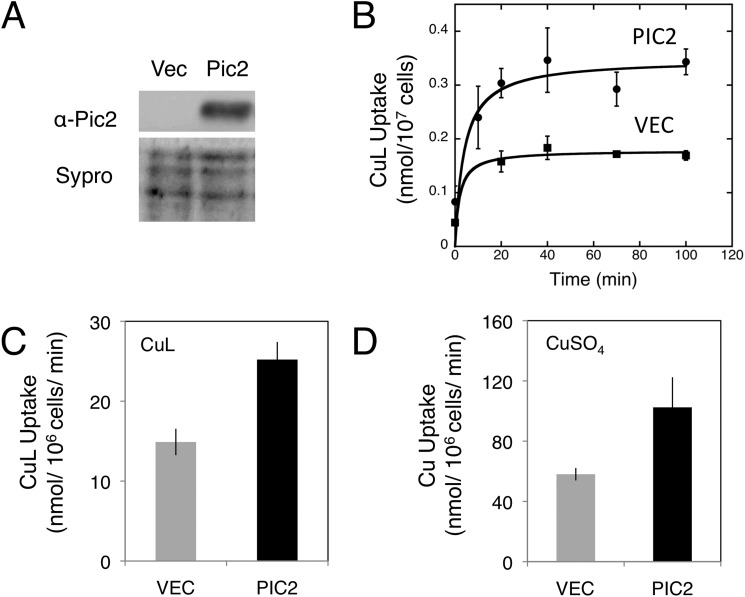
Saccharomyces cerevisiae must import copper into the mitochondrial matrix for eventual assembly of cytochrome c oxidase. This copper is bound to an anionic fluorescent molecule known as the copper ligand (CuL). Here, we identify for the first time a mitochondrial carrier family protein capable of importing copper into the matrix. In vitro transport of the CuL into the mitochondrial matrix was saturable and temperature-dependent. Strains with a deletion of PIC2 grew poorly on copper-deficient non-fermentable medium supplemented with silver and under respiratory conditions when challenged with a matrix-targeted copper competitor. Mitochondria from pic2Δ cells had lower total mitochondrial copper and exhibited a decreased capacity for copper uptake. Heterologous expression of Pic2 in Lactococcus lactis significantly enhanced CuL transport into these cells. Therefore, we propose a novel role for Pic2 in copper import into mitochondria.

Keywords: Copper; Copper Transport; Cytochrome c Oxidase; Mitochondria; Mitochondrial Carrier Family; Silver; Yeast; Yeast Metabolism.


Figures

FIGURE 1.
FIGURE 1.
In vitro CuL uptake in purified mitochondria. A, intact mitochondria were incubated with purified CuL and isolated by centrifugation, and copper was measured by ICP-OES. Fraction of maximal uptake is plotted versus incubation time for an average of three independent experiments with wild-type mitochondria. Error bars represent S.D. B, initial rates of uptake across a range of CuL concentrations. Data are fit by a hyperbolic curve. The inset shows the initial rate of uptake at 0–50 μm CuL and is fitted by linear regression. C, the initial rate of CuL uptake was measured by ICP-OES in intact mitochondria, mitoplasts (MP) were prepared by hypotonic lysis, and mitochondria were incubated with the uncoupler carbonyl cyanide m-chlorophenylhydrazone (CCCP) or were incubated at 4 °C. The means ± S.D. are shown for three independent experiments.
FIGURE 2.
FIGURE 2.
Silver accumulates in yeast mitochondria. A, the mineral element content of purified mitochondria from BY4741 yeast cultured in the absence or presence of 185 μm silver was quantified by ICP-OES and is expressed as a ratio (i.e. with silver/without silver). The means ± S.D. of three independent cultures and mitochondrial preparations are shown. B, CcO activity of purified mitochondria from A and oxygen consumption of whole cells cultured in YP/galactose medium without or with 185 μm silver. C, serial dilutions of BY4741 yeast grown in rich medium with a fermentable carbon source (YPD medium (YP medium containing glucose)) or with a non-fermentable carbon source (YPLG medium (YP medium containing lactate and glycerol)) in the presence of the cell-impermeable copper chelator BCS and increasing silver concentrations. The growth defect was reversed by addition of copper to the BCS- and silver-supplemented plates. D, anion exchange fractionation of soluble contents from purified mitochondria isolated from cultures grown in 185 μm silver. Copper (■) and silver (♦) were measured by ICP-OES. NH4-Ace, ammonium acetate.
FIGURE 3.
FIGURE 3.
In vitro AgL uptake into purified mitochondria. A, intact mitochondria were incubated with purified AgL and isolated by centrifugation, and silver was measured by ICP-OES. The initial rates of uptake are plotted against a range of AgL concentrations. A hyperbolic curve is fitted. B, the initial rate of CuL uptake at 10 μm CuL was measured by ICP-OES in intact mitochondria in the presence of 100 μm AgL (n = 5). C, the initial rate of AgL uptake with 10 μm AgL was measured by ICP-OES in intact mitochondria in the presence of 100 μm CuL (n = 5).
FIGURE 4.
FIGURE 4.
Silver-related growth phenotypes of pic2Δ yeast strains. A, serial dilutions of BY4741 and pic2Δ strains grown in rich medium with a fermentable carbon source (YPD medium) or with a non-fermentable carbon source (YPLG medium) in the presence of the cell-impermeable copper chelator BCS and increasing silver concentrations. The growth defect was reversed by addition of copper to the BCS- and silver-supplemented plates. B, Western blots for Cox2 in mitochondria isolated from cells grown in rich medium with a fermentable carbon source (upper panel) or in identical medium supplemented with 150 μm silver (lower panel). Porin served as an internal loading control.
FIGURE 5.
FIGURE 5.
Growth phenotypes of pic2Δ yeast strains upon copper depletion. A, serial dilutions of BY4741 and pic2Δ strains grown in synthetic medium with a non-fermentable carbon source (glycerol; SC Gly) with or without 20 μm BCS. B, left panel, CcO activity in mitochondria isolated from parental and pic2Δ strains grown in synthetic medium containing galactose as a carbon source. MDH, malate dehydrogenase. Right panel, oxygen consumption read as percent air/A600/s of whole cells from each strain grown in galactose-containing rich medium (n = 3). C, serial dilutions of parental and pic2Δ strains transformed with either empty vector (vec) or matrix-targeted CRS5 (mCRS5) on rich medium with a fermentable carbon source (YPD medium), with a non-fermentable carbon source (YPLG medium), or YPLG medium with limited copper availability (+50 μm BCS and +100 μm BCS).
FIGURE 6.
FIGURE 6.
Deletion of PIC2 limits hSOD1 activity in a ccs1Δ::IMhSOD1 reporter strain. A, Western blot analysis of mitochondrial extracts from ccs1Δ::IMhSOD1 and ccs1Δ::IMhSOD1 pic2Δ strains, probed with anti-hSOD1 antibody and porin as an internal loading control. B, activity of SOD1 in isolated mitochondria from cells grown in synthetic medium with a fermentable carbon source supplemented with 50 μm BCS as measured by xanthine oxidase/tetrazolium salt assay (n = 3). There was no detectable SOD1 activity in ccs1Δ mitochondria. C, activity of SOD1 in isolated mitochondria from cells grown in synthetic medium with a fermentable carbon source supplemented with increasing silver concentrations (20, 40, and 80 μm). Arb., arbitrary; mito, mitochondria.
FIGURE 7.
FIGURE 7.
Total mineral element profile and uptake in pic2Δ mitochondria. A, overall mineral profile of purified intact mitochondria from pic2Δ cells assayed by ICP-OES and compared with that of parental cells. Both strains were grown in medium containing 500 μm copper. The value for each mineral represents the average of ICP-OES analysis of 10 independent mitochondrial preparations, and bars represent S.E. B, isolated mitochondria from parental or pic2Δ cells were assayed for in vitro uptake of the CuL. Initial rates of uptake are plotted versus variable CuL concentrations. The line is fit by linear regression.
FIGURE 8.
FIGURE 8.
Pic2 expressed in L. lactis. A, Western blot analysis of L. lactis extracts from cells transformed with either empty vector (Vec) or PIC2 probed with anti-Pic2 antibody after nisin induction. Sypro ruby-stained extracts are shown as loading controls. B, uptake of the CuL by intact cells transformed with an empty vector (Vec) or PIC2 incubated at room temperature over time with 20 μm CuL (n = 4). Error bars represent S.E. Data are fit by a hyperbolic curve. C, CuL uptake in cells with either an empty vector or PIC2 incubated with 10 μm CuL (n = 3). Error bars represent S.E. D, copper uptake in cells with either an empty vector or PIC2 incubated with 10 μm CuSO4 (n = 3). Error bars represent S.E.

Similar articles

Cited by

References

    1. Cobine P. A., Pierrel F., Winge D. R. (2006) Copper trafficking to the mitochondrion and assembly of copper metalloenzymes. Biochim. Biophys. Acta. 1763, 759–772 - PubMed
    1. Huffman D. L., O'Halloran T. V. (2001) Function, structure, and mechanism of intracellular copper trafficking proteins. Annu. Rev. Biochem. 70, 677–701 - PubMed
    1. Dancis A., Yuan D. S., Haile D., Askwith C., Eide D., Moehle C., Kaplan J., Klausner R. D. (1994) Molecular characterization of a copper transport protein in S. cerevisiae: an unexpected role for copper in iron transport. Cell 76, 393–402 - PubMed
    1. Reddi A. R., Culotta V. C. (2013) SOD1 integrates signals from oxygen and glucose to repress respiration. Cell 152, 224–235 - PMC - PubMed
    1. Tsukihara T., Aoyama H., Yamashita E., Tomizaki T., Yamaguchi H., Shinzawa-Itoh K., Nakashima R., Yaono R., Yoshikawa S. (1996) The whole structure of the 13-subunit oxidized cytochrome c oxidase at 2.8 Å. Science 272, 1136–1144 - PubMed

Publication types

MeSH terms

LinkOut - more resources