Review
. 2013 Dec;70(24):4695-710.
doi: 10.1007/s00018-013-1410-5. Epub 2013 Jul 12.

The transverse-axial tubular system of cardiomyocytes

Affiliations
Review

The transverse-axial tubular system of cardiomyocytes

C Ferrantini et al. Cell Mol Life Sci. 2013 Dec.

Abstract

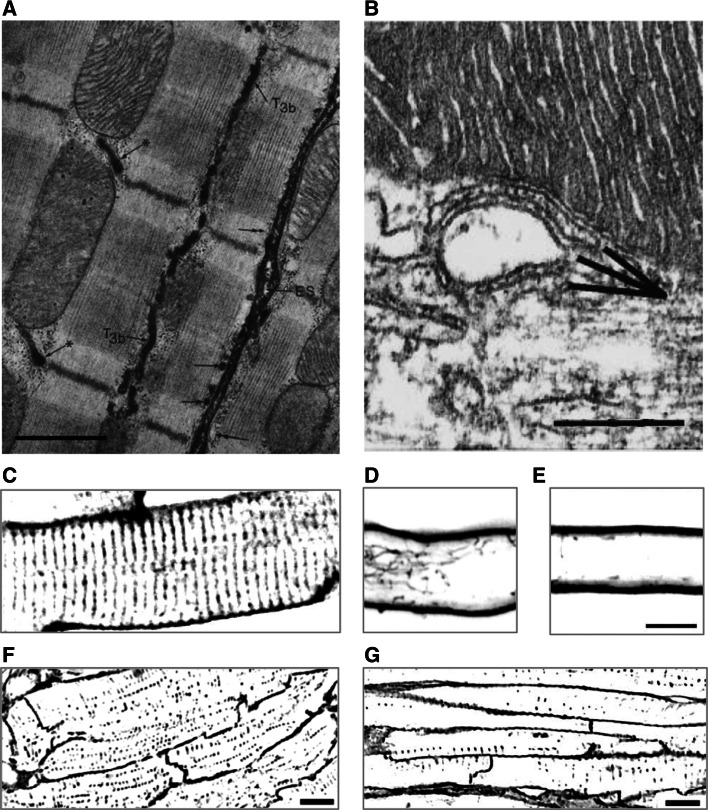
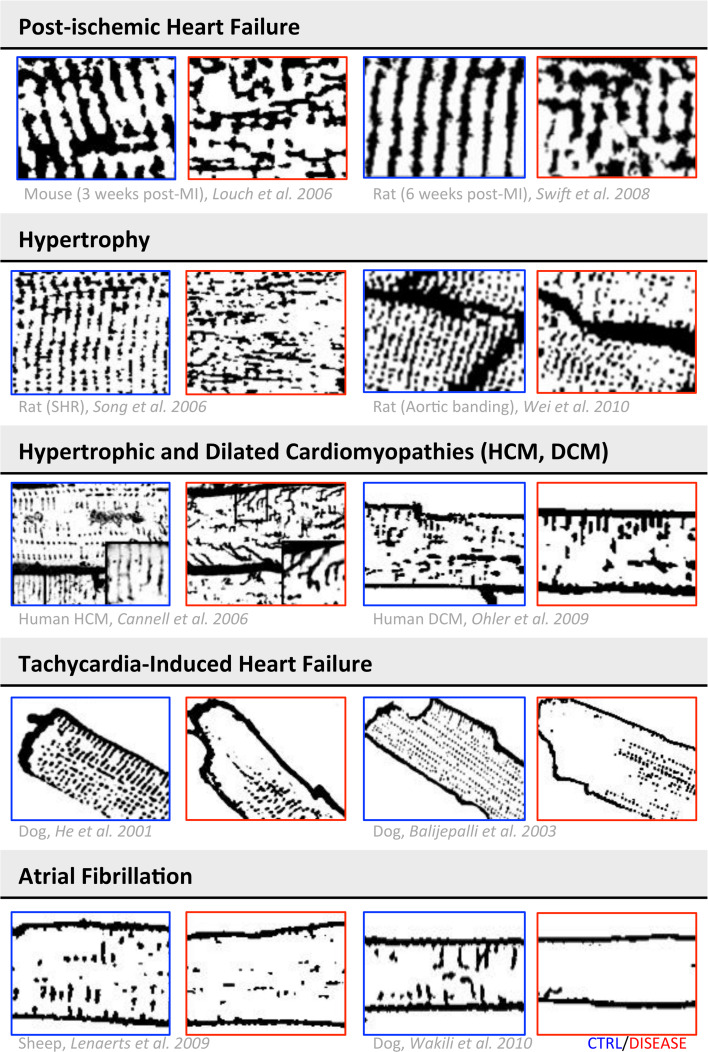
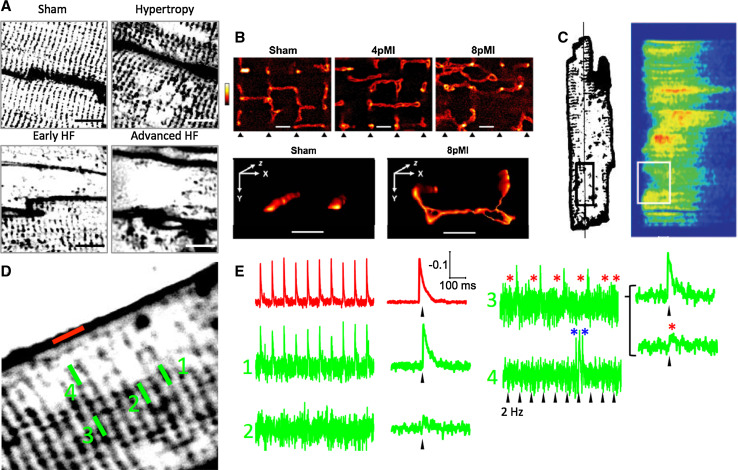
A characteristic histological feature of striated muscle cells is the presence of deep invaginations of the plasma membrane (sarcolemma), most commonly referred to as T-tubules or the transverse-axial tubular system (TATS). TATS mediates the rapid spread of the electrical signal (action potential) to the cell core triggering Ca(2+) release from the sarcoplasmic reticulum, ultimately inducing myofilament contraction (excitation-contraction coupling). T-tubules, first described in vertebrate skeletal muscle cells, have also been recognized for a long time in mammalian cardiac ventricular myocytes, with a structure and a function that in recent years have been shown to be far more complex and pivotal for cardiac function than initially thought. Renewed interest in T-tubule function stems from the loss and disorganization of T-tubules found in a number of pathological conditions including human heart failure (HF) and dilated and hypertrophic cardiomyopathies, as well as in animal models of HF, chronic ischemia and atrial fibrillation. Disease-related remodeling of the TATS leads to asynchronous and inhomogeneous Ca(2+)-release, due to the presence of orphan ryanodine receptors that have lost their coupling with the dihydropyridine receptors and are either not activated or activated with a delay. Here, we review the physiology of the TATS, focusing first on the relationship between function and structure, and then describing T-tubular remodeling and its reversal in disease settings and following effective therapeutic approaches.


Figures

Fig. 1
Fig. 1
TATS in cardiac myocytes. a Three-dimensional reconstruction of TATS from confocal microscopy images in a rat ventricular cardiomyocyte. Modified from [108]. b Confocal images of myocytes labeled with membrane dyes and transverse line scans showing intracellular Ca2+. Loss of functional T-tubules (lower panels), obtained with formamide osmotic shock in isolated myocytes, determines an inhomogeneous Ca2+ release throughout the cell, with delayed Ca2+ transient rise in the cell core. Modified from [73]. c Two-photon image of a portion of sarcolemma labeled with di-4-ANEFFPTEA. The membrane is rapidly scanned using the RAMP system at the three sites marked and voltage variations are recorded while pacing the myocyte. Of note, SS, TT and AT do not show any differences in the shape of locally recorded APs. d Average amplitude of voltage variations at SS, TT and AT. Modified from [23]. The fluorescence TATS images are shown inverted with contrast and threshold modified from the original version to make the T-system uniform and comparable among different panels
Fig. 2
Fig. 2
Cardiac tubule structure, junctions and network. a Electron micrograph of rat right ventricle, showing the extracellular space (ES), tubules running transversally (asterisk) and longitudinally (T3b). The arrows point at subsarcolemmal cisternae either labeled (double arrows) or unlabeled (single arrows) by the extracellular marker. Calibration bar 1.0 μm. Modified from [25]. b Electron micrograph of mouse left ventricle, showing an internal junction between SR and a T-tubule. Two SR elements (probably belonging to the same cisterna but separated in the image due to the sectioning plane) are apposed to a T-tubule. Calibration bar 0.25 μm. Modified from [109]. ce Confocal images of rat myocytes, stained with di-8-ANEPPS and showing the dense tubular network in ventricular cells (c) and the low density or almost absence of tubules in atrial cells (d). In (d), a large longitudinal component can be noticed. Calibration bar 10 μm. Modified from [30]. fg Confocal images of sheep myocytes, stained with FITC-conjugated wheat germ agglutinin and showing the presence of a developed tubular network (albeit with lower density than in rat) in the ventricle (f) and a less developed network in the atrium (g). Modified from [27]. The fluorescence images are shown inverted with contrast and threshold modified from the original version to make the tubular system uniform and comparable among different panels
Fig. 3
Fig. 3
TATS integrity and AP propagation. a Two-photon fluorescence (TPF) image of a myocyte with TATS stained before detubulation (S/D) by formamide-induced osmotic shock. Scale bar 5 μm. b Normalized fluorescence traces from the scanned lines indicated in (a): no electrical activity is detected in the scanned TATS regions (green and blue traces). Arrowheads point at the time of electrical stimulation. c Average of the ten sequential episodes shown in (b). d TPF image from a myocyte stained after detubulation (D/S): only a subpopulation of TTs is well labeled. Scale bar 5 μm. g Normalized fluorescence traces from the scanned lines indicated in (d): SS and TT 1 show regular APs, whereas TT 2 and TT 3 display non-regenerative electrical responses. Red asterisks in TT 3 highlight AP failures. f Average of ten episodes for SS, TT 1, and TT 2. Separate averaging of six APs and four subthreshold events in TT 3. Modified from [23]. The fluorescence images are shown inverted with contrast and threshold modified from the original version to make the T-system uniform and comparable among different panels
Fig. 4
Fig. 4
TATS remodeling in cardiac diseases. The table shows a collection of representative images obtained with membrane labeling and confocal microscopy from different animal and human models of cardiac disease. For each reference, representative images of diseased myocytes are in the red squares, while the respective controls are in the blue squares. Images modified from [34, 52, 53, 63, 64, 67, 68, 77, 110, 111]. The images are shown inverted with contrast and threshold modified from the original version to make the T-system uniform and comparable among different panels
Fig. 5
Fig. 5
Abnormal TATS function in HF. a Representative T-tubule images (FM4–64 membrane staining) from the left ventricle of sham-operated, hypertrophic, early HF, and advanced HF rat hearts, showing the progression of TATS remodeling at different stages of the disease. Rats were subjected to pressure overload by thoracic aortic banding, leading first to left ventricular hypertrophy and then failure. Modified from [64]. b Live-cell STED images (di-8-ANEPPS membrane staining) showing TATS structures from sham, 4 weeks post-MI (4pMI), and 8 weeks post-MI (8pMI) cells (bottom triangles indicate position of striations); TATS appears enlarged, misaligned, and with increased longitudinal components in 4 weeks post-MI and, more pronouncedly, 8 weeks post-MI. Scale bar 1 μm. Modified from [69]. c Cell from a pig model of chronic ischemia, 6 weeks after inducing severe stenosis of the circumflex coronary artery. T-tubular (WGA-Alexa594) and corresponding line-scan Ca2+ (Fluo 3) images, showing that the regions of delayed Ca2+ release are related to areas of T-tubule rarefaction. Right horizontal scale bar 10 μm; vertical scale bar = 100 μm; left horizontal scale bar 50 ms. Modified from [26]. d Representative TPF image of a HF myocyte. e Normalized fluorescence traces from the scanned line indicated in (d): SS and TT 1 show that regular APs, TT 2, and TT 3 display non-regenerative electrical responses, and TT 4 highlights local arrhythmic events (blue asterisks). d, e Modified from [23]. The fluorescence TATS images in (a, c, and d) are shown inverted with contrast and threshold modified from the original version to make the T-system uniform and comparable among different panels
Fig. 6
Fig. 6
Molecular complexes implicated in TATS turn-over and reverse remodeling. a Junctophilin-2 (JPH2) knockdown causes disorganization and loss of TATS: confocal images of di-8-ANEPPS stained cardiomyocytes. Modified from [101]. b HF myocytes show lower TATS density and T-tubular dilation, which are partially reversed by mechanical unloading (HF-unloading). Modified from [91]. c Retubulation of failing cardiomyocytes after rescue by AAV9SERCA2a gene therapy. Confocal images of di-8-ANNEPPS stained healthy, failing (HF) and failing AAV9SERCA2a-treated (HF + S) hearts. Modified from [97]. d Exercise training in HF (MI-TR) increases TATS density, compared to sedentary heart failure (MI-SED): confocal images of di-8-ANEPPS stained cardiomyocytes. Modified from [100]. The fluorescence images are shown inverted with contrast and threshold modified from the original version to make the T-system uniform and comparable among different panels

References

    1. Lindner E. Submicroscopic morphology of the cardiac muscle. Z Zellforsch Mikrosk Anat. 1957;45(6):702–746. - PubMed
    1. Tidball JG, Cederdahl JE, Bers DM. Quantitative analysis of regional variability in the distribution of transverse tubules in rabbit myocardium. Cell Tissue Res. 1991;264(2):293–298. - PubMed
    1. Franzini-Armstrong C, Venosa RA, Horowicz P. Morphology and accessibility of the ‘transverse’ tubular system in frog sartorius muscle after glycerol treatment. J Membr Biol. 1973;14(3):197–212. - PubMed
    1. Bers DM. Cardiac excitation-contraction coupling. Nature. 2002;415(6868):198–205. - PubMed
    1. Kushnir A, Marks AR. The ryanodine receptor in cardiac physiology and disease. Adv Pharmacol. 2010;59:1–30. - PMC - PubMed

Publication types

LinkOut - more resources