. 2013 Dec 1;22(23):4768-83.
doi: 10.1093/hmg/ddt330. Epub 2013 Jul 11.

Mitochondrial respiration without ubiquinone biosynthesis

Affiliations

Mitochondrial respiration without ubiquinone biosynthesis

Ying Wang et al. Hum Mol Genet. .

Abstract

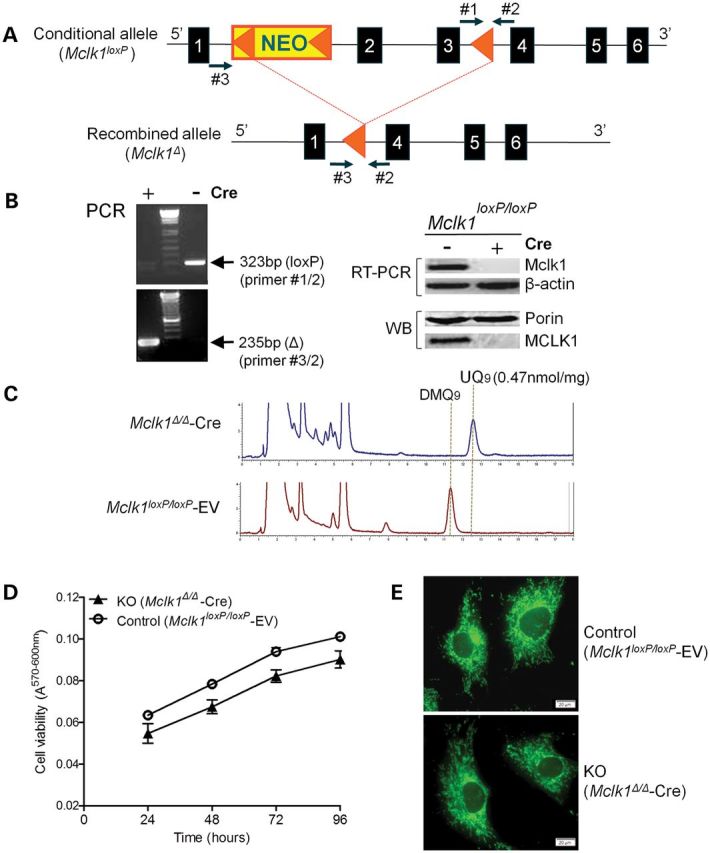
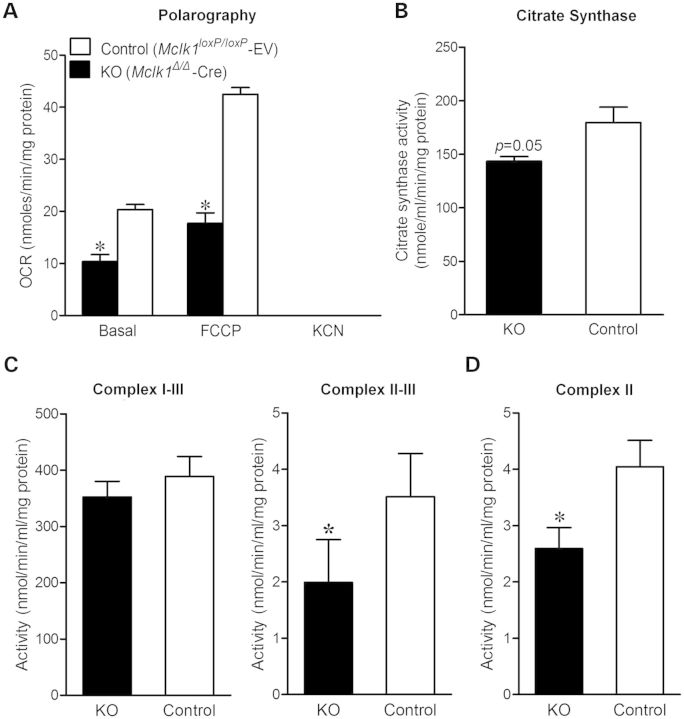
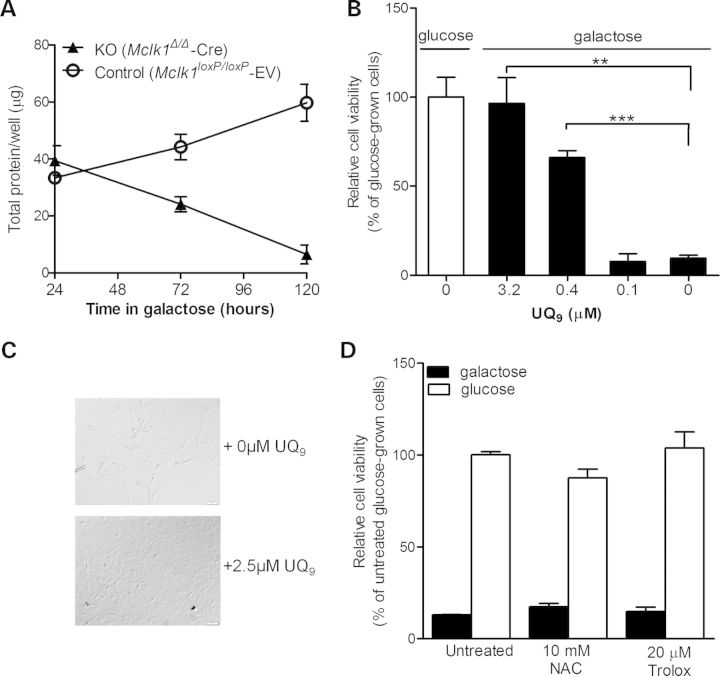
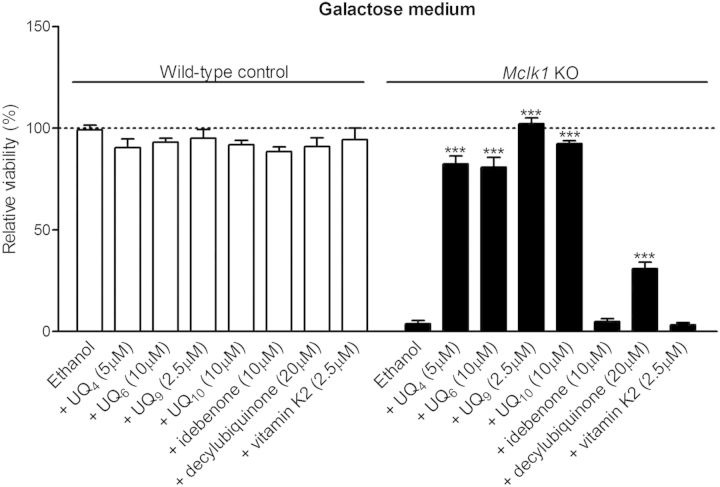
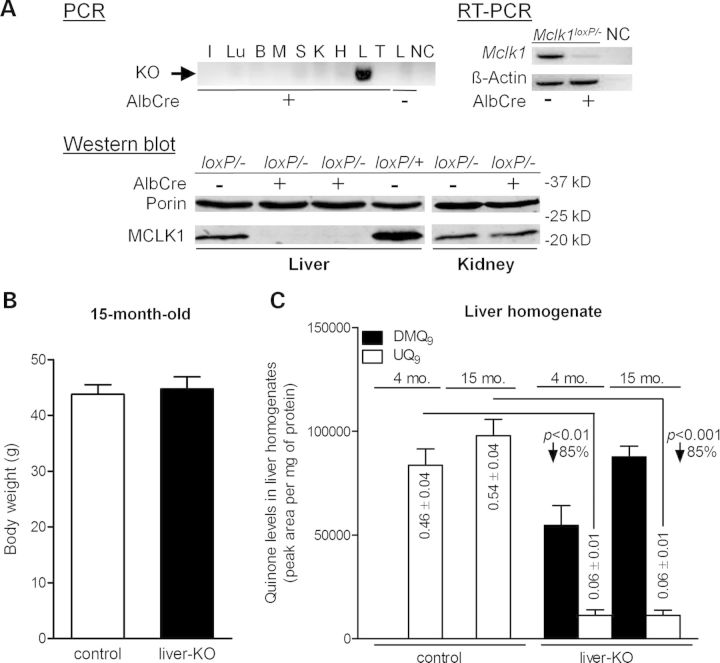
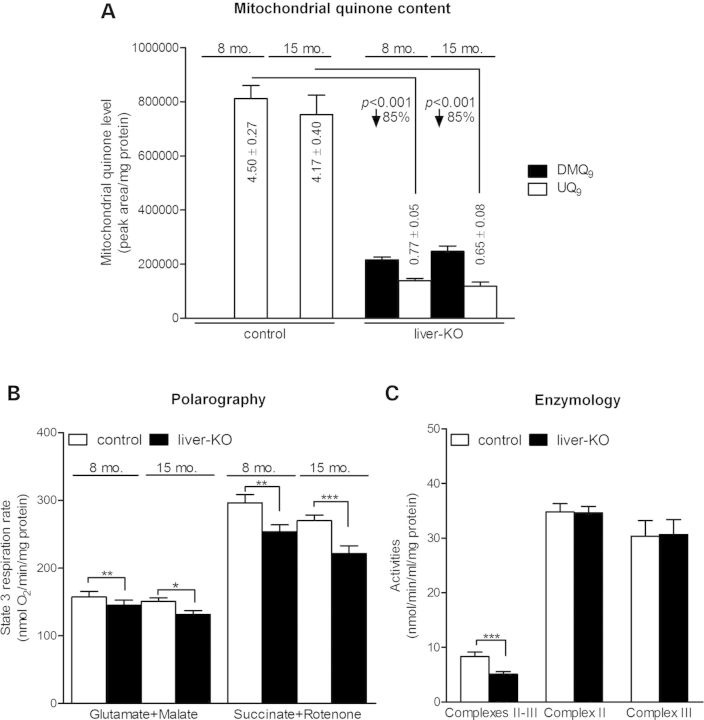
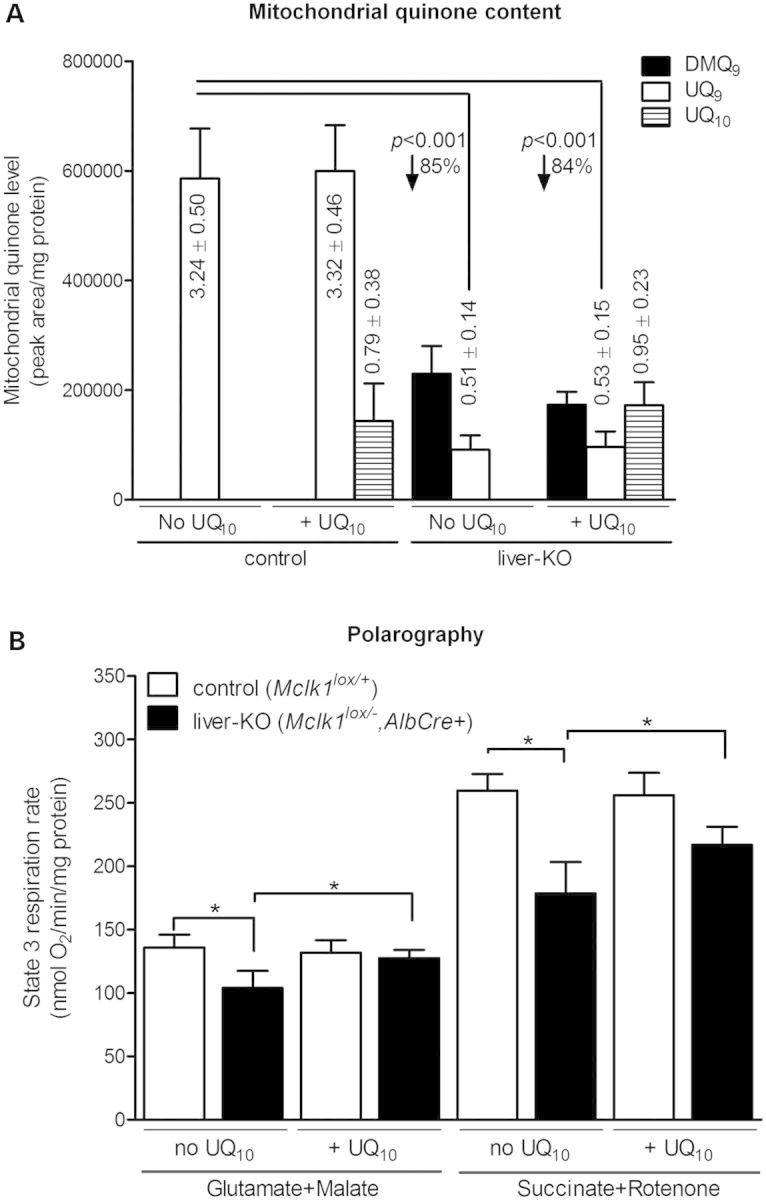
Ubiquinone (UQ), a.k.a. coenzyme Q, is a redox-active lipid that participates in several cellular processes, in particular mitochondrial electron transport. Primary UQ deficiency is a rare but severely debilitating condition. Mclk1 (a.k.a. Coq7) encodes a conserved mitochondrial enzyme that is necessary for UQ biosynthesis. We engineered conditional Mclk1 knockout models to study pathogenic effects of UQ deficiency and to assess potential therapeutic agents for the treatment of UQ deficiencies. We found that Mclk1 knockout cells are viable in the total absence of UQ. The UQ biosynthetic precursor DMQ9 accumulates in these cells and can sustain mitochondrial respiration, albeit inefficiently. We demonstrated that efficient rescue of the respiratory deficiency in UQ-deficient cells by UQ analogues is side chain length dependent, and that classical UQ analogues with alkyl side chains such as idebenone and decylUQ are inefficient in comparison with analogues with isoprenoid side chains. Furthermore, Vitamin K2, which has an isoprenoid side chain, and has been proposed to be a mitochondrial electron carrier, had no efficacy on UQ-deficient mouse cells. In our model with liver-specific loss of Mclk1, a large depletion of UQ in hepatocytes caused only a mild impairment of respiratory chain function and no gross abnormalities. In conjunction with previous findings, this surprisingly small effect of UQ depletion indicates a nonlinear dependence of mitochondrial respiratory capacity on UQ content. With this model, we also showed that diet-derived UQ10 is able to functionally rescue the electron transport deficit due to severe endogenous UQ deficiency in the liver, an organ capable of absorbing exogenous UQ.


Figures

Figure 1.
Figure 1.
Generation of MEFs lacking MCLK1. (A) Schematic illustration of the conditional Mclk1 allele. A loxP/FRT-flanked Neo cassette (NEO, yellow) is inserted upstream of exon 2. A third loxP site is inserted downstream of exon 3. Exons are shown as blue boxes, and loxP sites are shown as orange triangles. Primers #1 and 2 were used to distinguish the conditional (Mclk1loxP) allele and wild-type allele, whereas PCR using primers #2 and 3 reveal the presence or absence of the recombined allele (Mclk1Δ). (B) Deletion efficiency in Mclk1loxP/loxP MEFs infected with pBabe-puro-Cre retrovirus. The recombined allele (Δ) but not the floxed allele (loxP) was detected by PCR in Mclk1loxP/loxP MEFs infected with Cre-expressing retrovirus (+). The results of the RT-PCR show loss of Mclk1 mRNA expression in Cre-expressing MEFs. β-Actin was used as RT-PCR control. Western blot (WB) indicates that MCLK1 protein is absent in Cre-expressing MEFs. Mitochondrial outer membrane protein Porin served as loading control. (C) HPLC traces of quinone extracts recorded at 275 nm. DMQ9 is the only detectable quinone in Mclk1 knockout MEFs (Mclk1Δ/Δ-Cre). The UQ9 concentration in control cells (Mclk1loxP/loxP MEF lines infected with empty retroviral vector; Mclk1loxP/loxP -EV) is shown (normalized to protein content). (D) Growth curves of the indicated MEFs. Cells were seeded in triplicates in 48-well plates and viability was determined at the indicated time points with alamarBlue Assay. Cell viability is reported as the difference in absorbance at the two wavelengths (A570 nmA600 nm) which changes with the number of living cells. Each growth curve represents three Mclk1loxP/loxP MEF lines infected with either Cre-expressing retrovirus or retrovirus alone. No significant difference in proliferation rate is observed between Mclk1 knockout and control MEFs. (E) MitoTracker Green staining shows a typical reticular network of mitochondria in knockout MEFs. Scale bars = 20 µm.
Figure 2.
Figure 2.
Oxygen consumption and activities of mitochondrial respiratory enzymes. (A) OCR of intact cells measured polarographically. OCR is normalized to total cellular protein. Both basal and uncoupler (FCCP)-stimulated respiration rates are lower in Mclk1 knockout (KO) MEFs in comparison with controls. Results are the mean ± SEM of three paired MEF lines. (B) CS activity in whole-cell extracts normalized to total protein. Results are the mean ± SEM of five paired MEF lines. A lower activity of CS in Mclk1 KO MEFs indicates reduced mitochondrial content. (C and D) Activities of mitochondrial respiratory complexes. Mitochondria prepared from Mclk1 KO MEFs have normal activity of Complexes I–III and decreased activities of Complexes II–III and Complex II. Results are the mean ± SEM of four to five pairs of MEF lines. Paired t-tests were conducted to compare the measurements between control and Mclk1 KO MEFs. The asterisk (*) denotes a statistically significant difference at P < 0.05.
Figure 3.
Figure 3.
Non-viability of Mclk1 knockout MEFs in galactose medium and rescue by UQ9. (A) Growth curves of Mclk1 knockout (KO) and control MEFs cultured in galactose medium. Cells seeded in 48-well plates were first grown in glucose-containing DMEM overnight, and then culture medium was replaced into glucose-free DMEM containing galactose. Total cellular protein per well was determined using the BCA protein assay (Pierce) at the indicated time points. Most Mclk1 KO MEFs died after 4 days in galactose medium, while control fibroblasts showed continued growth. Results are presented as the mean ± SEM of three independent MEF lines. (B) UQ9 supplementation rescues the viability of Mclk1 KO MEFs grown in galactose-containing medium. Mclk1 KO MEFs were first grown in glucose medium overnight, and then culture medium was replaced into galactose medium added with varying concentrations of UQ9. Cell viability was determined by the alamarBlue Cell Viability Assay 4 days later. Data are expressed as percentage of viability relative to that of glucose-grown KO MEFs (viability = 100%) and presented as the mean ± SEM of three independent MEF lines. The Student's t-test was used to compare the difference in viability between the KO MEFs grown in the presence or absence of UQ9 (*P < 0.05; **P < 0.01). (C) Phase-contrast images of Mclk1 KO MEFs grown in galactose medium supplemented with or without UQ9 (magnification, ×100). Conditions were the same as described for (B). Images were taken after 4 days of growth in galactose. (D) N-Acetylcysteine (NAC) and Trolox (vitamin E analog) fail to rescue the survival of Mclk1 KO MEFs in galactose medium. Experimental conditions were similar to those described for (B). Results are expressed as percentage of viability compared with untreated glucose-grown KO MEFs (set to 100% viability) and are the mean ± SEM of three independent MEF lines. No difference was seen between untreated Mclk1 KO MEFs and those treated with the testing antioxidants (ANOVA/Dunnett test).
Figure 4.
Figure 4.
Rescuing ability of various UQ analogues on galactose-induced lethality. Conditions were the same as described for Figure 3B. Cell viability is expressed as relative percentage compared with that of wild-type control fibroblasts (Mclk1loxP/loxP-EV) treated at the same time with ethanol (vehicle). UQ4, UQ6 and UQ10, but not idebenone, decylubiquinone and Vitamin K2, greatly improve the survival of Mclk1 KO fibroblasts (Mclk1Δ/Δ-Cre) in galactose medium. Indicated doses are the highest doses that did not show significant toxicity on the control fibroblasts (idebenone, decylubiquinone and Vitamin K2) or were the most effective dose among those used in this work (UQ4, UQ6, UQ9 and UQ10). Data are the mean values ± SEM for at least three MEF lines. In each group (wild-type control or KO), compound treatments are compared with the ethanol-treated culture using one-way ANOVA with Dunnet's multiple comparison test. ***P < 0.001.
Figure 5.
Figure 5.
Conditional knockout of Mclk1 in liver. (A) Confirmation of Mclk1 deletion in the liver of Mclk1liver-KO mice (Mclk1loxP/−, AlbCre+). Upper panel: on PCR analysis, the band of excised allele is observed in the liver of Mclk1liver-KO mice but not in other tissues or the liver of AlbCre-negative mice (Mclk1loxP/−). PCR was performed on DNA isolated from tissues of 4-month-old mice (I, intestine; Lu, lung; B, brain; M, skeletal muscle; S, spleen; K, kidney; H, heart; L, liver; T, tail) or from the liver of Mclk1loxP/− mice. RT-PCR analysis detected mRNA expression of Mclk1 in the liver not expressing the AlbCre transgene, but barely in the liver of Mclk1liver-KO mice. Expression of β-actin, used as RT-CPR control, is identical in AlbCre positive and negative mouse livers. NC is negative control. Lower panel: western blotting analysis for the level of MCLK1 protein in liver mitochondria shows that MCLK1 expression is lost in the liver of Mclk1liver-KO mice, but not changed in the kidney in comparison with AlbCre-negative Mclk1loxP/− controls. The mitochondrial outer membrane protein, porin, was used as loading control. (B) Fifteen-month-old Mclk1liver-KO mice have a similar body weight to AlbCre-negative littermate controls (Mclk1loxP/−). Each column represents the mean ± SEM of nine mice. (C) Quinone content in Mclk1 knockout liver. The columns show the mean ± SEM of the peak areas for DMQ9 and UQ9 on HPLC chromatographs normalized to protein content. UQ9 concentrations expressed also as nmol/mg protein, are reduced by an average of 85% in the liver of Mclk1liver-KO mice relative to the level in Mclk1loxP/− controls. In addition, the knockout liver has substantial accumulation of DMQ9 and it increases with age. n = 5 littermate pairs for 4-month data and 9 littermate pairs for 15-month data. Statistical analysis was performed by the Student's paired t-test.
Figure 6.
Figure 6.
Mitochondrial respiratory chain function in Mclk1 knockout liver. (A) Liver mitochondria of Mclk1liver-KO mice (Mclk1loxP/−, AlbCre+) exhibit accumulation of DMQ9 along with a dramatic reduction in UQ9 content compared with that in Mclk1loxP/− controls. Columns show the mean ± SEM of peak areas on HPLC chromatographs normalized to protein content. Mitochondrial UQ9 concentrations expressed also as nmol/mg mitochondrial protein, are reduced by an average of 85% in the KO livers compared with controls. n = 8 littermate pairs for 8-month data and 10 littermate pairs for 15-month data. (B) Mclk1 knockout liver displays a mild reduction in mitochondrial state 3 respiration rates. State 3 respiration rates with Complex I-linked substrates, glutamate plus malate, are 8% (8-month-old) to 13% (15-month-old) lower than their respective littermate controls (Mclk1loxP/−). Complex II-dependent respiration, measured with succinate plus rotenone, is decreased by 14% (8-month-old) to 18% (15-month-old). In both control and knockout liver, there seems to be a trend toward a decrease with age, but it is not statistical significant. Columns represent mean values ± SEM of eight to nine mice per group. (C) Enzymatic activities of respiratory complexes in isolated liver mitochondria. The integrated activity of Complex II + III is significantly decreased in the liver mitochondrial preparation from Mclk1liver-KO mice (15-month-old), whereas the activities of individual complexes are unaltered compared with Mclk1loxP/− controls. Columns represent the mean enzymatic activities ±SEM of 11–14 mice. Significant differences were compared with controls by paired t-test. *P < 0.05, **P < 0.01 and ***P < 0.001.
Figure 7.
Figure 7.
Effects of oral UQ10 supplementation on mitochondrial UQ levels and state 3 respiration rate in the liver. (A) UQ10 administration increases the levels of UQ10 in liver mitochondria. Similar to that shown in Figure 6A, liver mitochondria isolated from Mclk1liver-KO mice have ∼15% UQ9 relative to controls (Mclk1loxP/+) and accumulate DMQ9. Mitochondrial UQ10 uptake is similar in Mclk1 knockout livers and controls. UQ10 supplementation has no effect on the endogenous content of DMQ9 and UQ9. The columns represent the mean ± SEM of quinone peak area on HPLC chromatographs normalized to protein amounts. Mitochondrial UQ concentrations are expressed nmol/mg mitochondrial protein. n = 6 mice per group. (B) Liver mitochondria of UQ10-fed Mclk1liver-KO mice show a higher state 3 respiration rate (21%–23% more) for both Complex I and II substrates than those of untreated Mclk1liver-KO mice. Such effect is not seen in control group (Mclk1loxP/+). Columns represent mean value ± SEM of six mice per group. Statistical evaluation was performed using paired t-test. *P < 0.05.

Similar articles

Cited by

References

    1. Crane F.L. Discovery of ubiquinone (coenzyme Q) and an overview of function. Mitochondrion. 2007;7(suppl):S2–S7. - PubMed
    1. Lenaz G. A critical appraisal of the mitochondrial coenzyme Q pool. FEBS Lett. 2001;509:151–155. - PubMed
    1. Bentinger M., Brismar K., Dallner G. The antioxidant role of coenzyme Q. Mitochondrion. 2007;7(suppl):S41–S50. - PubMed
    1. Walter L., Miyoshi H., Leverve X., Bernard P., Fontaine E. Regulation of the mitochondrial permeability transition pore by ubiquinone analogs. A progress report. Free Rad. Res. 2002;36:405–412. - PubMed
    1. Evans D.R., Guy H.I. Mammalian pyrimidine biosynthesis: fresh insights into an ancient pathway. J. Biol. Chem. 2004;279:33035–33038. - PubMed

Publication types

MeSH terms

Supplementary concepts