. 2013 Aug 22;122(8):1437-47.
doi: 10.1182/blood-2013-02-482919. Epub 2013 Jul 11.

RARα2 expression confers myeloma stem cell features

Affiliations

RARα2 expression confers myeloma stem cell features

Ye Yang et al. Blood. .

Abstract

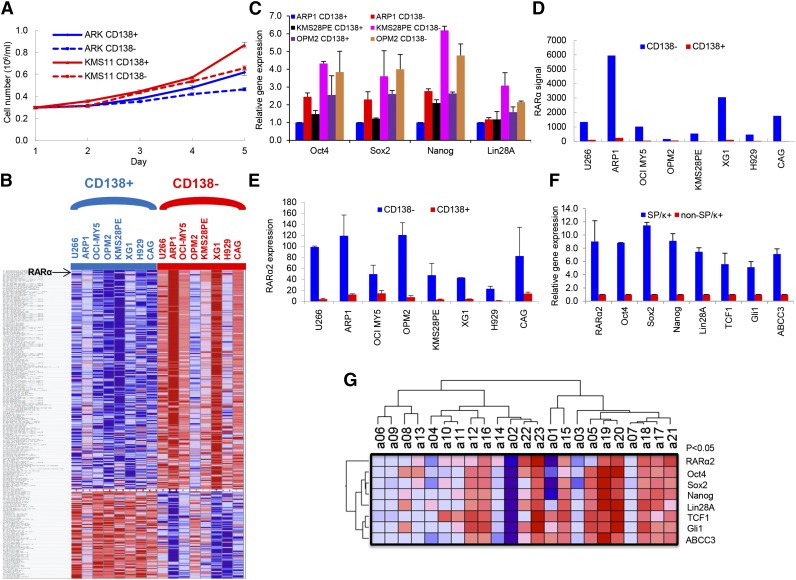
We previously demonstrated that RARα2 expression is increased in CD138 selected plasma cells of relapsed multiple myelomas (MMs), and increased expression was linked to poor prognosis in newly diagnosed MM patients. In the present study, we demonstrate that increased RARα2 confers myeloma stem cell features. Higher expression of RARα2 was identified in the multiple myeloma stem cell (MMSC) fraction. Overexpression of RARα2 in bulk MM cell lines resulted in: 1) increased drug resistance; 2) increased clonogenic potential; 3) activation of both Wnt and Hedgehog (Hh) pathways; 4) increased side population and aldehyde dehydrogenase levels; and 5) increased expression of embryonic stem cell genes. The opposite effects were seen with RARα2 knockdown. We demonstrate that RARα2 induces drug resistance by activating the drug efflux pump gene ABCC3 and anti-apoptotic Bcl-2 family members. Inhibition of Wnt signaling or ABCC3 function could overcome drug resistance in RARα2 overexpressing MM cells. We also showed that in the 5TGM1 mouse model, targeting of the Wnt and Hh pathways using CAY10404, cyclopamine, or itraconazole significantly reduced the myeloma tumor burden and increased survival. Targeting RARα2 or its downstream signaling pathways provides a potential strategy to eliminate MMSC.


Figures

Figure 1
Figure 1
RARα2 expression increases in myeloma stem cells. (A) Cell growth between CD138+ and CD138 cells from ARK and KMS11 was compared with a hemocytometer for 5 days. Cells from the CD138+ fraction exhibited higher proliferation than CD138 cells. All results were expressed as means ± SD of 3 independent experiments. (B) A supervised hierarchical cluster showed 291 significant differentially expressed genes between CD138+ and CD138 cells from 8 myeloma cell lines. Red for a gene indicates expression above the median and blue indicates expression below the median. Myeloma cell lines were plotted on the vertical axis and the gene probe sets are listed on top along the horizontal axis. (C) The expression of Oct4, Sox2, Nanog, and Lin28A was examined in CD138 and CD138+ cells of ARP1, KMS28PE, and OPM2 myeloma lines by real-time PCR. (D) RARα expression (Y-axis) was compared between CD138 cells with CD138+ cells in 8 myeloma cell lines using GEP analysis. (E) RARα2 expression was compared in the CD138 fraction vs the CD138+ fraction of 8 MM cell lines using real-time-PCR. (F) Real-time PCR showed that expression of RARα2, Oct4, Sox2, Nanog, Lin28A, TCF1, Gli1, and ABCC3 was increased in MMSCs (SP/κ+) cells compared with non-SP/κ+cells in a primary MM patient sample. (G) A Heatmap showed the expression of RARα2, Oct4, Sox2, Nanog, Lin28A, TCF1, Gli1, and ABCC3 genes in 23 primary MM samples as detected by RT-PCR.
Figure 2
Figure 2
Increased RARα2 expression induces stem cell characteristics in MM. (A) Western blots showed ALDH protein levels in OCI-MY5 and ARP1 cells transfected with either RARα2 or empty vector. (B) ALDH activity was evaluated in RARα2 overexpressing cells OCI-MY5 and ARP1 by flow cytometry analysis. (C) SP fractions of OCI-MY5 and ARP1 cells were examined by flow cytometry and the results show the percentages of SP in RARα2 overexpressing cells (1.09% in OCI-MY5 and 0.71% in ARP1) and EV control cells (0.31% in OCI-MY5 and 0.35% in ARP1).
Figure 3
Figure 3
RARα2 upregulates and physically binds with iPS reprogramming genes and promotes colony formation in MM cell lines. (A-B) The expression of Oct4, Sox2, Nanog, and Lin28A genes was examined in OCI-MY5, ARP1, KMS11, and ARK MM cells over- or underexpressed RARα2 by RT-PCR. (C) Western blots exhibited Nanog expression in RARα2 OE and EV OCI-MY5 and ARP1 cells. (D) Total lysates were prepared from HEK-293 cells transiently transfected with the constructs indicated. Co-IP was performed with anti-Flag antibody (left) or anti-V5 antibody (right), followed by western blotting with the antibodies indicated. Control IgG was used as a negative control for the Co-IP. A total of 1% of the lysate used for Co-IP was used as input. Co-IP was repeated in both directions using OCI-MY5 cells to demonstrate interaction of RARα2 with Nanog in the presence of benzonase. (E) The clonogenic capacity was compared between RARα2-OE and EV cells of OCI-MY5 and ARP1 lines (magnification ×40).
Figure 4
Figure 4
RARα2 activates both Wnt and Hh signaling. (A) Western blots show the nuclear expression of β-catenin and Gli1 in OCI-MY5 and ARP1 cells overexpressed RARα2. (B) Western blots show the nuclear expression of β-catenin and Gli1 in ARK and KMS11 cells transfected with either RARα2 shRNA or scrambled oligonucleotide (SCR). (C) Real time-PCR revealed the expression of TCF1, TCF4, LEF1, CD44, CCND1, SMO, and Gli1 in RARα2-overexpressing myeloma cells and the EV cells. (D) Cell viability was evaluated in ARK and KMS11 cells treated with ATRA, Wnt3a, and Shh or combinations. All results are expressed as means ± SD of 3 independent experiments. (E) Western blots show the expression of β-catenin and Gli1 in ARK and KMS11 cells treated with ATRA, Wnt3a, and Shh or combinations.
Figure 5
Figure 5
High expression of RARα2 induces drug-resistance in myeloma cells. (A) The clonogenic capacity was compared between RARα2 OE and EV cells of OCI-MY5 and ARP1 lines treated with bortezomib, doxorubicin, and etoposide (magnification ×40). (B) Cell apoptosis was compared between RARΑ2 OE and EV cells of OCI-MY5 and ARP1 lines treated with bortezomib, doxorubicin, and etoposide by flow cytometry. (C) Flow cytometry shows the activity of drug efflux pump between RARα2 OE and EV cells in OCI-MY5 and ARP1 lines. (D-E) Western blots show the expression of ABCC3 in RARα2-OE OCI-MY5 and ARP1 cells (D) as well as in RARα2-shRNA KMS11 and ARK cells (E).
Figure 6
Figure 6
Inhibition of RARα2 and its downstream signaling pathways decreases drug resistance induced by overexpression of RARα2. (A-B) Western blots show the expression of Bcl-2, Bcl-xl, and Mcl-1 in RARα2-OE OCI-MY5 and ARP1 cells (A) and in RARα2-shRNA ARK1 and KMS11 cells (B). (C) Flow cytometry shows the effect of COX-2 inhibitor, CAY10404, in cell membrane pump efflux induced by overexpression of RARα2 in OCI-MY5 and ARP1 cells. (D) The ABC transporter inhibitor MK-571 blocks RARα2-induced drug resistance in ARP1 cells. Clonogenic assay shows the effect of bortezomib or combination of MK571 and bortezomib on the clonogenic formation in RARα2-overexpressing ARP1 cells compared with the control (magnification ×40).
Figure 7
Figure 7
Targeting Wnt and Hh signaling induces myeloma cell apoptosis in vitro and in the 5TGM1 myeloma mouse model. (A) Clonogenic assay shows the effect of ATRA, Wnt, and Hh inhibitors in RARα2 overexpressing OCI-MY5 and ARP1 cells (magnification ×40). (B) Real-time PCR shows that the expression of TCF4, LEF1, CD44, CCND1, c-Myc, SMO, and Gli1 in CD138 cells and CD138+ cells derived from ARK and KMS11 cell lines. (C) Cell growth and viability were evaluated in CD138 cells derived from KMS11 and ARK lines treated with ATRA, Wnt, and Hh inhibitors. Results are expressed as means ± SD of 3 independent experiments. (D) Kaplan-Meier curves show the 5TGM1 C57BL/KaLwRij mouse survival treated with CAY10404, cyclopamine, and itraconazole. (E) Tumor burden was examined idiotype lgG2b levels by ELISA in the 5TGM1 C57BL/KaLwRij mice treated with CAY10404, cyclopamine, and itraconazole. (F) The model of our working hypothesis shows potential mechanisms by which RARα2 maintains myeloma stem cell features.

References

    1. Reya T, Morrison SJ, Clarke MF, Weissman IL. Stem cells, cancer, and cancer stem cells. Nature. 2001;414(6859):105–111. - PubMed
    1. Jordan CT, Guzman ML, Noble M. Cancer stem cells. N Engl J Med. 2006;355(12):1253–1261. - PubMed
    1. Matsui W, Huff CA, Wang Q, et al. Characterization of clonogenic multiple myeloma cells. Blood. 2004;103(6):2332–2336. - PMC - PubMed
    1. Bao S, Wu Q, McLendon RE, et al. Glioma stem cells promote radioresistance by preferential activation of the DNA damage response. Nature. 2006;444(7120):756–760. - PubMed
    1. Matsui W, Wang Q, Barber JP, et al. Clonogenic multiple myeloma progenitors, stem cell properties, and drug resistance. Cancer Res. 2008;68(1):190–197. - PMC - PubMed

Publication types

MeSH terms