Comparative Study
. 2013 Aug 15;54(8):5535-42.
doi: 10.1167/iovs.13-12250.

Lack of correlation between the spatial distribution of A2E and lipofuscin fluorescence in the human retinal pigment epithelium

Affiliations
Comparative Study

Lack of correlation between the spatial distribution of A2E and lipofuscin fluorescence in the human retinal pigment epithelium

Zsolt Ablonczy et al. Invest Ophthalmol Vis Sci. .

Abstract

Purpose: The accumulation of lipofuscin in the RPE is a hallmark of aging in the eye. The best characterized component of lipofuscin is A2E, a bis-retinoid byproduct of the normal retinoid visual cycle, which exhibits a broad spectrum of cytotoxic effects in vitro. The purpose of our study was to correlate the distribution of lipofuscin and A2E across the human RPE.

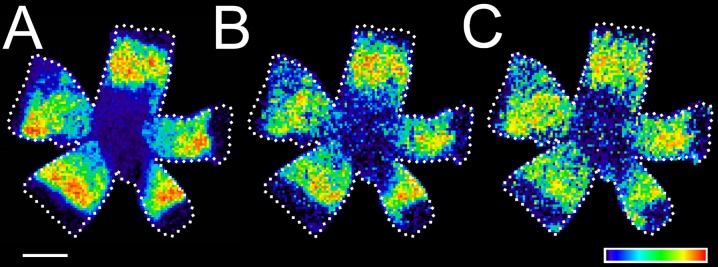
Methods: Lipofuscin fluorescence was imaged in flat-mounted RPE from human donors of various ages. The spatial distributions of A2E and its oxides were determined using matrix-assisted laser desorption-ionization imaging mass spectrometry (MALDI-IMS) on flat-mounted RPE tissue sections and retinal cross-sections.

Results: Our data support the clinical observations of strong RPE fluorescence, increasing with age, in the central area of the RPE. However, there was no correlation between the distribution of A2E and lipofuscin, as the levels of A2E were highest in the far periphery and decreased toward the central region. High-resolution MALDI-IMS of retinal cross-sections confirmed the A2E localization data obtained in RPE flat-mounts. Singly- and doubly-oxidized A2E had distributions similar to A2E, but represented <10% of the A2E levels.

Conclusions: This report to our knowledge is the first description of the spatial distribution of A2E in the human RPE by imaging mass spectrometry. These data demonstrate that the accumulation of A2E is not responsible for the increase in lipofuscin fluorescence observed in the central RPE with aging.

Keywords: A2E; human; imaging; lipofuscin; mass spectrometry; retinal degeneration; retinoids.


Figures

Figure 1
Figure 1
The spatial distribution of lipofuscin fluorescence in the human eye. Fluorescence images of the entire RPE from 21- (A), 41- (B), and 65-year-old (C) human eyes. The images were recorded with a bioluminescent imaging system with a 575 to 650 nm emission filter (DS red). Fluorescence intensity was coded by a false color scale. The images were oriented: superior (top); inferior (bottom); nasal (right); temporal (left); λexc = 450 to 490 nm (GFP). Scale bar: 1 cm. (D) The measured total intensity of lipofuscin fluorescence (DS red filter) increased with age. The unit is 109 photons/(steradian × cm2 × s).
Figure 2
Figure 2
The spatial distribution of A2E in the human eye. MALDI images of A2E (m/z 592) in flat-mounted RPE from 21- (A), 41- (B), and 62-year-old (C) human eyes. The pixel intensity was proportional to A2E quantity, with the scale normalized to total ion current. The relative amount of the appropriate molecule was coded by a false color scale. The images were oriented: superior, top; inferior, bottom; nasal, right (A, B) or left (C); temporal, left (A, B) or right (C). Scale bar: 1 cm. Comparisons of mass spectra from different areas of the human eye (D). The MALDI spectra in the m/z 580 to 625 range are from the same tissue as in (C) and are shown with the same intensity scale. The graph on the top (black trace) is the average mass spectrum (MALDI profile) from the entire tissue. The lower traces show individual mass spectra from selected points from the periphery (red trace), the center (blue trace), and the ciliary epithelium outside the RPE (green trace) were shown. The peak at m/z 592.5 was identified by tandem mass spectrometry directly from the tissue as A2E and the peak at m/z 616 was identified as heme. Oxidized A2E (singly-oxidized, m/z 608; and doubly-oxidized A2E, m/z 624) also were indicated in the red trace. The locations of the individual spectra are indicated in (C). Scale bar: 5 arbitrary intensity units (D).
Figure 3
Figure 3
A2E detection in retinal cross-sections. Hematoxylin and eosin stain of an 82-year-old eye cup sagittal section (A). In the retina overview, black boxes (14) indicate the regions where the MALDI-IMS data were acquired, spanning from the center (1) to the periphery (4) of the tissue as shown enlarged. Scale bar: 1 mm. (B) MALDI images of m/z 592 (A2E) in the regions (14) indicated in (A), taken from the adjacent section. (A) shows the A2E signal (m/z 592.5) alone (top row) and also superimposed on the histologic images of ([A], bottom row). The images display the distribution of A2E across the breadth of the tissue, normalized to total ion current. The panels are aligned vertically around the location of the RPE.
Figure 4
Figure 4
The spatial distribution of A2E oxides in the human eye. MALDI images of (A) A2E (m/z 592), (B) singly-oxidized A2E (m/z = 608), and (C) doubly-oxidized A2E (m/z = 624) in flat-mounted RPE from a 62-year-old human eye. The pixel intensity was proportional to the quantity of the molecule of interest, with the scale normalized to total ion current. The relative amount of the appropriate molecule was coded by a false color scale, but the intensities of the oxidized A2E images have been enhanced (∼30-fold) to emphasize signal distribution. The images were oriented: superior (top); inferior (bottom); nasal (left); temporal (right). Oxidation states higher than doubly-oxidized A2E were not detected. Scale bar: 1 cm.
Figure 5
Figure 5
The comparison of lipofuscin fluorescence and MALDI images of A2E in human eyes. (A) Cross-section profile of lipofuscin fluorescence and A2E levels in a 63-year-old eye showed lack of distribution correlation. Both quantities were normalized to their maximal values. The cross-section was drawn through the optic nerve head and central areas; λexc = 450 to 490 nm. (B) Lipofuscin and A2E do not colocalize. The left flat-mount showed lipofuscin fluorescence (λexc = 450–490 nm) in an 11-year-old eye. The right flat-mount showed the MALDI image of A2E (m/z 592) in the same eye. Scale bar: 1 cm. The fluorescent micrograph in the inset was from the indicated central area and shows the visible presence of golden-yellow lipofuscin (λexc = 488 nm), while A2E is minimal in the same area. The melanin pigment is seen as the brownish color and the areas where the RPE is transparent show up as green (the color of the underlying collagenous layers). Scale bar: 50 μm.

References

    1. Sparrow JR, Gregory-Roberts E, Yamamoto K, et al. The bisretinoids of retinal pigment epithelium. Prog Retin Eye Res. 2012; 31: 121–135 - PMC - PubMed
    1. Sakai N, Decatur J, Nakanishi K, Eldred GE. Ocular age pigment “A2E”: an unprecedented pyridinium bisretinoid. J Am Chem Soc. 1996; 118: 1559–1560
    1. Delori FC, Dorey CK, Staurenghi G, Arend O, Goger DG, Weiter JJ. In vivo fluorescence of the ocular fundus exhibits retinal pigment epithelium lipofuscin characteristics. Invest Ophthalmol Vis Sci. 1995; 36: 718–729 - PubMed
    1. Feeney L. Lipofuscin and melanin of human retinal pigment epithelium. Fluorescence, enzyme cytochemical, and ultrastructural studies. Invest Ophthalmol Vis Sci. 1978; 17: 583–600 - PubMed
    1. Wing GL, Blanchard GC, Weiter JJ. The topography and age relationship of lipofuscin concentration in the retinal pigment epithelium. Invest Ophthalmol Vis Sci. 1978; 17: 601–607 - PubMed

Publication types

MeSH terms