. 2013 Jun 28;9(6):613-23.
doi: 10.7150/ijbs.6162. Print 2013.

Effects of cigarette smoke extracts on the growth and senescence of skin fibroblasts in vitro

Affiliations

Effects of cigarette smoke extracts on the growth and senescence of skin fibroblasts in vitro

Gao-yun Yang et al. Int J Biol Sci. .

Abstract

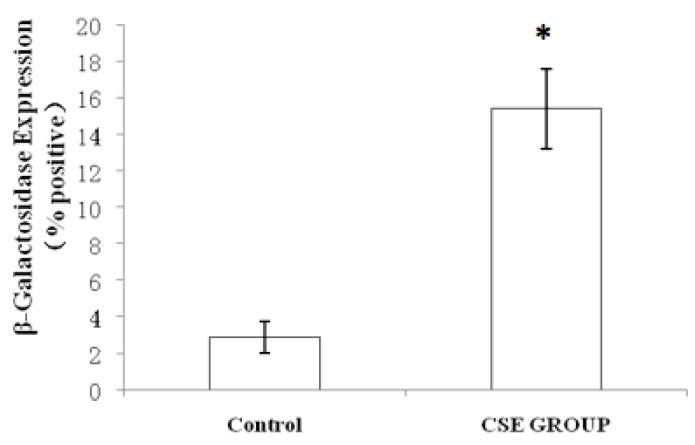
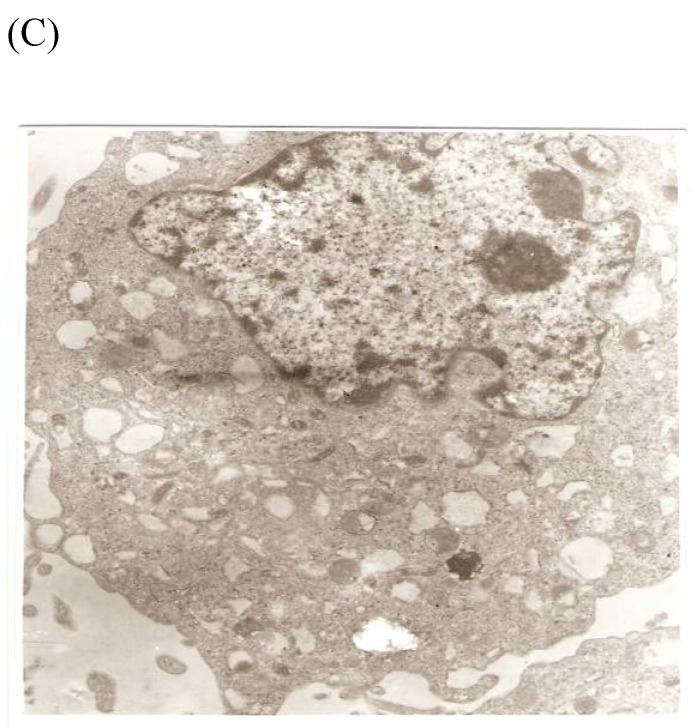
Epidemiological studies have shown that cigarette smoke (CS), a very common environmental factor, plays an important role in skin aging. Although some in vivo studies have suggested that CS affects skin aging, the detailed effects of CS on skin cells in vitro remain largely unknown. In this study, we investigated the effects of cigarette smoke extract (CSE) on the growth, proliferation, and senescene of skin fibroblasts and the possible mechanism underlying these effects. Primary cultured human fibroblasts were exposed to a range of concentrations of CSE. Cell viability and cell proliferation after CSE exposure were analyzed with the methyl thiazolyl tetrazolium (MTT) assay and bromodeoxyuridine incorporation assay, respectively. Growth curves of fibroblasts exposed to different concentrations of CSE were developed and prolonged CSE-exposed cells were observed. Morphological and ultrastructural changes in fibroblasts were assessed by inverted light microscopy and transmission electron microscopy (TEM). Dying cells were stained with senescence-associated β-galactosidase (SA β-gal). Intracellular reactive oxygen species (ROS) levels, superoxide dismutase (SOD) activity, and glutathione peroxidase (GSH-Px) activity were determined by a colorimetric method. We found that proliferative capacity and growth were inhibited by CSE exposure in a dose- and time-dependent manner. Fibroblasts exposed to even low concentrations of CSE for a long period of time (5 passages) showed significantly increased SA β-gal activity and typical features of aging cells. Meanwhile, CSE inhibited superoxide dismutase (SOD) and glutathione peroxidase (GSH-Px) activities and augmented ROS levels. Our observations suggest that CSE exposure impairs fibroblast growth and proliferation and leads to features similar to those seen in senescent cells. Oxidative stress injury and inhibition of antioxidant defense activity may be involved in CSE-induced fibroblast senescence.

Keywords: cigarette smoke extract; growth; senescence; senescence-associated β-galactosidase.; skin fibroblasts.


Conflict of interest statement

Competing Interests: We declare that we have no conflict of interest, in relation to publication of this article.

Figures

Fig 1
Fig 1
CSE effects on fibroblast growth and proliferation. (A) Growth kinetics, as assessed by MTT reduction assay, of cells treated with CSE at 5% (●), 2.5% (×), 1.25% (■), 0.625% (▲), 0.3125%(◆) and 0.15625 %(-) for 2 h, 12 h, 48 h, and 72 h. Data are expressed as means ± SEM. *P < 0.05 for CSE-exposed vs. untreated cells, ANOVA. (B) Dose-response analysis of cells treated with CSE at the indicated concentrations for 12 h. Data are expressed as means ± SEM of three independent experiments, each experiment was performed in quadruplicate. *P < 0.05 vs. untreated cells, ANOVA. (C) BrdU incorporation proliferation assay of fibroblasts exposed to CSE at the indicated concentrations for 12 h. Data are representative of three independent experiments, each performed in quadruplicate. *P < 0.05 vs. unexposed cells, ANOVA.
Fig 1
Fig 1
CSE effects on fibroblast growth and proliferation. (A) Growth kinetics, as assessed by MTT reduction assay, of cells treated with CSE at 5% (●), 2.5% (×), 1.25% (■), 0.625% (▲), 0.3125%(◆) and 0.15625 %(-) for 2 h, 12 h, 48 h, and 72 h. Data are expressed as means ± SEM. *P < 0.05 for CSE-exposed vs. untreated cells, ANOVA. (B) Dose-response analysis of cells treated with CSE at the indicated concentrations for 12 h. Data are expressed as means ± SEM of three independent experiments, each experiment was performed in quadruplicate. *P < 0.05 vs. untreated cells, ANOVA. (C) BrdU incorporation proliferation assay of fibroblasts exposed to CSE at the indicated concentrations for 12 h. Data are representative of three independent experiments, each performed in quadruplicate. *P < 0.05 vs. unexposed cells, ANOVA.
Fig 2
Fig 2
Analysis of CSE exposure on fibroblast growth over time. (A) Growth curves of skin fibroblasts exposed to 10% (●), 7.5% (◆), 5% (■), and 2.5% (▲) CSE and of CSE-unexposed cells(-). Data are expressed as means ± SEM, *P < 0.05 vs. untreated cells, ANOVA). (B) Growth curves of skin fibroblasts exposed to 0.5% CSE for 5 passages (■) and CSE-unexposed cells (◆). Each value represents a mean ± SEM (*P < 0.05 vs. unexposed cells; Student's t-test).
Fig 2
Fig 2
Analysis of CSE exposure on fibroblast growth over time. (A) Growth curves of skin fibroblasts exposed to 10% (●), 7.5% (◆), 5% (■), and 2.5% (▲) CSE and of CSE-unexposed cells(-). Data are expressed as means ± SEM, *P < 0.05 vs. untreated cells, ANOVA). (B) Growth curves of skin fibroblasts exposed to 0.5% CSE for 5 passages (■) and CSE-unexposed cells (◆). Each value represents a mean ± SEM (*P < 0.05 vs. unexposed cells; Student's t-test).
Fig 3
Fig 3
SA β-gal staining of skin fibroblasts at passage 10 after exposure to 0.5% CSE for the first 5 passages. Representative examples are shown for control cells not exposed to CSE (A, B) and for the CSE-exposure group (C, D) (A and C 40×, B and D 100×).
Fig 3
Fig 3
SA β-gal staining of skin fibroblasts at passage 10 after exposure to 0.5% CSE for the first 5 passages. Representative examples are shown for control cells not exposed to CSE (A, B) and for the CSE-exposure group (C, D) (A and C 40×, B and D 100×).
Fig 3
Fig 3
SA β-gal staining of skin fibroblasts at passage 10 after exposure to 0.5% CSE for the first 5 passages. Representative examples are shown for control cells not exposed to CSE (A, B) and for the CSE-exposure group (C, D) (A and C 40×, B and D 100×).
Fig 3
Fig 3
SA β-gal staining of skin fibroblasts at passage 10 after exposure to 0.5% CSE for the first 5 passages. Representative examples are shown for control cells not exposed to CSE (A, B) and for the CSE-exposure group (C, D) (A and C 40×, B and D 100×).
Fig 4
Fig 4
Percentage of SA β-gal stained fibroblasts exposed to 0.5% CSE for 5 passages and fibroblasts not exposed to CSE. Data are expressed as means ± SEM of SAβ gal-positive cells/total cell number for three independent experiments (*P < 0.05 vs. unexposed control group, Student's t-test).
Fig 5
Fig 5
Morphological changes in skin fibroblasts at passage 6 after 1.25% CSE exposure for 24 h. (A-C) Control cells had centrally located, oval shaped nuclei with a radiating and flame-like or whirlpool migrating shape (40×, 100×, 200×). (D-F) The normal radiating, flame-like, and whirlpool migrating shapes were not apparent in the CSE-exposed group. Instead, the exposed cells had flattened and rounded somata with cell blebbing, blunt nuclei, and widened and loosened intracelluar connections (40×, 100×, 200×).
Fig 5
Fig 5
Morphological changes in skin fibroblasts at passage 6 after 1.25% CSE exposure for 24 h. (A-C) Control cells had centrally located, oval shaped nuclei with a radiating and flame-like or whirlpool migrating shape (40×, 100×, 200×). (D-F) The normal radiating, flame-like, and whirlpool migrating shapes were not apparent in the CSE-exposed group. Instead, the exposed cells had flattened and rounded somata with cell blebbing, blunt nuclei, and widened and loosened intracelluar connections (40×, 100×, 200×).
Fig 6
Fig 6
Ulrastructural changes of skin fibroblasts exposed to 1.25% CSE for 24 h. (A, B) The normal ulrastructural features of CES-unexposed skin fibroblasts (5000×, 20000×). (C, D) Ulrastructural changes in CSE-exposed cells characterized by microvilli shedding, nucleolus degeneration, mitochondrial deformity, and the formation of vesicular structures in the cytoplasm.
Fig 6
Fig 6
Ulrastructural changes of skin fibroblasts exposed to 1.25% CSE for 24 h. (A, B) The normal ulrastructural features of CES-unexposed skin fibroblasts (5000×, 20000×). (C, D) Ulrastructural changes in CSE-exposed cells characterized by microvilli shedding, nucleolus degeneration, mitochondrial deformity, and the formation of vesicular structures in the cytoplasm.
Fig 7
Fig 7
Effects of CSE on ROS production in mitochondria. CSE dose-dependent increase in ROS-mediated conversion of DCFH to fluorescent DCF in H2DCF-DA-loaded isolated mitochondria incubated with the indicated concentrations of CSE. DCF fluorescence intensity is a relative index of ROS levels. The excitation and emission wave lengths were 499 nm and 525 nm, respectively. Data are means + SEM, n = 4. *p < 0.05 vs. control group, ANOVA.
Fig 8
Fig 8
Dose-dependent effects of CSE (at indicated concentrations) on SOD and GSH-Px activities in skin fibroblasts. Data are expressed as means ± SEM for three independent experiments; n = 4.* p< 0.05 vs. control group.

Similar articles

Cited by

References

    1. Pattison DI, Davies MJ. Actions of ultraviolet light on cellular structures. EXS. 2006;96:131–157. - PubMed
    1. Huang XX, Bernerd F, Halliday GM. Ultraviolet A within sunlight induces mutations in the epidermal basal layer of engineered human skin. Am. J. Pathol. 2009;174:1534–1543. - PMC - PubMed
    1. Rass K, Reichrath J. UV damage and DNA repair in malignant melanoma and nonmelanoma skin cancer. Adv Exp Med Biol. 2008;624:162–178. - PubMed
    1. Freiman A, Bird G, Metelitsa AI. et al. Cutaneous effects of smoking. J Cutan Med Surg. 2004;8(6):415–423. - PubMed
    1. Model D. Smokers' faces: who are the smokers? Br. Med. J. 1985;291:1760–62. - PMC - PubMed

Publication types