

Identification of subpopulations of prairie voles differentially susceptible to peer influence to decrease high alcohol intake
- PMID: 23847535
- PMCID: PMC3701123
- DOI: 10.3389/fphar.2013.00084
Identification of subpopulations of prairie voles differentially susceptible to peer influence to decrease high alcohol intake
Abstract
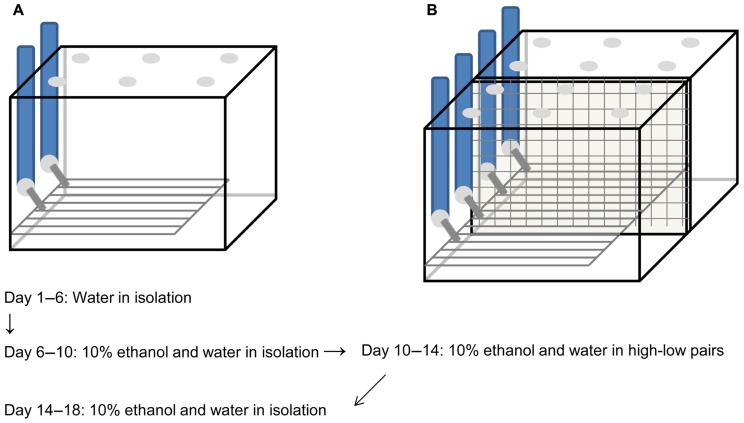
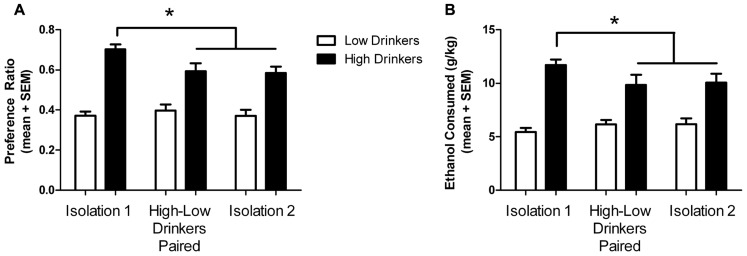
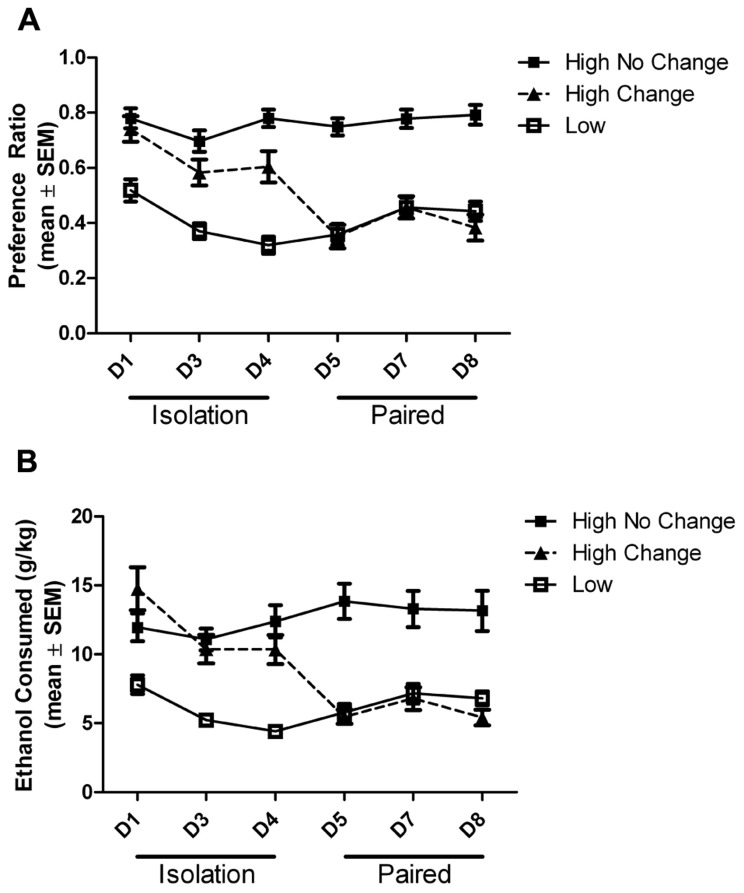
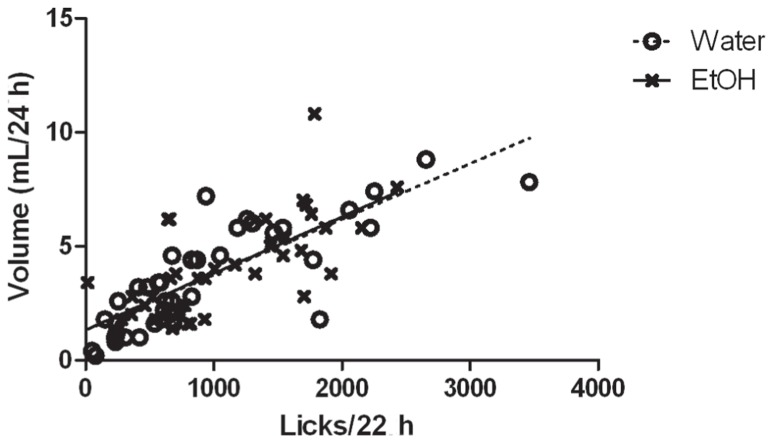
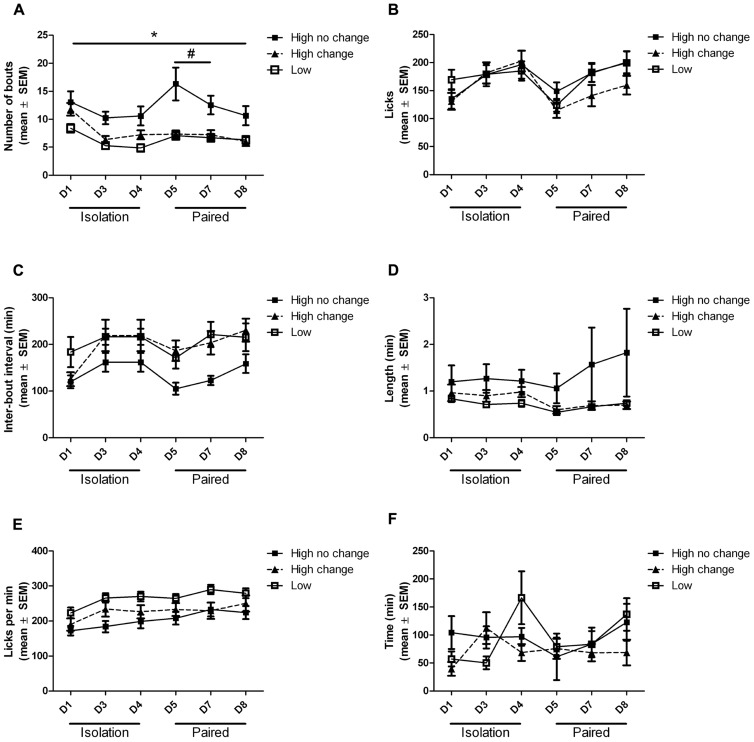
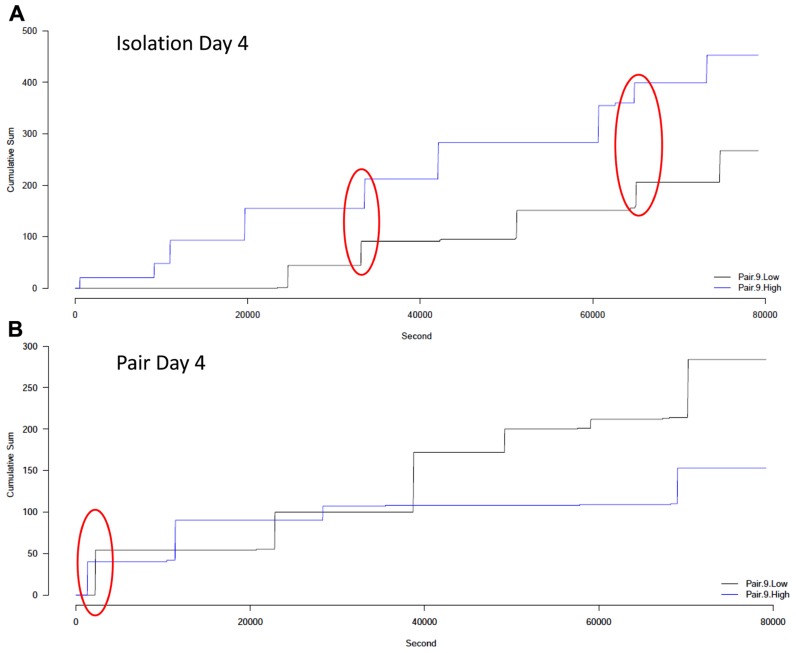
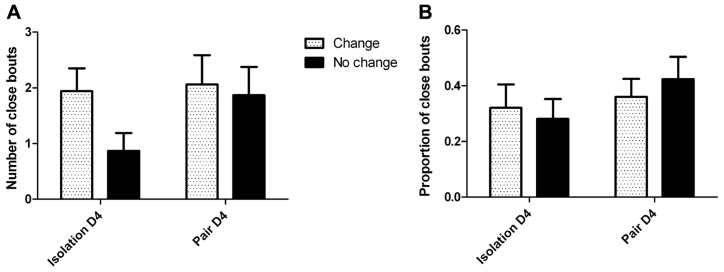
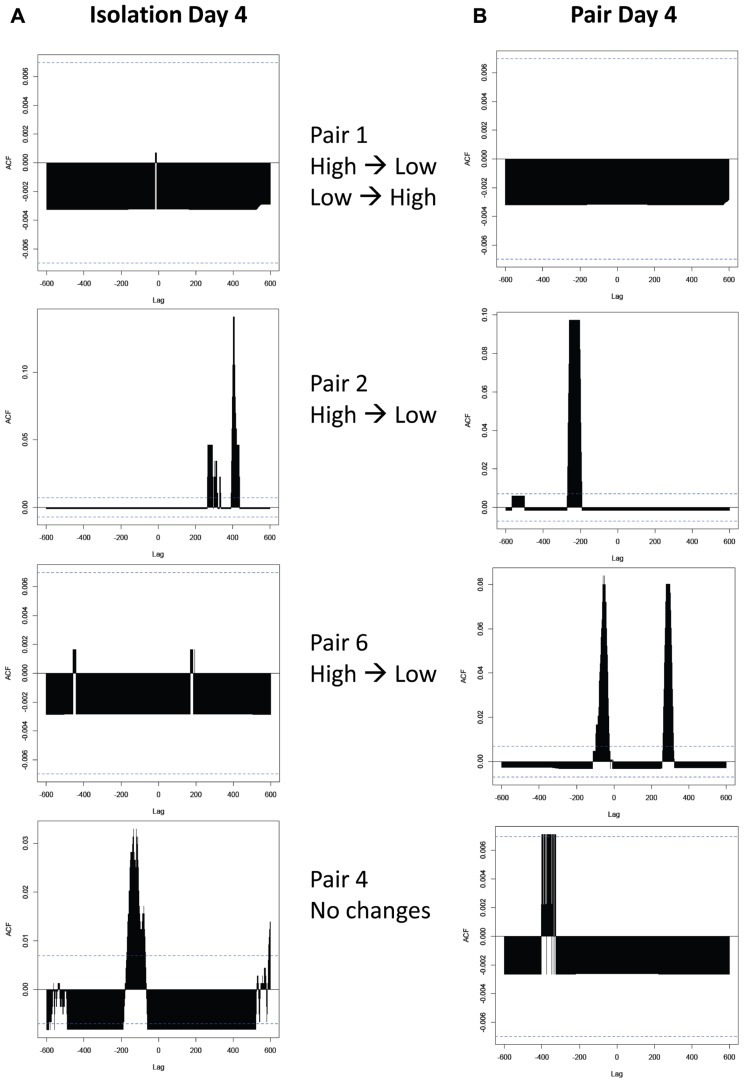
Peer influences are critical in the decrease of alcohol (ethanol) abuse and maintenance of abstinence. We previously developed an animal model of inhibitory peer influences on ethanol drinking using prairie voles and here sought to understand whether this influential behavior was due to specific changes in drinking patterns and to variation in a microsatellite sequence in the regulatory region of the vasopressin receptor 1a gene (avpr1a). Adult prairie voles' drinking patterns were monitored in a lickometer apparatus that recorded each lick a subject exhibited during continuous access to water and 10% ethanol during periods of isolation, pair housing of high and low drinkers, and subsequent isolation. Analysis of fluid consumption confirmed previous results that high drinkers typically decrease ethanol intake when paired with low drinkers, but that a subset of voles do not decrease. Analysis of bout structure revealed differences in the number of ethanol drinking bouts in the subpopulations of high drinkers when paired with low drinkers. Lickometer drinking patterns analyzed by visual and by cross-correlation analyses demonstrated that pair housing did not increase the rate of subjects drinking in bouts occurring at the same time. The length of the avpr1a microsatellite did not predict susceptibility to peer influence or any other drinking behaviors. In summary, subpopulations of high drinkers were identified, by fluid intake and number of drinking bouts, which did or did not lower their ethanol intake when paired with a low drinking peer, and these subpopulations should be explored for testing the efficacy of treatments to decrease ethanol use in groups that are likely to be responsive to different types of therapy.
Keywords: alcohol; ethanol; genetics; peer pressure; prairie vole; regulatory microsatellite; social behavior; vasopressin.
Figures
Similar articles
-
Alcohol intake in prairie voles is influenced by the drinking level of a peer.Alcohol Clin Exp Res. 2011 Oct;35(10):1884-90. doi: 10.1111/j.1530-0277.2011.01533.x. Epub 2011 May 16. Alcohol Clin Exp Res. 2011. PMID: 21575019 Free PMC article.
-
Social housing and alcohol drinking in male-female pairs of prairie voles (Microtus ochrogaster).Psychopharmacology (Berl). 2012 Nov;224(1):121-32. doi: 10.1007/s00213-012-2836-4. Epub 2012 Aug 18. Psychopharmacology (Berl). 2012. PMID: 22903359 Free PMC article.
-
The role of early life experience and species differences in alcohol intake in microtine rodents.PLoS One. 2012;7(6):e39753. doi: 10.1371/journal.pone.0039753. Epub 2012 Jun 22. PLoS One. 2012. PMID: 22745824 Free PMC article.
-
Biological contribution to social influences on alcohol drinking: evidence from animal models.Int J Environ Res Public Health. 2010 Feb;7(2):473-93. doi: 10.3390/ijerph7020473. Epub 2010 Feb 11. Int J Environ Res Public Health. 2010. PMID: 20616986 Free PMC article. Review.
-
Prairie Voles as a Model to Screen Medications for the Treatment of Alcoholism and Addictions.Int Rev Neurobiol. 2016;126:403-21. doi: 10.1016/bs.irn.2016.02.019. Epub 2016 Mar 21. Int Rev Neurobiol. 2016. PMID: 27055620 Review.
Cited by
-
Effects of social housing on alcohol intake in mice depend on the non-social environment.Front Behav Neurosci. 2024 May 16;18:1380031. doi: 10.3389/fnbeh.2024.1380031. eCollection 2024. Front Behav Neurosci. 2024. PMID: 38817806 Free PMC article.
-
Animal models of social contact and drug self-administration.Pharmacol Biochem Behav. 2015 Sep;136:47-54. doi: 10.1016/j.pbb.2015.06.013. Epub 2015 Jul 6. Pharmacol Biochem Behav. 2015. PMID: 26159089 Free PMC article. Review.
-
Biparental care in C57BL/6J mice: effects on adolescent behavior and alcohol consumption.Psychopharmacology (Berl). 2020 Jun;237(6):1841-1850. doi: 10.1007/s00213-020-05501-3. Epub 2020 Mar 16. Psychopharmacology (Berl). 2020. PMID: 32173769
-
Establishment of stable dominance interactions in prairie vole peers: relationships with alcohol drinking and activation of the paraventricular nucleus of the hypothalamus.Soc Neurosci. 2014;9(5):484-94. doi: 10.1080/17470919.2014.931885. Epub 2014 Jun 25. Soc Neurosci. 2014. PMID: 24963825 Free PMC article.
-
A Neuroscientist's Guide to the Vole.Curr Protoc. 2021 Jun;1(6):e175. doi: 10.1002/cpz1.175. Curr Protoc. 2021. PMID: 34170636 Free PMC article.
References
-
- Bond J., Kaskutas L. A., Weisner C. (2003) The persistent influence of social networks and alcoholics anonymous on abstinence. J. Stud. Alcohol 64 579 –588 - PubMed
Grants and funding
LinkOut - more resources
Full Text Sources
Other Literature Sources