

In vitro measurements of physiological glucose concentrations in biological fluids using mid-infrared light
- PMID: 23847734
- PMCID: PMC3704090
- DOI: 10.1364/BOE.4.001083
In vitro measurements of physiological glucose concentrations in biological fluids using mid-infrared light
Abstract
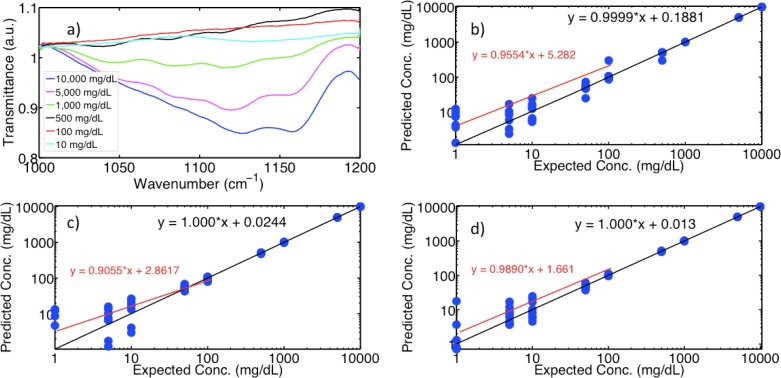
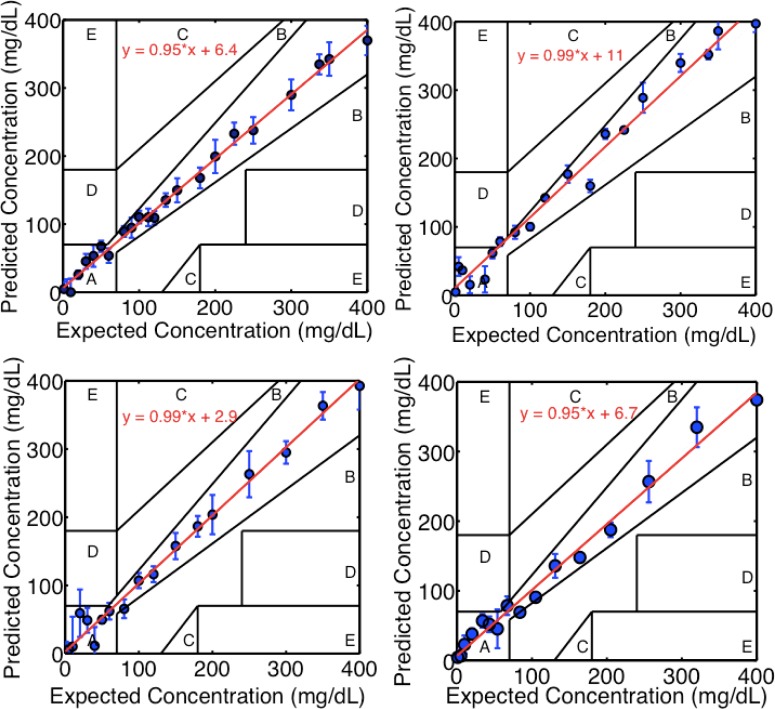
Mid-infrared transmission spectroscopy using broadband mid-infrared or Quantum Cascade laser sources is used to predict glucose concentrations of aqueous and serum solutions containing physiologically relevant amounts of glucose (50-400 mg/dL). We employ partial least squares regression to generate a calibration model using a subset of the spectra taken and to predict concentrations from new spectra. Clinically accurate measurements with respect to a Clarke error grid were made for concentrations as low as 30 mg/dL, regardless of background solvent. These results are an important and encouraging step in the work towards developing a noninvasive in vivo glucose sensor in the mid-infrared.
Keywords: (170.1470) Blood or tissue constituent monitoring; (300.1030) Absorption; (300.6340) Spectroscopy, infrared.
Figures
References
-
- World Health Organization facts, http://www.who.int/mediacentre/factsheets/fs312/en/index.html.
-
- Khalil O. S., “Spectroscopic and clinical aspects of noninvasive glucose measurements,” Clin. Chem. 45(2), 165–177 (1999). - PubMed
-
- V. Tuchin, Handbook of Optical Sensing of Glucose in Biological Fluids and Tissues (CRC, 2009).
-
- Marbach R., “A new method for multivariate calibration,” J. Near Infrared Spectrosc. 13(1), 241–254 (2005). 10.1255/jnirs.555 - DOI
LinkOut - more resources
Full Text Sources
Other Literature Sources