

Genetic programming-based approach to elucidate biochemical interaction networks from data
- PMID: 23848052
- PMCID: PMC8687365
- DOI: 10.1049/iet-syb.2012.0011
Genetic programming-based approach to elucidate biochemical interaction networks from data
Abstract
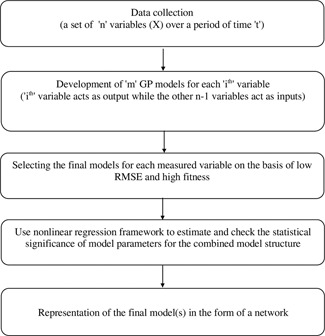
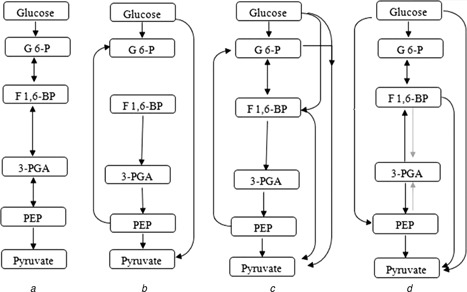
Biochemical systems are characterised by cyclic/reversible reciprocal actions, non-linear interactions and a mixed relationship structures (linear and non-linear; static and dynamic). Deciphering the architecture of such systems using measured data to provide quantitative information regarding the nature of relationships that exist between the measured variables is a challenging proposition. Causality detection is one of the methodologies that are applied to elucidate biochemical networks from such data. Autoregressive-based modelling approach such as granger causality, partial directed coherence, directed transfer function and canonical variate analysis have been applied on different systems for deciphering such interactions, but with limited success. In this study, the authors propose a genetic programming-based causality detection (GPCD) methodology which blends evolutionary computation-based procedures along with parameter estimation methods to derive a mathematical model of the system. Application of the GPCD methodology on five data sets that contained the different challenges mentioned above indicated that GPCD performs better than the other methods in uncovering the exact structure with less false positives. On a glycolysis data set, GPCD was able to fill the 'interaction gaps' which were missed by other methods.
Figures
Similar articles
-
Alignment and integration of complex networks by hypergraph-based spectral clustering.Phys Rev E Stat Nonlin Soft Matter Phys. 2012 Nov;86(5 Pt 2):056111. doi: 10.1103/PhysRevE.86.056111. Epub 2012 Nov 26. Phys Rev E Stat Nonlin Soft Matter Phys. 2012. PMID: 23214847
-
Detection of local community structures in complex dynamic networks with random walks.IET Syst Biol. 2009 Jul;3(4):266-78. doi: 10.1049/iet-syb.2007.0061. IET Syst Biol. 2009. PMID: 19640165
-
Uncovering interactions in the frequency domain.PLoS Comput Biol. 2008 May 30;4(5):e1000087. doi: 10.1371/journal.pcbi.1000087. PLoS Comput Biol. 2008. PMID: 18516243 Free PMC article. Review.
-
ProtNet: a tool for stochastic simulations of protein interaction networks dynamics.BMC Bioinformatics. 2007 Mar 8;8 Suppl 1(Suppl 1):S4. doi: 10.1186/1471-2105-8-S1-S4. BMC Bioinformatics. 2007. PMID: 17430571 Free PMC article.
-
The application of flux balance analysis in systems biology.Wiley Interdiscip Rev Syst Biol Med. 2010 May-Jun;2(3):372-382. doi: 10.1002/wsbm.60. Wiley Interdiscip Rev Syst Biol Med. 2010. PMID: 20836035 Review.
References
-
- Adams S.M., Ham K.D., and Beauchamp J.J.: ‘Application of canonical variate analysis in the evaluation and presentation of multivariate biological response data’, Environ. Toxicology Chem., 1994, 13, (10), pp. 1673–1683 (doi: 10.1002/etc.5620131018) - DOI
Publication types
MeSH terms
Substances
LinkOut - more resources
Full Text Sources
Other Literature Sources
