

Cooperative unfolding of compact conformations of the intrinsically disordered protein osteopontin
- PMID: 23848319
- PMCID: PMC3737600
- DOI: 10.1021/bi400502c
Cooperative unfolding of compact conformations of the intrinsically disordered protein osteopontin
Abstract
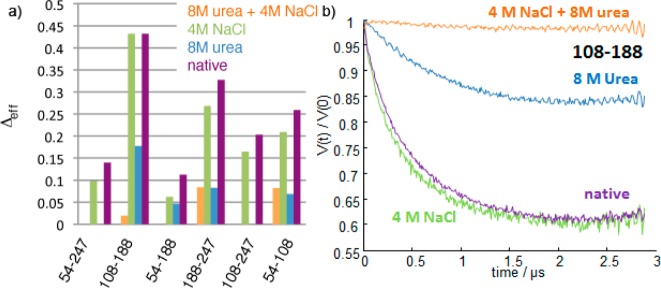
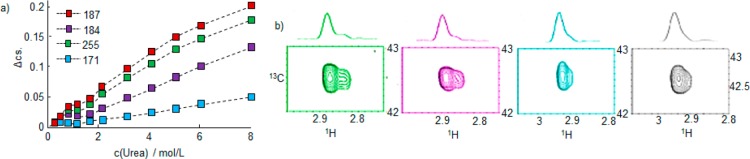
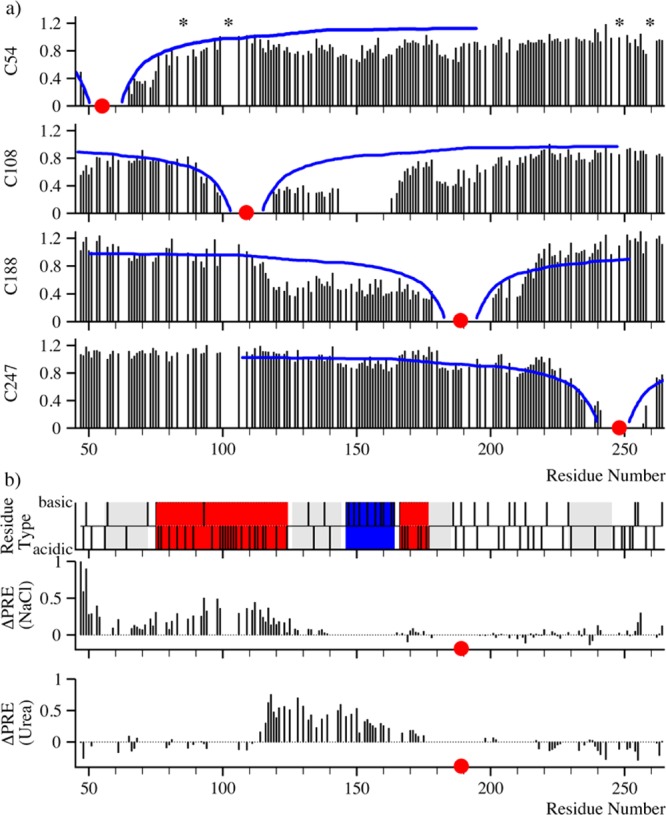
Intrinsically disordered proteins (IDPs) constitute a class of biologically active proteins that lack defined tertiary and often secondary structure. The IDP Osteopontin (OPN), a cytokine involved in metastasis of several types of cancer, is shown to simultaneously sample extended, random coil-like conformations and stable, cooperatively folded conformations. By a combination of two magnetic resonance methods, electron paramagnetic resonance and nuclear magnetic resonance spectroscopy, we demonstrate that the OPN ensemble exhibits not only characteristics of an extended and flexible polypeptide, as expected for an IDP, but also simultaneously those of globular proteins, in particular sigmoidal structural denaturation profiles. Both types of states, extended and cooperatively folded, are populated simultaneously by OPN in its apo state. The heterogeneity of the structural properties of IDPs is thus shown to even involve cooperative folding and unfolding events.
Figures
Similar articles
-
The metastasis-associated extracellular matrix protein osteopontin forms transient structure in ligand interaction sites.Biochemistry. 2011 Jul 12;50(27):6113-24. doi: 10.1021/bi200291e. Epub 2011 Jun 16. Biochemistry. 2011. PMID: 21609000
-
The Ambivalent Role of Proline Residues in an Intrinsically Disordered Protein: From Disorder Promoters to Compaction Facilitators.J Mol Biol. 2020 Apr 17;432(9):3093-3111. doi: 10.1016/j.jmb.2019.11.015. Epub 2019 Nov 30. J Mol Biol. 2020. PMID: 31794728
-
Hyperphosphorylation of Human Osteopontin and Its Impact on Structural Dynamics and Molecular Recognition.Biochemistry. 2021 May 4;60(17):1347-1355. doi: 10.1021/acs.biochem.1c00050. Epub 2021 Apr 20. Biochemistry. 2021. PMID: 33876640 Free PMC article.
-
Structural characterization of intrinsically disordered proteins by NMR spectroscopy.Molecules. 2013 Sep 4;18(9):10802-28. doi: 10.3390/molecules180910802. Molecules. 2013. PMID: 24008243 Free PMC article. Review.
-
Novel methods based on (13)C detection to study intrinsically disordered proteins.J Magn Reson. 2014 Apr;241:115-25. doi: 10.1016/j.jmr.2013.10.020. J Magn Reson. 2014. PMID: 24656084 Review.
Cited by
-
Osteopontin regulates biomimetic calcium phosphate crystallization from disordered mineral layers covering apatite crystallites.Sci Rep. 2020 Sep 24;10(1):15722. doi: 10.1038/s41598-020-72786-x. Sci Rep. 2020. PMID: 32973201 Free PMC article.
-
Role of osteopontin in the pathophysiology of cancer.Matrix Biol. 2014 Jul;37:131-41. doi: 10.1016/j.matbio.2014.03.001. Epub 2014 Mar 19. Matrix Biol. 2014. PMID: 24657887 Free PMC article. Review.
-
Dynamic footprint of sequestration in the molecular fluctuations of osteopontin.J R Soc Interface. 2015 Sep 6;12(110):0506. doi: 10.1098/rsif.2015.0506. J R Soc Interface. 2015. PMID: 26354827 Free PMC article.
-
Biochemical and Structural Characterization of the Interaction between the Siderocalin NGAL/LCN2 (Neutrophil Gelatinase-associated Lipocalin/Lipocalin 2) and the N-terminal Domain of Its Endocytic Receptor SLC22A17.J Biol Chem. 2016 Feb 5;291(6):2917-30. doi: 10.1074/jbc.M115.685644. Epub 2015 Dec 3. J Biol Chem. 2016. PMID: 26635366 Free PMC article.
-
Candidate Biomarkers of Liver Fibrosis: A Concise, Pathophysiology-oriented Review.J Clin Transl Hepatol. 2018 Sep 28;6(3):317-325. doi: 10.14218/JCTH.2018.00006. Epub 2018 Jul 2. J Clin Transl Hepatol. 2018. PMID: 30271745 Free PMC article. Review.
References
-
- Dunker A. K.; Obradovic Z. (2001) The protein trinity: Linking function and disorder. Nat. Biotechnol. 19, 805–806. - PubMed
-
- Tompa P. (2002) Intrinsically unstructured proteins. Trends Biochem. Sci. 27, 527–533. - PubMed
-
- Uversky V. N. (2011) Intrinsically disordered proteins from A to Z. Int. J. Biochem. Cell Biol. 43, 1090–1103. - PubMed
-
- Konrat R. (2010) The meandering of disordered proteins in conformational space. Structure 18, 416–149. - PubMed
Publication types
MeSH terms
Substances
Grants and funding
LinkOut - more resources
Full Text Sources
Other Literature Sources
Research Materials
