. 2012 Dec 1;1(1):13.
doi: 10.1186/2046-7648-1-13.

Participation and performance trends in multistage ultramarathons-the 'Marathon des Sables' 2003-2012

Affiliations

Participation and performance trends in multistage ultramarathons-the 'Marathon des Sables' 2003-2012

Christoph Knoth et al. Extrem Physiol Med. .

Abstract

Background: The purpose of this study was to investigate participation and performance changes in the multistage ultramarathon 'Marathon des Sables' from 2003 to 2012.

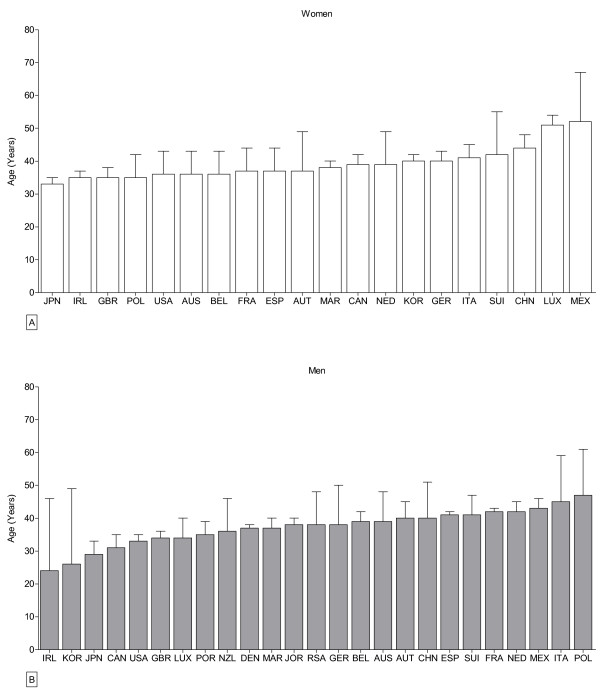
Methods: Participation and performance trends in the four- or six-stage running event covering approximately 250 km were analyzed with special emphasis on the nationality and age of the athletes. The relations between gender, age, and nationality of finishers and performance were investigated using regression analyses and analysis of variance.

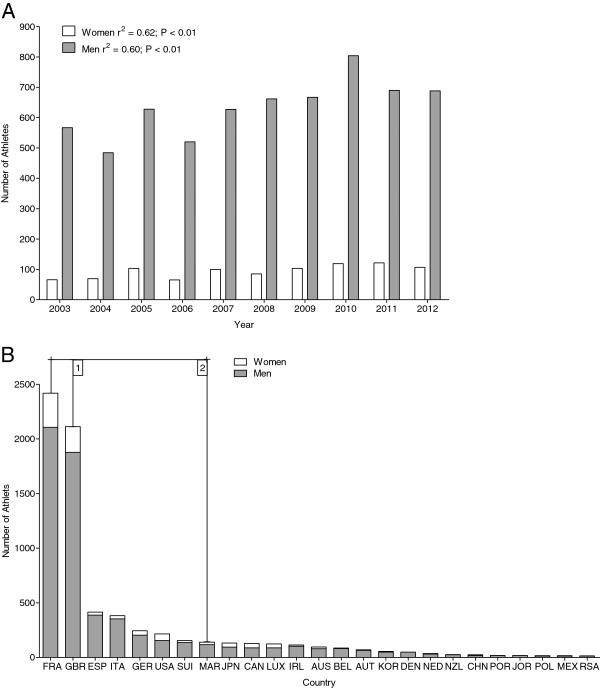
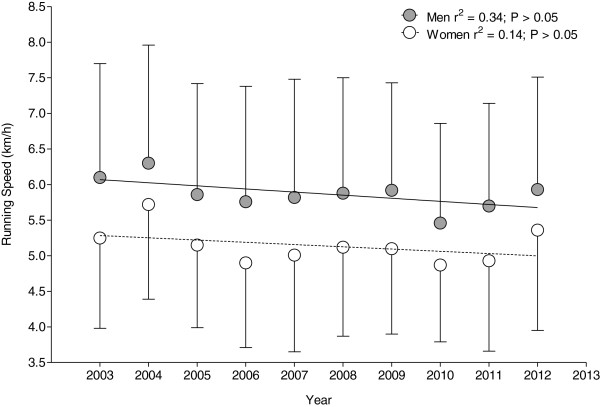
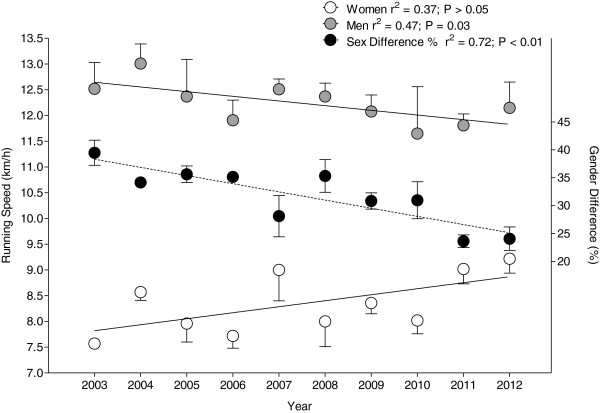
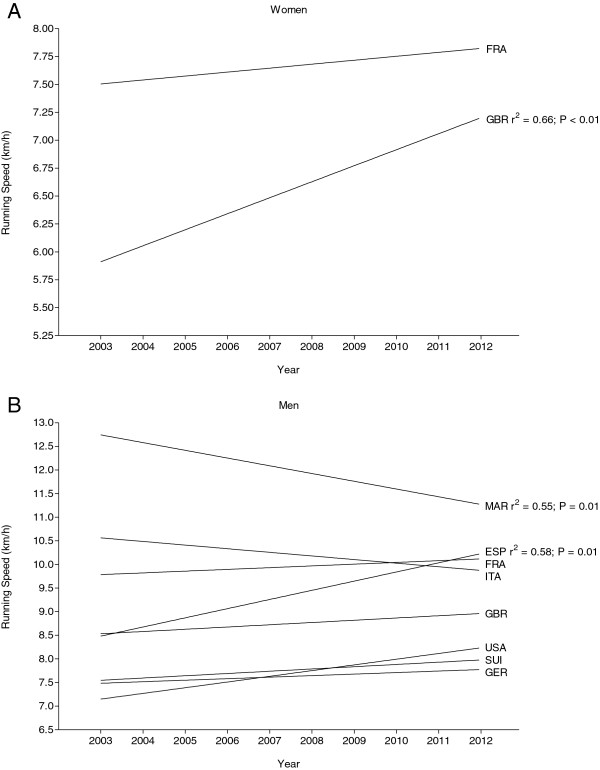
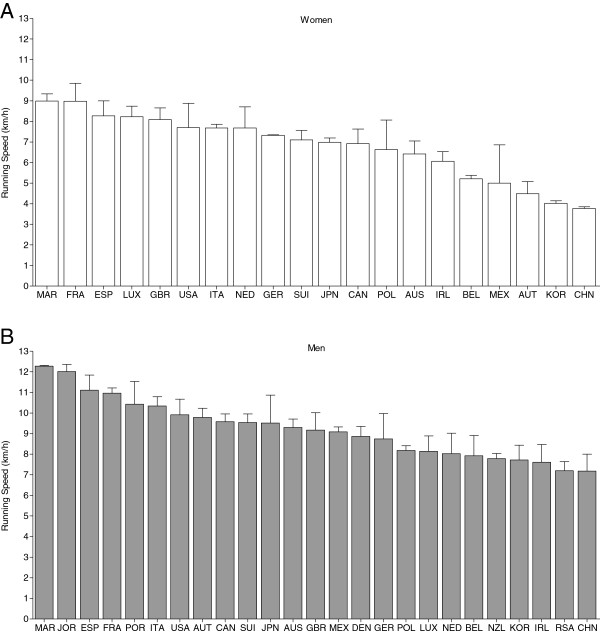
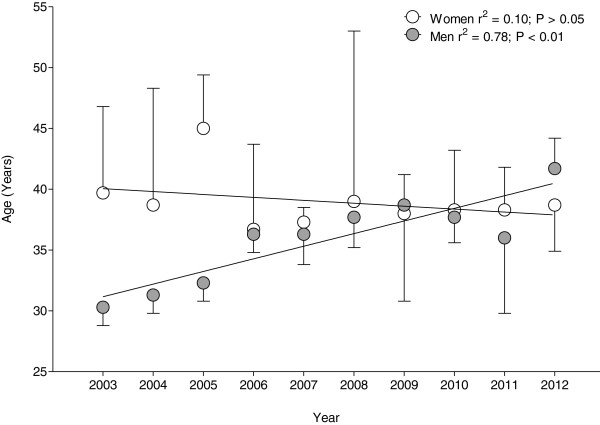
Results: Between 2003 and 2012, a number of 7,275 athletes with 938 women (12.9%) and 6,337 men (87.1%) finished the Marathon des Sables. The finisher rate in both women (r2 = 0.62) and men (r2 = 0.60) increased across years (p < 0.01). Men were significantly (p < 0.01) faster than women for overall finishers (5.9 ± 1.6 km·h-1 versus 5.1 ± 1.3 km·h-1) and for the top three finishers (12.2 ± 0.4 km·h-1 versus 8.3 ± 0.6 km·h-1). The gender difference in running speed of the top three athletes decreased (r2 = 0.72; p < 0.01) from 39.5% in 2003 to 24.1% in 2012 with a mean gender difference of 31.7 ± 2.0%. In men, Moroccans won nine of ten competitions, and one edition was won by a Jordanian athlete. In women, eight races were won by Europeans (France five, Luxembourg two, and Spain one, respectively), and two events were won by Moroccan runners.

Conclusions: The finisher rate in the Marathon des Sables increased this last decade. Men were significantly faster than women with a higher gender difference in performance compared to previous reports. Social or cultural inhibitions may determine the outcome in this event. Future studies need to investigate participation trends regarding nationalities and socioeconomic background, as well as the motivation to compete in ultramarathons.


Figures

Figure 1
Figure 1
Total number of male and female finishers (A) and number of female and male finishers in the Marathon des Sables per country (B). Countries providing five or more finishers per year and gender are indicated with 1 for women and with 2 for men, respectively. The frame indicates the 25 countries with the total highest number of finishers including women and men. FRA France, GBR Great Britain, ESP Spain, ITA Italy, GER Germany, USA United States of America, SUI Switzerland, MAR Morocco, JPN Japan, CAN Canada, LUX Luxembourg, IRL Ireland, AUS Australia, BEL Belgium, AUT Austria, KOR Korea, DEN Denmark, NED Netherlands, NZL New Zealand, CHN China, POR Portugal, JOR Jordan, POL Poland, MEX Mexico, RSA Republic of South Africa.
Figure 2
Figure 2
Annual running speed for women and men overall.
Figure 3
Figure 3
Change in running speed of the annual top three women and annual top three men and gender difference in performance across years.
Figure 4
Figure 4
Change in running speed in the annual top three athletes per nation during the 2003–2012 time period for women (A) and men (B).FRA France, GBR Great Britain, ESP Spain, ITA Italy, MAR Morocco. In case of a significant change in running speed over time, r2 and as p value are inserted.
Figure 5
Figure 5
Running speed of the overall top three female (A) and male (B) athletes per country. The frame indicates the 25 countries with the total (women and men) highest number of finishers. FRA France, GBR Great Britain, ESP Spain, ITA Italy, JOR Jordan, GER Germany, USA United States of America, SUI Switzerland, MAR Morocco, JPN Japan, CAN Canada, LUX Luxembourg, IRL Ireland, AUS Australia, BEL Belgium, AUT Austria, KOR Korea, DEN Denmark, NED Netherlands, NZL New Zealand, CHN China, POR Portugal, POL Poland, MEX Mexico, RSA Republic of South Africa.
Figure 6
Figure 6
Age of the overall top three female (A) and male athletes (B) per country. FRA France, GBR Great Britain, ESP Spain, ITA Italy, GER Germany, USA United States of America, SUI Switzerland, MAR Morocco, JPN Japan, JOR Jordan, CAN Canada, LUX Luxembourg, IRL Ireland, AUS Australia, BEL Belgium, AUT Austria, KOR Korea, DEN Denmark, NED Netherlands, NZL New Zealand, CHN China, POR Portugal, POL Poland, MEX Mexico, RSA Republic of South Africa.
Figure 7
Figure 7
Change in the age of peak performance of the annual top three women and men across years.

References

    1. Hoffman MD, Ong JC, Wang G. Historical analysis of participation in 161 km ultramarathons in North America. Int J Hist Sport. 2010;27:1877–1891. doi: 10.1080/09523367.2010.494385. - DOI - PubMed
    1. Hoffman MD, Wegelin JA. The Western States 100-Mile Endurance Run: participation and performance trends. Med Sci Sports Exerc. 2009;41:2191–2198. doi: 10.1249/MSS.0b013e3181a8d553. - DOI - PMC - PubMed
    1. Lepers R, Cattagni T. Do older athletes reach limits in their performance during marathon running? Age (Dordr) 2012;34:773–781. doi: 10.1007/s11357-011-9271-z. - DOI - PMC - PubMed
    1. Lepers R. Analysis of Hawaii ironman performances in elite triathletes from 1981 to 2007. Med Sci Sports Exerc. 2008;40:1828–1834. doi: 10.1249/MSS.0b013e31817e91a4. - DOI - PubMed
    1. Knechtle B, Knechtle P, Lepers R. Participation and performance trends in ultra-triathlons from 1985 to 2009. Scand J Med Sci Sports. 2011;21:e82–e90. doi: 10.1111/j.1600-0838.2010.01160.x. - DOI - PubMed

LinkOut - more resources