

Dehydration parameters and standards for laboratory mice
- PMID: 23849404
- PMCID: PMC3690443
Dehydration parameters and standards for laboratory mice
Abstract
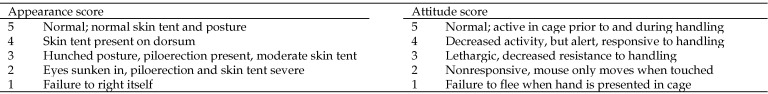
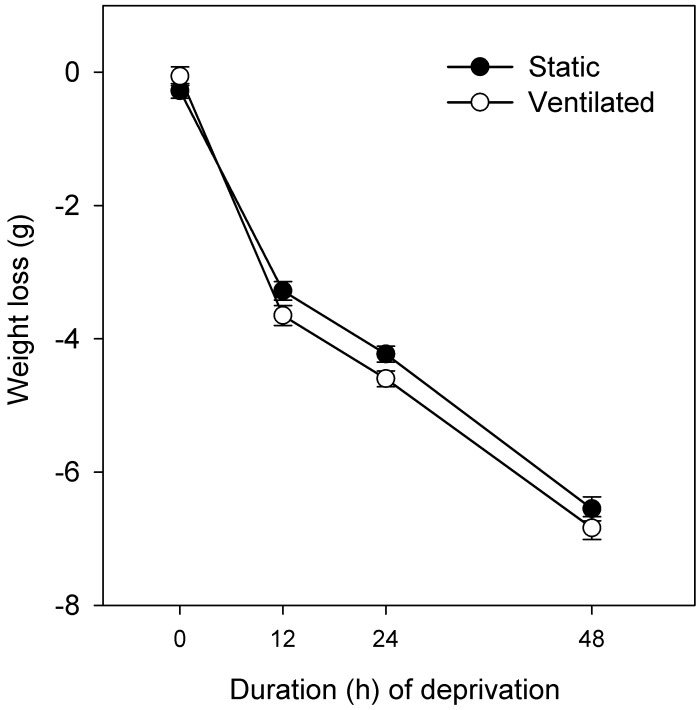
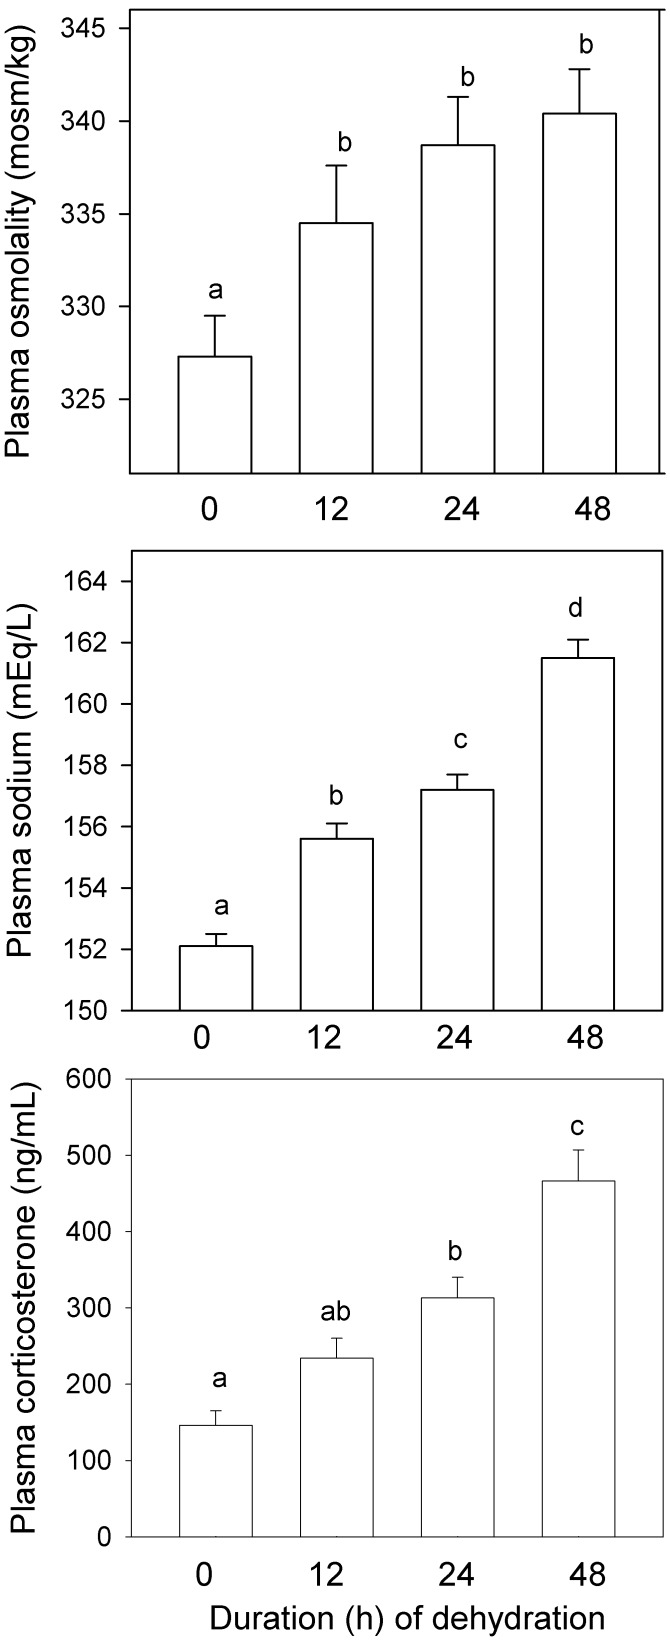
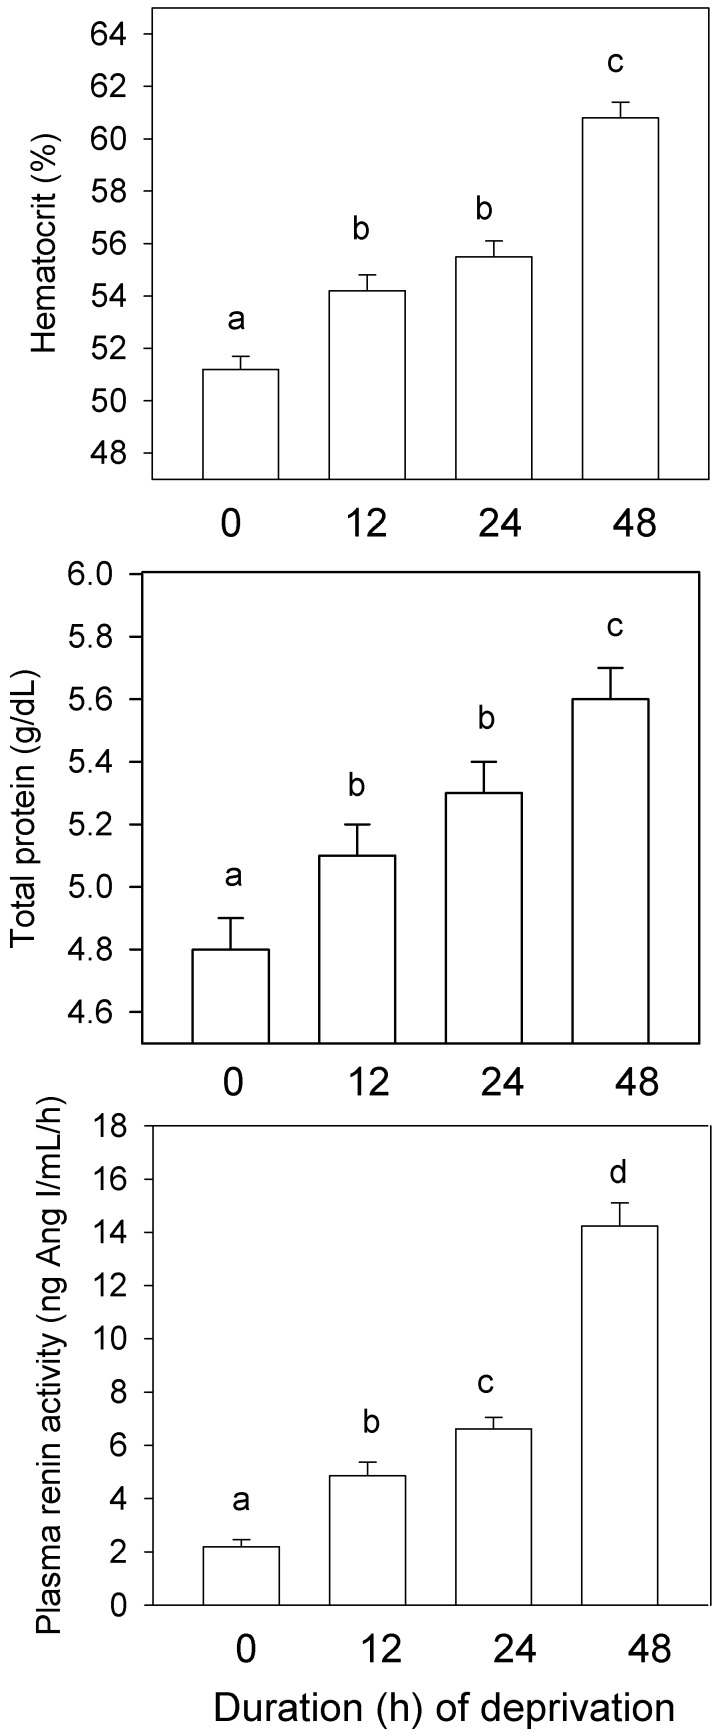
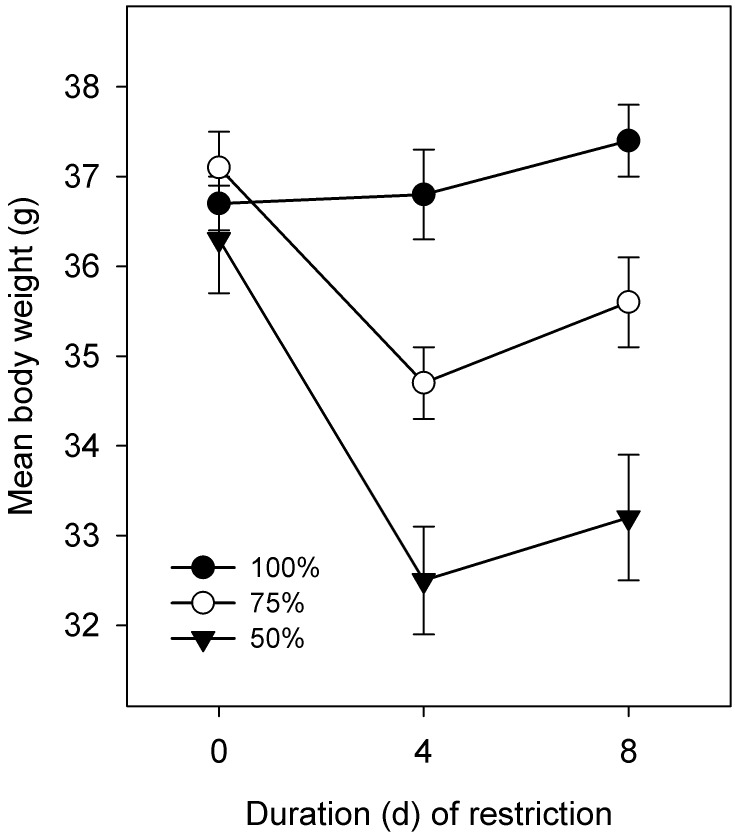
Water deprivation and restriction are common features of many physiologic and behavioral studies; however, there are no data-driven humane standards regarding mice on water deprivation or restriction studies to guide IACUC, investigators, and veterinarians. Here we acutely deprived outbred CD1 mice of water for as long as 48 h or restricted them to a 75% or 50% water ration; physical and physiologic indicators of dehydration were measured. With acute water deprivation, the appearance and attitude of mice deteriorated after 24 h, and weight loss exceeded 15%. Plasma osmolality was increased, and plasma volume decreased with each time interval. Plasma corticosterone concentration increased with duration of deprivation. There were no differences in any dehydration measures between mice housed in conventional static cages or ventilated racks. Chronic water restriction induced no significant changes compared with ad libitum availability. We conclude that acute water deprivation of as long as 24 h produces robust physiologic changes; however, deprivation in excess of 24 h is not recommended in light of apparent animal distress. Although clearly thirsty, mice adapt to chronic water restriction of as much as 50% of the ad libitum daily ration that is imposed over an interval of as long as 8 d.
Figures
References
-
- Armstrong S, Grahame C, Singer G. 1980. Food and water deprivation: changes in rat feeding, drinking, activity, and body weight. Neurosci Biobehav Rev 4:377–402 - PubMed
-
- Bealer S, Crofton J, Share L.1983. Hypothalmic knife cuts alter fluid regulation, vasopressin secretion, and natriruresis during water deprivation. Neuroendocrinology 36: 364–370. - PubMed
-
- Fitzsimons JT. 1998. Angiotensin, thirst, and sodium appetite. Physiol Rev 78:583–686 - PubMed
-
- Haines H, Shield C. 1971. Reduced evaporation in house mice (Mus musculus) acclimated to water restriction. Comp Biochem Physiol A Comp Physiol 39:53–61 - PubMed
-
- Hamilton L, Flaherty C. 1973. Interactive effects of deprivation in the albino rat. Learn Motiv 4:148–162
Publication types
MeSH terms
Substances
LinkOut - more resources
Full Text Sources