

A comparison between the 2010 and 2005 basic life support guidelines during simulated hypogravity and microgravity
- PMID: 23849595
- PMCID: PMC3710155
- DOI: 10.1186/2046-7648-2-11
A comparison between the 2010 and 2005 basic life support guidelines during simulated hypogravity and microgravity
Abstract
Background: Current 2010 terrestrial (1Gz) CPR guidelines have been advocated by space agencies for hypogravity and microgravity environments, but may not be feasible. The aims of this study were to (1) evaluate rescuer performance over 1.5 min of external chest compressions (ECCs) during simulated Martian hypogravity (0.38Gz) and microgravity (μG) in relation to 1Gz and rest baseline and (2) compare the physiological costs of conducting ECCs in accordance with the 2010 and 2005 CPR guidelines.
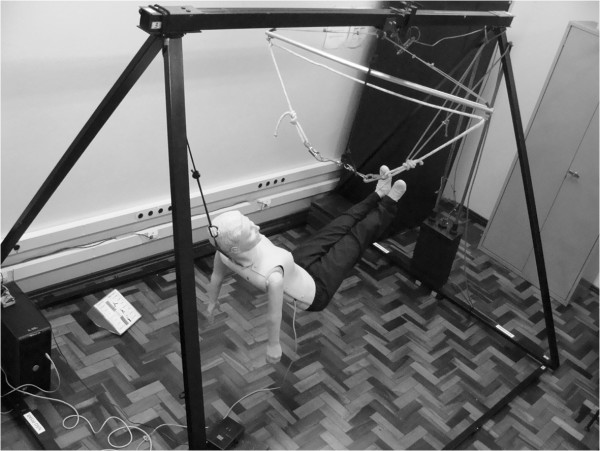
Methods: Thirty healthy male volunteers, ranging from 17 to 30 years, performed four sets of 30 ECCs for 1.5 min using the 2010 and 2005 ECC guidelines during 1Gz, 0.38Gz and μG simulations (Evetts-Russomano (ER) method), achieved by the use of a body suspension device. ECC depth and rate, range of elbow flexion, post-ECC heart rate (HR), minute ventilation (VE), peak oxygen consumption (VO2peak) and rate of perceived exertion (RPE) were measured.
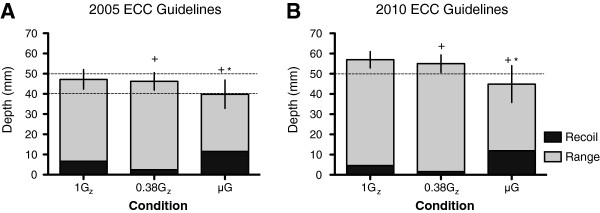
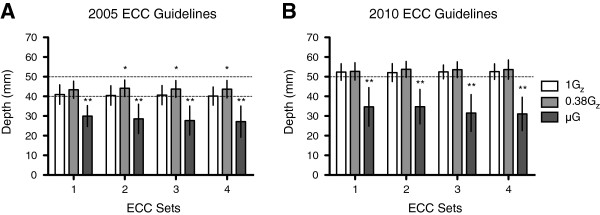
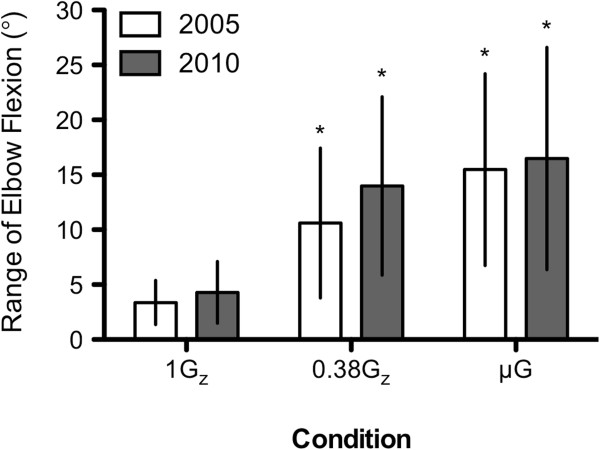
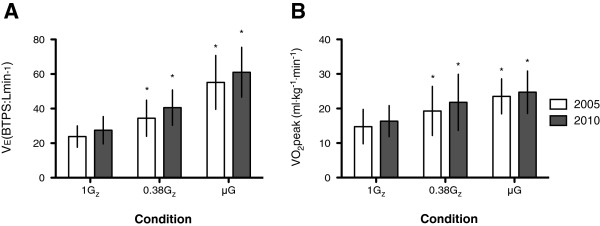
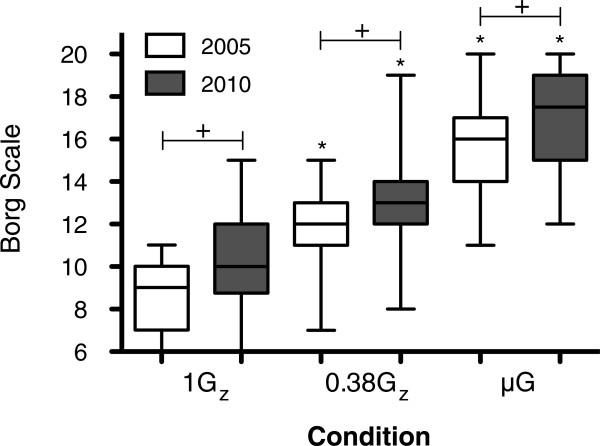
Results: All volunteers completed the study. Mean ECC rate was achieved for all gravitational conditions, but true depth during simulated microgravity was not sufficient for the 2005 (28.5 ± 7.0 mm) and 2010 (32.9 ± 8.7 mm) guidelines, even with a mean range of elbow flexion of 15°. HR, VE and VO2peak increased to an average of 136 ± 22 bpm, 37.5 ± 10.3 L·min-1, 20.5 ± 7.6 mL·kg-1·min-1 for 0.38Gz and 161 ± 19 bpm, 58.1 ± 15.0 L·min-1, 24.1 ± 5.6 mL·kg-1·min-1 for μG from a baseline of 84 ± 15 bpm, 11.4 ± 5.9 L·min-1, 3.2 ± 1.1 mL·kg-1·min-1, respectively. RPE was the only variable to increase with the 2010 guidelines.
Conclusion: No additional physiological cost using the 2010 basic life support (BLS) guidelines was needed for healthy males performing ECCs for 1.5 min, independent of gravitational environment. This cost, however, increased for each condition tested when the two guidelines were compared. Effective ECCs were not achievable for both guidelines in simulated μG using the ER BLS method. This suggests that future implementation of an ER BLS in a simulated μG instruction programme as well as upper arm strength training is required to perform effective BLS in space.
Figures
Similar articles
-
Effectiveness of CPR in Hypogravity Conditions-A Systematic Review.Life (Basel). 2022 Nov 23;12(12):1958. doi: 10.3390/life12121958. Life (Basel). 2022. PMID: 36556323 Free PMC article. Review.
-
Cardiopulmonary resuscitation (CPR) during spaceflight - a guideline for CPR in microgravity from the German Society of Aerospace Medicine (DGLRM) and the European Society of Aerospace Medicine Space Medicine Group (ESAM-SMG).Scand J Trauma Resusc Emerg Med. 2020 Nov 2;28(1):108. doi: 10.1186/s13049-020-00793-y. Scand J Trauma Resusc Emerg Med. 2020. PMID: 33138865 Free PMC article.
-
A new method for the performance of external chest compressions during hypogravity simulation.Life Sci Space Res (Amst). 2018 Aug;18:72-79. doi: 10.1016/j.lssr.2018.06.001. Epub 2018 Jun 30. Life Sci Space Res (Amst). 2018. PMID: 30100150
-
Gender influence on the performance of chest compressions in simulated hypogravity and microgravity.Aviat Space Environ Med. 2012 Jul;83(7):643-8. doi: 10.3357/asem.3171.2012. Aviat Space Environ Med. 2012. PMID: 22779305
-
Evaluation of a novel basic life support method in simulated microgravity.Aviat Space Environ Med. 2011 Feb;82(2):104-10. doi: 10.3357/asem.2856.2011. Aviat Space Environ Med. 2011. PMID: 21329024
Cited by
-
Alternative techniques for cardiopulmonary resuscitation in extreme environments - A scoping review.Resusc Plus. 2024 Sep 3;20:100762. doi: 10.1016/j.resplu.2024.100762. eCollection 2024 Dec. Resusc Plus. 2024. PMID: 39286061 Free PMC article.
-
Long-Term Microgravity Exposure Increases ECG Repolarization Instability Manifested by Low-Frequency Oscillations of T-Wave Vector.Front Physiol. 2019 Dec 17;10:1510. doi: 10.3389/fphys.2019.01510. eCollection 2019. Front Physiol. 2019. PMID: 31920714 Free PMC article.
-
Effectiveness of CPR in Hypogravity Conditions-A Systematic Review.Life (Basel). 2022 Nov 23;12(12):1958. doi: 10.3390/life12121958. Life (Basel). 2022. PMID: 36556323 Free PMC article. Review.
-
Development of a Digital Platform: A Perspective to Advance Space Telepharmacy.IEEE Open J Eng Med Biol. 2023 Jan 18;4:168-172. doi: 10.1109/OJEMB.2023.3237988. eCollection 2023. IEEE Open J Eng Med Biol. 2023. PMID: 38274777 Free PMC article.
-
Cardiopulmonary resuscitation (CPR) during spaceflight - a guideline for CPR in microgravity from the German Society of Aerospace Medicine (DGLRM) and the European Society of Aerospace Medicine Space Medicine Group (ESAM-SMG).Scand J Trauma Resusc Emerg Med. 2020 Nov 2;28(1):108. doi: 10.1186/s13049-020-00793-y. Scand J Trauma Resusc Emerg Med. 2020. PMID: 33138865 Free PMC article.
References
-
- Sides MB, Vernikos J, Convertino VA, Stepanek J, Tripp LD, Draeger J, Hargens AR, Kourtidou-Papadeli C, Pavy-LeTraon A. The Bellagio report: cardiovascular risks of spaceflight: implications for the future of space travel. Aviat Space Environ Med. 2005;76(9):877–895. - PubMed
-
- Johnston SL, Marshburn TH, Lindgren K. 71st Annual Scientific Meeting of the Aerospace Medical Association: May 2000. Houston, Texas; 2000. Predicted incidence of evacuation-level illness/injury during space station operation.
-
- Bonin GR. Initiating piloted mars expeditions with medium-lift launch systems. JBIS. 2005;58:302–309.
LinkOut - more resources
Full Text Sources
Other Literature Sources
Miscellaneous
