. 2013 Aug 12;24(2):151-66.
doi: 10.1016/j.ccr.2013.06.003. Epub 2013 Jul 11.

Chromatin-bound IκBα regulates a subset of polycomb target genes in differentiation and cancer

Affiliations

Chromatin-bound IκBα regulates a subset of polycomb target genes in differentiation and cancer

María Carmen Mulero et al. Cancer Cell. .

Abstract

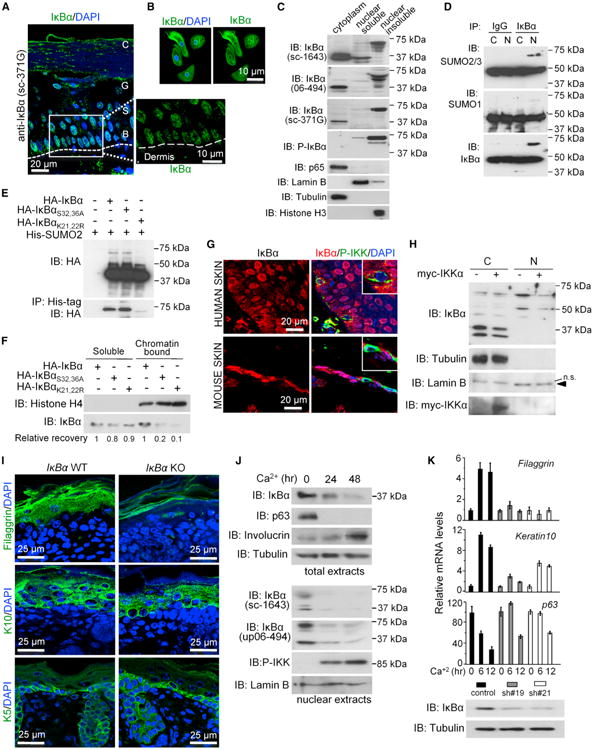
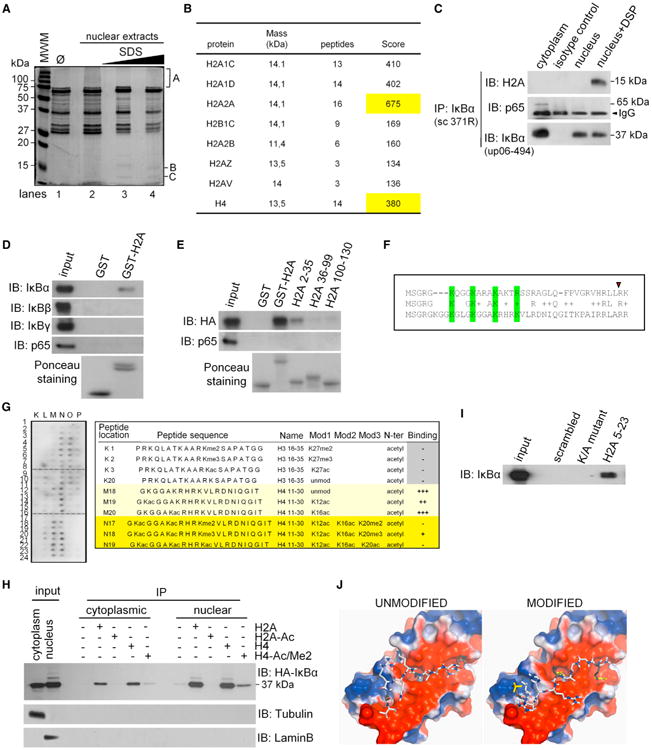
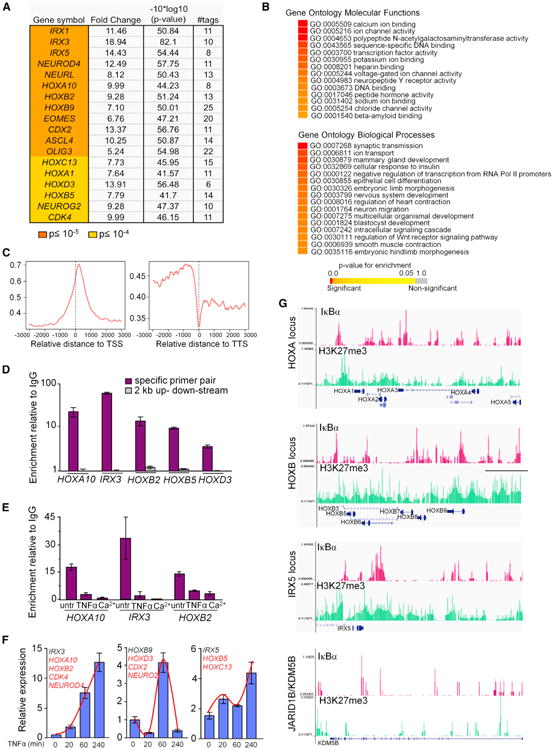
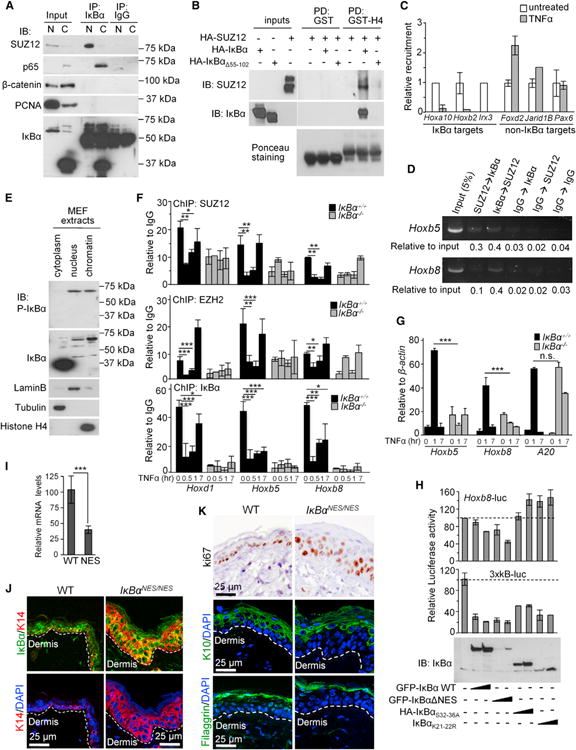
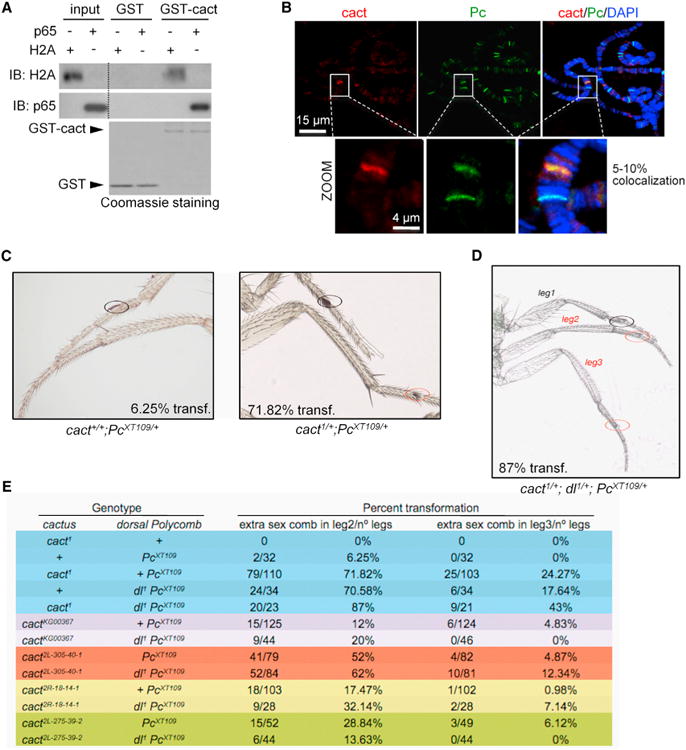
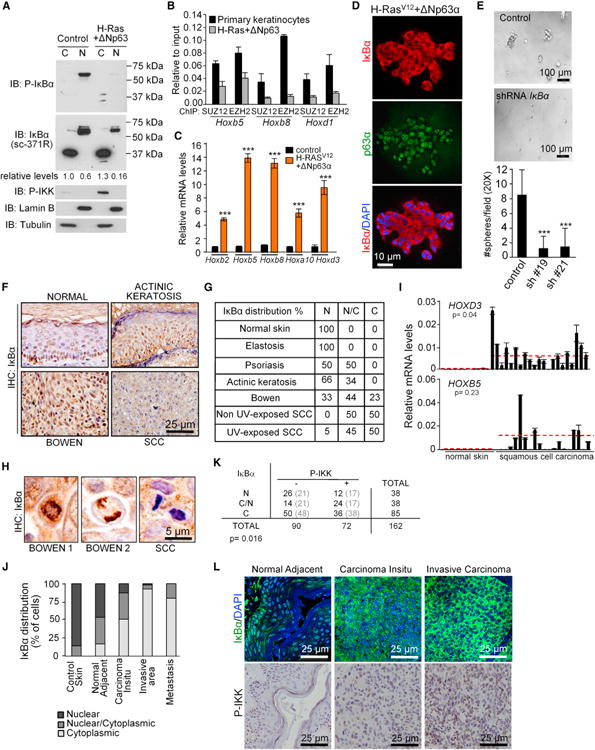
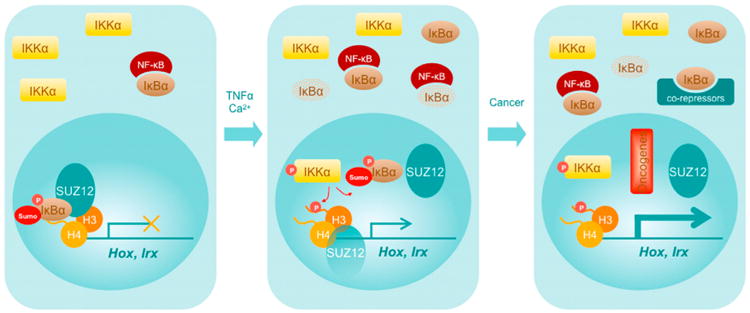
IκB proteins are the primary inhibitors of NF-κB. Here, we demonstrate that sumoylated and phosphorylated IκBα accumulates in the nucleus of keratinocytes and interacts with histones H2A and H4 at the regulatory region of HOX and IRX genes. Chromatin-bound IκBα modulates Polycomb recruitment and imparts their competence to be activated by TNFα. Mutations in the Drosophila IκBα gene cactus enhance the homeotic phenotype of Polycomb mutants, which is not counteracted by mutations in dorsal/NF-κB. Oncogenic transformation of keratinocytes results in cytoplasmic IκBα translocation associated with a massive activation of Hox. Accumulation of cytoplasmic IκBα was found in squamous cell carcinoma (SCC) associated with IKK activation and HOX upregulation.


Figures

Figure 1
Figure 1. Phosphorylated and Sumoylated IκBα Is Found in the Nucleus of Normal Basal Keratinocytes
(A) Immunodetection of IκBα (green) in normal human skin and detail of basal layer. B, basal; S, spinous, G, granular; and C, cornified layers of epidermis. Dashed line indicates the dermis interphase. DAPI was used for nuclear staining. (B) IF of IκBα in primary human keratinocytes. (C) Subcellular fractionation of human keratinocytes followed by IB with the indicated antibodies. (D) IκBα was immunoprecipitated from primary murine keratinocyte extracts followed by IB with the indicated antibodies. (E) IB analysis of His-tag precipitates from HEK293T cells transfected with the indicated plasmids. SUMO2 is incorporated in IκBα when K21,22 are present. (F) HEK293T cells were transfected with the indicated IκBα plasmids and processed following the ChIP protocol to obtain the whole chromatin fraction that was analyzed by IB. (G) IF of IκBα and P-IKK in skin sections. Cells with P-IKK staining do not contain nuclear IκBα. (H) IB analysis of keratinocytes transduced with myc-IKKαEE or control. (I) IF analysis of the indicated differentiation markers in skin sections of WT and IκBα KO newborn mice. (J) IB analysis of indicated proteins in control or Ca2+-treated murine keratinocytes. Total and nuclear/chromatin fractions are shown. (K) Determination of Filaggrin, K10, and p63 mRNA levels in control and IκBα KD keratinocytes following Ca2+ treatment. Expression levels are relative to Gapdh and compared to control cells. Error bars indicate SD. IκBα protein levels were analyzed by IB. Data correspond to one representative of three experiments. N, nuclear; C, cytoplasmic. See also Figure S1.
Figure 2
Figure 2. IκBα Binds Histones H2A and H4
(A) PD experiment using GST-IκBα and native (lane 2) or denatured-renatured (lanes 3–4) human keratinocyte nuclear extracts. One representative gel stained with Coomassie blue is shown (n = 3). (B) Purification and analysis of B and C bands identified as histones H2A and H4 by mass spectrometry. Table indicates the number of peptides identified and their score factor. The highest score is highlighted. (C) Coprecipitation from DSP-crosslinked nuclear extracts from human keratinocytes. (D and E) PD using different GST-H2A proteins and total lysates from HEK293T cells expressing the indicated proteins. (F) ClustalW alignment of the conserved KXXXK/R motifs in the N terminus of histones H2A and H4. Conserved K and R residues are in green. Red triangle indicates the last AA included in GST-H2A 2-35. (G) Histone peptide array hybridized with nuclear HEK293T extracts expressing HA-IκBα. One informative area of the blot image and the relative binding of selected peptides are shown. (H) Coprecipitation of cytoplasmic and nuclear HA-IκBα expressed in HEK293T cells with the indicated histone H2A and H4 peptides. (I) HA-IκBα was precipitated using the indicated histone H2A peptide, the K/A mutant, or scrambled peptide. In (G), (H), and (I), cell lysates were denatured-renatured previous to the precipitation to disrupt preformed complexes. (J) Model for binding of the histone H4 peptide (unmodified or modified) to consecutive ankyrin repeats of IκBα (3KXXXK). See also Figure S2.
Figure 3
Figure 3. Analysis and Identification of IκBα Target Genes
(A) Developmentally related genes selected from IκBα targets identified in ChIP-seq analysis. Fold change over the random background is indicated. (B) Functional enrichment of target genes with p value cutoff ≤ 10−5 based on gene ontology (GO) as extracted from Ensembl database using GiTools. Enriched categories are represented in heatmap with the indicated color-coded p value scale. (C) Graphs show the relative distance to the nearest ChIPed region, 3 kb upstream and downstream of the RefSeq gene's TSS and TTS. (D) Validation of the identified DNA regions (−222 to −200 for HOXA10, −9,380 to −9,360 for HOXB2, +6,166 to +6,186 for HOXB5, +4,451 to+4,471 for HOXB3, and −18,820 to −18,800 for IRX3) by conventional ChIP. Amplification of 2 kb distant regions was used as negative controls. (E) ChIP analysis of IκBα after 20 min of TNFα or 48 hr Ca2+ treatments. In (D) and (E), graphs represent mean enrichment relative to nonspecific immunoglobulin G (IgG) (n = 2). (F) Expression levels of IκBα target genes following TNFα treatment analyzed by qRT-PCR. Gene represented is in black, whereas genes following the same kinetics are indicated in red. (G) ChIP-seq profiles of endogenous IκBα occupancy in three enriched loci (HOXA, HOXB, and IRX5) and one negative locus (JARID1B/KDM5B) compared to H3K27me3 (from the UW ENCODE Project) in keratinocytes. (D–F) Bars represent mean, and error bars indicate SD. See also Figure S3.
Figure 4
Figure 4. IκBα Interacts with and Regulates Association of PRC2 in Response to TNFα
(A) IB analysis of IκBα precipitates from nuclear and cytoplasmic primary murine keratinocyte extracts. Five percent of the input and 25% of the IP was loaded in all cases except for detection of IκBα input that represents 0.5%. (B) PD using GST-H4 and cell lysates from HEK293T expressing different combinations of HA-IκBα and SUZ12. (C) Relative recruitment assessed by ChIP of SUZ12 to different genes 40 min after TNFα in primary murine keratinocytes. (D) Sequential ChIP using the indicated combinations of antibodies. An analysis of two different Hox regulatory regions is shown. (E) IB analysis of WT fibroblasts showing the presence of cytoplasmic and nuclear IκBα. (F) Relative chromatin binding of PRC2 and IκBα in WT and IκBα KO MEFs treated with TNFα. ChIP values were normalized by IgG precipitation. (G) Relative levels of the indicated genes in WT and IκBα KO MEFs. (H) Luciferase assays to determine the effect of different IκBα constructs on the activity of HoxB8 compared to the 3xκB reporter. Lower panels show expression levels of different constructs. (I) Expression levels of HoxB8 in the skin of WT and IκBαNES/NES mice by qRT-PCR (n = 2). (J and K) Analysis of skin sections from 7- to 8-week-old WT and IκBαNES/NES mice by IF. K14 labels the basal layer keratinocytes (J). Immunostaining of ki67, the suprabasal marker K10, and filaggrin (K). Throughout the figure, bars represent mean, and error bars indicate SD. See also Figure S4 and Table S1.
Figure 5
Figure 5. Mutations in cactus/IκBα Enhances the Homeotic Phenotype of Heterozygous Pc Mutants in Drosophila melanogaster
(A) PD using GST-cactus and detection of p65 expressed in HEK293T or H2A from a histone-enriched extract. (B) Representative image of a double IF for cact and Pc in Drosophila salivary polytene chromosomes. Selected region is shown in the magnification. cact-positive bands always overlap Pc staining. (C) The percent of mutant adults with “extra sex comb” in legs 2 and 3 (red circles) was measured in at least 100 legs of flies heterozygous for 12 cact mutations in two different Pc−/+ mutant backgrounds. (D) Representative image of the homeotic phenotype induced by cact in Pc mutants, which is enhanced by heterozygous mutation of dorsal. In (C) and (D), the percentage of flies with “extra sex combs” in leg 2 is indicated. (E) Frequency of the homeotic phenotypes corresponding to the number of “extra sex combs” in second and third leg in flies with the indicated cactus, dorsal, and Polycomb mutations. See also Tables S2 and S3.
Figure 6
Figure 6. IκBα Accumulates in the Cytoplasm after Keratinocyte Transformation Associated with Hox Induction
(A) IB analysis of IκBα in the subcellular fractions of primary and H-Ras/ΔNp63α transformed keratinocytes. (B) ChIP analysis of PRC2 recruitment on the indicated genes in control and transformed keratinocytes. (C) Expression levels of the indicated genes relative to Gapdh. (D) IF of IκBα in the transformed keratinocytes growing in 3D cultures. (E) Transformation capacity of H-Ras/ΔNp63α transduced keratinocytes in control or IκBα KD cells. Image of 3Dcultures (upper panels) and graph represents the number of spheres from 5 × 10³ cells after 5 days in culture (lower panel). Sixteen fields (20×) from two independent experiments were counted. (F and G) Analysis by immunohistochemistry of IκBα distribution in different human skin lesions. (G) Table indicates the percent of nuclear (N), diffuse (N/C), or cytoplasmic (C) distribution in the analyzed samples. (H) Chromosomal localization of IκBα in mitotic cells from Bowen's disease samples, but not in SCC cells. (I) Expression analysis of the indicated genes by qRT-PCR. Red line indicates the mean expression in normal and SCC samples. Significance of the differences was determined using Student's t test analysis. (J) IκBα distribution in control and different grades of tumor progression in a collection of 112 human urogenital SCC samples. (K) Correlation between subcellular distribution of IκBα and P-IKK levels in this group of patients. Statistical significance of the association was determined by a chi-square test. (L) Representative images showing IκBα and P-IKK staining indifferent lesions from the same patient. In(C) and (E) ***p < 0.001, as determined by Student's t test analysis. In (B), (C), (E), and (I), bars represent mean, and error bars indicate SD.
Figure 7
Figure 7. Model for Nuclear IκBα Function in Normal and Transformed Cells
In brief, sumoylated and phosphorylated IκBα binds the chromatin of noninduced and nontransformed cells to maintain gene repression, which is relieved after cytokine induction or keratinocyte transformation. Release of IκBα from the chromatin is, at least in part, mediated by IKKα and results in PRC dissociation and specific gene activation. These effects are maximized by stimuli that lead to tumorigenesis.

Comment in

References

    1. Aguilera C, Hoya-Arias R, Haegeman G, Espinosa L, Bigas A. Recruitment of IkappaBalpha to the hes1 promoter is associated with transcriptional repression. Proc Natl Acad Sci USA. 2004;101:16537–16542. - PMC - PubMed
    1. Arenzana-Seisdedos F, Turpin P, Rodriguez M, Thomas D, Hay RT, Virelizier JL, Dargemont C. Nuclear localization of I kappa B alpha promotes active transport of NF-kappa B from the nucleus to the cytoplasm. J Cell Sci. 1997;110:369–378. - PubMed
    1. Baeuerle PA, Baltimore D. I kappa B: a specific inhibitor of the NF-kappa B transcription factor. Science. 1988;242:540–546. - PubMed
    1. Beg AA, Sha WC, Bronson RT, Baltimore D. Constitutive NF-kappa B activation, enhanced granulopoiesis, and neonatal lethality in I kappa B alpha-deficient mice. Genes Dev. 1995;9:2736–2746. - PubMed
    1. Birney E, Stamatoyannopoulos JA, Dutta A, Guigó R, Gingeras TR, Margulies EH, Weng Z, Snyder M, Dermitzakis ET, Thurman RE, et al. ENCODE Project Consortium; NISC Comparative Sequencing Program; Baylor College of Medicine Human Genome Sequencing Center; Washington University Genome Sequencing Center; Broad Institute; Children's Hospital Oakland Research Institute. Identification and analysis of functional elements in 1% of the human genome by the ENCODE pilot project. Nature. 2007;447:799–816. - PMC - PubMed

Publication types

MeSH terms

Associated data