. 2013 Sep 5;13(3):285-99.
doi: 10.1016/j.stem.2013.06.009. Epub 2013 Jul 11.

Myeloproliferative neoplasia remodels the endosteal bone marrow niche into a self-reinforcing leukemic niche

Affiliations

Myeloproliferative neoplasia remodels the endosteal bone marrow niche into a self-reinforcing leukemic niche

Koen Schepers et al. Cell Stem Cell. .

Abstract

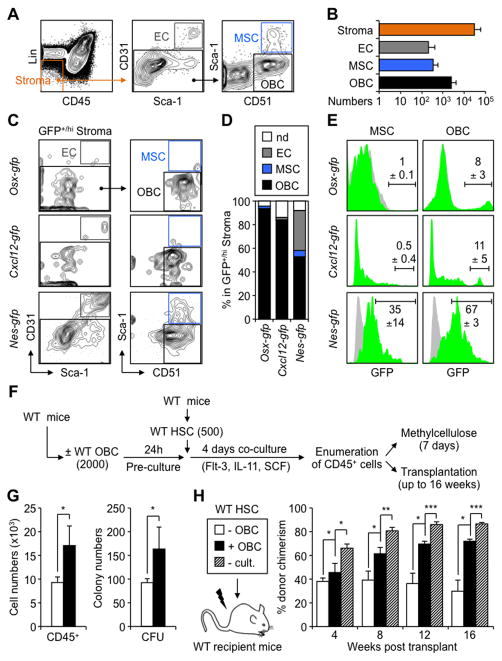
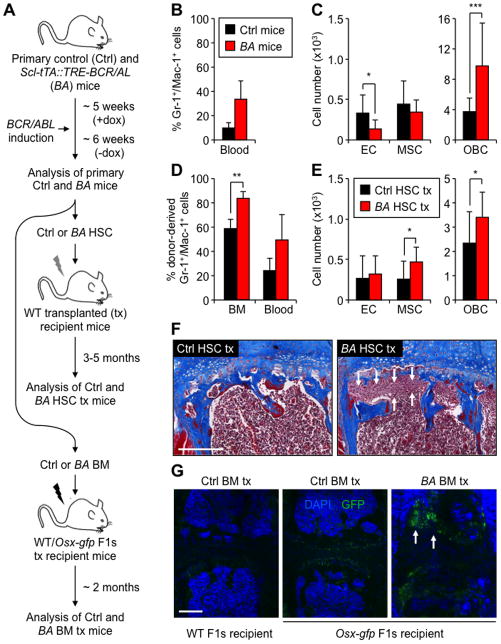
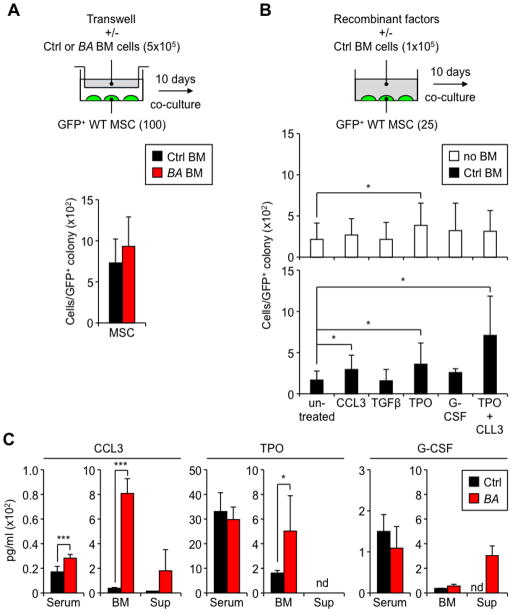
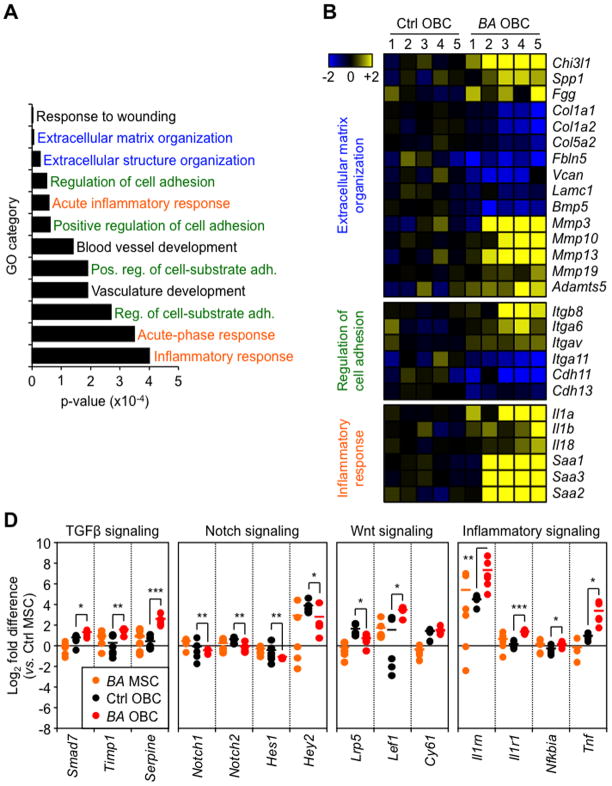
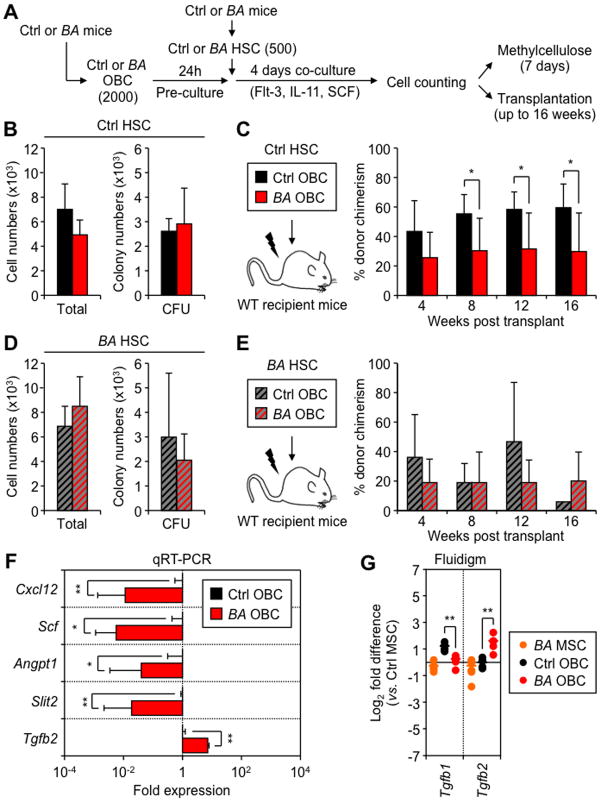
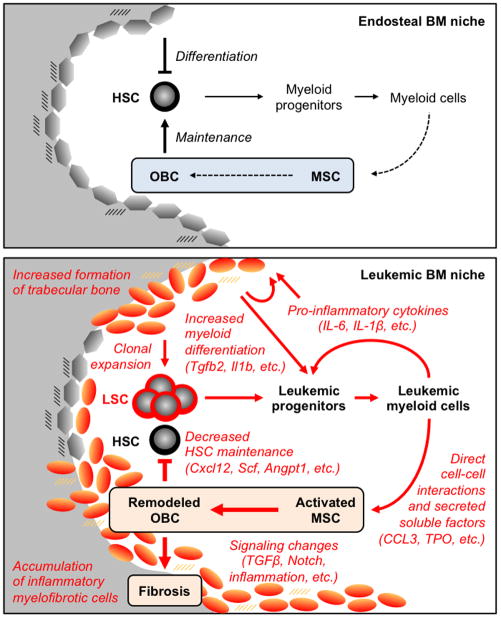
Multipotent stromal cells (MSCs) and their osteoblastic lineage cell (OBC) derivatives are part of the bone marrow (BM) niche and contribute to hematopoietic stem cell (HSC) maintenance. Here, we show that myeloproliferative neoplasia (MPN) progressively remodels the endosteal BM niche into a self-reinforcing leukemic niche that impairs normal hematopoiesis, favors leukemic stem cell (LSC) function, and contributes to BM fibrosis. We show that leukemic myeloid cells stimulate MSCs to overproduce functionally altered OBCs, which accumulate in the BM cavity as inflammatory myelofibrotic cells. We identify roles for thrombopoietin, CCL3, and direct cell-cell interactions in driving OBC expansion, and for changes in TGF-β, Notch, and inflammatory signaling in OBC remodeling. MPN-expanded OBCs, in turn, exhibit decreased expression of many HSC retention factors and severely compromised ability to maintain normal HSCs, but effectively support LSCs. Targeting this pathological interplay could represent a novel avenue for treatment of MPN-affected patients and prevention of myelofibrosis.


Figures

Figure 1
Figure 1. HSC-supportive activity of endosteal OBCs
(A) Flow cytometry approach used to identify endosteal BM stromal populations. (B) Average numbers of ECs, MSCs and OBCs contained in the endosteal (Lin/CD45) BM stromal fraction of wild type (WT) mice (n = 23 in 7 independent experiments). (C) Immunophenotype and (D) frequencies of GFP+ endosteal ECs, MSCs and OBCs in Osx-gfp, Cxcl12-gfp and Nes-gfp reporter mice (n = 2–4 per genotype; nd: not determined). (E) Frequency of GFP+/hi cells in endosteal MSCs and OBCs of Osx-gfp, Cxcl12-gfp and Nes-gfp reporter mice (green histograms). Grey histograms indicate background GFP fluorescence levels in control populations. (F) Schematic of the short-term co-culture of HSCs with or without OBCs, and follow up analyses. (G) Cell numbers and methylcellulose colony-forming unit (CFU) activity. (H) Transplantation in lethally irradiated WT CD45.1 recipients (n = 3–5 mice per group, with results replicated in another independent experiment). Mice were bled every 4 weeks and analyzed for the percentage of CD45.2+ donor-derived cells (- cult.: no culture). Data are means ± SD; *p ≤ 0.05, ** p ≤ 0.01, ***p ≤ 0.001. See also Figure S1.
Figure 2
Figure 2. MPN hematopoiesis induces expansion of endosteal OBCs
(A) Overall experimental design. Primary diseased Scl-tTA::TRE-BCR/ABL (BA) and age-matched control (Ctrl) mice were analyzed ~6 weeks after doxycycline (dox) withdrawal (n = 9–14 per group in 4 independent experiments). Purified CD45.2 HSCs (500 to 4,000 cells) were transplanted into lethally-irradiated WT CD45.1 recipients (n = 10–13 mice per group in 6 independent experiments), and unfractionated CD45.2 BM cells (2×10⁶ cells) into WT or Osx-gfp F1s recipients (n = 3–6 mice per group in 2 independent experiments). (B) Percentage of Gr-1+/Mac-1+ myeloid cells in the blood of primary Ctrl and BA mice. (C) Numbers of endosteal ECs, MSCs and OBCs in primary Ctrl and BA mice. (D) Percentage of donor-derived Gr-1+/Mac-1+ myeloid cells in the BM and blood of Ctrl and BA HSC tx WT mice. (E) Numbers of endosteal ECs, MSCs and OBCs in Ctrl and BA HSC tx WT mice. (F) Masson’s trichrome staining of sternums from the indicated mice. Arrows indicate areas with myelofibrotic cells. Scale bar, 250 μm. (G) Immunofluorescence analyses of sternums from Ctrl and BA BM tx WT and Osx-gfp mice stained for DAPI (blue) and GFP (green). Arrows indicate areas with GFP+ myelofibrotic cells. Scale bar, 250 μm. Data are means ± SD; *p ≤ 0.05, ** p ≤ 0.01, ***p ≤ 0.001. See also Figure S2.
Figure 3
Figure 3. MPN myeloid cells stimulate MSCs to overproduce OBCs
(A) Schematic of the in vitro co-culture/imaging approach. MSCs or OBCs isolated from β-actin-gfp mice were cultured with Ctrl or BA BM cells and imaged for the number of GFP+ cells per colony using an IN Cell Analyzer 2000. Representative images are of wells containing MSC- and OBC-derived GFP+ colonies after 10 days culture with Ctrl and BA BM cells. Scale bar, 1 mm. (B) Average numbers of GFP+ cells obtained per MSC or OBC colony after 10 days culture ± Ctrl or BA BM cells (n ≥ 3 per group, with at least 11 individual colonies scored per condition; nd: not determined). (C) Frequencies of EdU+ cells in re-sorted MSC-derived GFP+ cells cultured with Ctrl or BA BM cells for 7 days and pulsed with 10 μM EdU for 3 hours (n = 7–8 per group). (D) Frequencies of hematopoietic cells stained with the indicated markers in unfractionated and myeloid-enriched (my) Ctrl and BA BMs, and average numbers of GFP+ cells obtained per MSC colony after 10 days culture with Ctrl or BA myBM cells (n ≥ 3 per group, with at least 65 individual colonies scored per condition). (E) Schematic of the in vivo MPN regression experiment. Primary diseased BA and age-matched Ctrl mice were re-exposed for 2 or 4 months (m) to doxycline (+dox) to block BCR/ABL expression (n = 3–6 mice per group). (F) Percentage of Gr-1+/Mac-1+ myeloid cells in the BM of re-exposed mice and Masson’s trichrome staining of sternums from the indicated mice. Scale bar, 100 μm. Data are means ± SD; *p ≤ 0.05, ***p ≤ 0.001. See also Figure S3.
Figure 4
Figure 4. MSC stimulation requires TPO, CCL3 and direct contact with MPN myeloid cells
(A) Schematic and average numbers of GFP+ cells obtained per MSC colony after 10 days co-culture without direct contact with Ctrl or BA BM cells in 24-well transwell plates (n = 3 per group, with at least 30 individual colonies scored per condition). (B) Schematic and average numbers of GFP+ cells obtained per MSC colony after 10 days co-culture with the indicated recombinant cytokines (50 ng/ml except for TGFβ used at 10 ng/ml) ± Ctrl BM cells (n ≥ 6 per group, with at least 20 individual colonies scored per condition). (C) ELISA quantification of CCL3, TPO and G-CSF levels in the serum and BM plasma (BM) of primary Ctrl and BA mice (n = 6–8 per group), and supernatant (sup) from 10-day co-cultures of MSCs with Ctrl and BA BM cells (n = 3 per group; nd: not detectable). Data are means ± SD; *p ≤ 0.05, ***p ≤ 0.001. See also Figure S4.
Figure 5
Figure 5. Molecular features of MPN-expanded OBCs
(A) OBCs were purified from individual primary Ctrl and BA mice (n = 5 per group) and used for microarray analyses. Histogram shows the gene ontology (GO) results for the biological processes significantly affected in BA OBCs. (B) Microarray results detailing the genes involved in extracellular matrix organization, regulation of cell adhesion and inflammatory response. Data are expressed as log2 fold relative to the average expression level in Ctrl OBCs (set to 0). (C) Fluidigm-based gene expression analyses of TGFβ, Notch, Wnt and inflammation pathway components in MSCs and OBCs isolated from primary Ctrl and BA mice (n = 4–6 pools of 100 cells per population). Data are expressed as log2 fold relative to the average level in Ctrl MSCs (set to 0). Bars indicate average levels, and °/* statistical differences between Ctrl vs. BA MSCs and OBCs, respectively. Data are means ± SD; *p ≤ 0.05, ** p ≤ 0.01, ***p ≤ 0.001. See also Figure S5
Figure 6
Figure 6. Impaired HSC-supportive activity of MPN-expanded OBCs
(A) Schematic of the short-term co-culture of Ctrl or BA HSCs with Ctrl or BA OBCs, and follow up analyses. Cell numbers and methylcellulose CFU activity for the progeny of Ctrl HSCs (B) or BA HSCs (D) co-cultured with Ctrl or BA OBCs. Transplantation experiments for the progeny Ctrl HSCs (C) or BA HSCs (E) co-cultured with Ctrl or BA OBCs (n = 3–5 mice per group, with results replicated in another independent experiment). (F) qRT-PCR-based gene expression analyses of HSC regulatory molecules in OBCs isolated from individual primary Ctrl and BA mice (n = 3 per group). Data are expressed as fold relative to the average expression level in Ctrl OBCs (set to 1). (G) Fluidigm-based gene expression analyses of members of the TGFβ family in MSCs and OBCs isolated from primary Ctrl and BA mice (n = 4–6 pools of 100 cells per population). Data are expressed as log2 fold relative to the average level in Ctrl MSCs (set to 0). Bars indicate average levels, and * statistical differences between Ctrl vs. BA OBCs. Data are means ± SD; *p ≤ 0.05; **p ≤ 0.01. See also Figure S6.
Figure 7
Figure 7. Model for the leukemic BM niche
The endosteal BM niche contributes to HSC maintenance and regulated production of myeloid cells (top panel). The normal composition of the BM milieu likely contributes to regulated production of bone-lining OBCs from MSCs. During MPN development, transformed HSCs with LSC properties overproduce leukemic myeloid cells that secrete high levels of pro-inflammatory cytokines, thus creating a paracrine feedback loop that drives myeloid differentiation (bottom panel). Leukemic myeloid cells also directly stimulate MSCs to overproduce functionally altered OBCs, which accumulate in the BM cavity as inflammatory myelofibrotic cells. These MPN-expanded OBCs are severely compromised in their ability to maintain normal, but not transformed, HSCs and promote myeloid differentiation. Our results demonstrate that MPN development remodels the endosteal BM niche into a self-reinforcing leukemic niche that impairs normal hematopoiesis, favors LSC function and contribute to BM fibrosis. See also Figure S7.

Comment in

References

    1. Abdel-Wahab OI, Levine RL. Primary myelofibrosis: update on definition, pathogenesis, and treatment. Annu Rev Med. 2009;60:233–245. - PubMed
    1. Calvi LM, Adams GB, Weibrecht KW, Weber JM, Olson DP, Knight MC, Martin RP, Schipani E, Divieti P, Bringhurst FR, et al. Osteoblastic cells regulate the haematopoietic stem cell niche. Nature. 2003;425:841–846. - PubMed
    1. Chang MK, Raggatt LJ, Alexander KA, Kuliwaba JS, Fazzalari NL, Schroder K, Maylin ER, Ripoll VM, Hume DA, Pettit AR. Osteal tissue macrophages are intercalated throughout human and mouse bone lining tissues and regulate osteoblast function in vitro and in vivo. J Immunol. 2008;181:1232–1244. - PubMed
    1. Chitteti BR, Cheng YH, Streicher DA, Rodriguez-Rodriguez S, Carlesso N, Srour EF, Kacena MA. Osteoblast lineage cells expressing high levels of Runx2 enhance hematopoietic progenitor cell proliferation and function. J Cell Biochem. 2010;111:284–294. - PMC - PubMed
    1. Chow A, Lucas D, Hidalgo A, Méndez-Ferrer S, Hashimoto D, Scheiermann C, Battista M, Leboeuf M, Prophete C, van Rooijen N, et al. Bone marrow CD169+ macrophages promote the retention of hematopoietic stem and progenitor cells in the mesenchymal stem cell niche. J Exp Med. 2011;208:261–271. - PMC - PubMed

Publication types

MeSH terms

Associated data