

Artificial sweeteners produce the counterintuitive effect of inducing metabolic derangements
- PMID: 23850261
- PMCID: PMC3772345
- DOI: 10.1016/j.tem.2013.05.005
Artificial sweeteners produce the counterintuitive effect of inducing metabolic derangements
Abstract
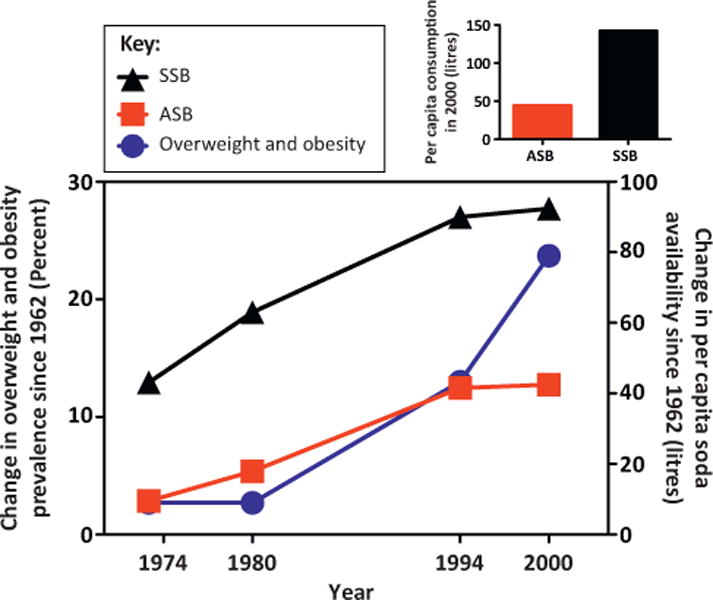
The negative impact of consuming sugar-sweetened beverages on weight and other health outcomes has been increasingly recognized; therefore, many people have turned to high-intensity sweeteners like aspartame, sucralose, and saccharin as a way to reduce the risk of these consequences. However, accumulating evidence suggests that frequent consumers of these sugar substitutes may also be at increased risk of excessive weight gain, metabolic syndrome, type 2 diabetes, and cardiovascular disease. This paper discusses these findings and considers the hypothesis that consuming sweet-tasting but noncaloric or reduced-calorie food and beverages interferes with learned responses that normally contribute to glucose and energy homeostasis. Because of this interference, frequent consumption of high-intensity sweeteners may have the counterintuitive effect of inducing metabolic derangements.
Keywords: diabetes; obesity; sweeteners.
Copyright © 2013 Elsevier Ltd. All rights reserved.
Figures
Comment in
-
A paucity of data, not robust scientific evidence: a response to Johnston and Foreyt.Trends Endocrinol Metab. 2014 Jan;25(1):2-4. doi: 10.1016/j.tem.2013.09.003. Epub 2013 Oct 22. Trends Endocrinol Metab. 2014. PMID: 24161510 No abstract available.
-
Robust scientific evidence demonstrates benefits of artificial sweeteners.Trends Endocrinol Metab. 2014 Jan;25(1):1. doi: 10.1016/j.tem.2013.09.007. Epub 2013 Oct 29. Trends Endocrinol Metab. 2014. PMID: 24182455 No abstract available.
References
-
- Johnson RK, et al. Dietary sugars intake and cardiovascular health: a scientific statement from the American Heart Association. Circulation. 2009;120:1011–1020. - PubMed
-
- Te Morenga L, et al. Dietary sugars and body weight: systematic review and meta-analyses of randomised controlled trials and cohort studies. BMJ. 2013;346:e7492. - PubMed
-
- van Baak MA, Astrup A. Consumption of sugars and body weight. Obes Rev. 2009;10(Suppl. 1):9–23. - PubMed
Publication types
MeSH terms
Substances
Grants and funding
LinkOut - more resources
Full Text Sources
Other Literature Sources
Medical
