Review
. 2013 Aug;17(8):391-400.
doi: 10.1016/j.tics.2013.06.006. Epub 2013 Jul 11.

Visual working memory capacity: from psychophysics and neurobiology to individual differences

Affiliations
Review

Visual working memory capacity: from psychophysics and neurobiology to individual differences

Steven J Luck et al. Trends Cogn Sci. 2013 Aug.

Abstract

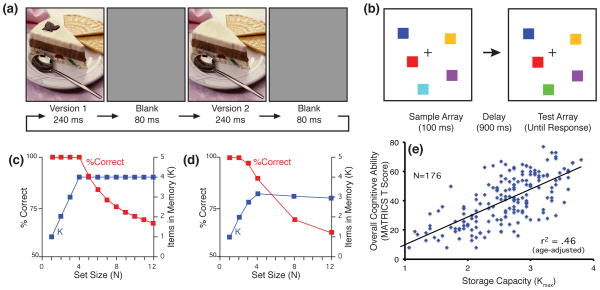
Visual working memory capacity is of great interest because it is strongly correlated with overall cognitive ability, can be understood at the level of neural circuits, and is easily measured. Recent studies have shown that capacity influences tasks ranging from saccade targeting to analogical reasoning. A debate has arisen over whether capacity is constrained by a limited number of discrete representations or by an infinitely divisible resource, but the empirical evidence and neural network models currently favor a discrete item limit. Capacity differs markedly across individuals and groups, and recent research indicates that some of these differences reflect true differences in storage capacity whereas others reflect variations in the ability to use memory capacity efficiently.


Figures

Figure 1
Figure 1
(a) Example of a change blindness task. Many cycles are required before an observer notices the difference between the two images. Reprinted from [10] by permission of Oxford University Press, USA. (b) Example of a change detection task [8]. A brief sample array is followed by a blank delay and then a test array. The test array is either identical to the sample array or differs in one feature of one of the objects, and the observer indicates whether a change was present. In the change localization variant, a change is always present and the subject indicates which item changed [47, 60, 79]. (c) Hypothetical results for an observer with a capacity (Kmax) of 4 items, assuming a slot model. Accuracy (% correct) is perfect when the set size (N) is less than Kmax (assuming that changes in color are very large, when present). When N > Kmax, the changed item will be present in memory on N/Kmax trials, and subjects will fail to detect the change when the changed item is not in memory. Accuracy will therefore decrease systematically as N increases above Kmax. By taking into account guessing, it is possible to estimate the number of items that the observer must have had in memory (K) at each set size [–83]. (d) Data from an actual experiment with college student subjects [8]. (e) Scatterplot of the relationship between storage capacity (Kmax) measured in a 10-minute change localization task and a measure of broad cognitive function (the T score from the MATRICS battery) in a sample of subjects including both schizophrenia patients and matched controls [13]. The correlations were similar in both groups, justifying an aggregated analysis.
Figure 2
Figure 2
(a) ERP paradigm for recording contralateral delay activity (CDA) [22]. Subjects are instructed to remember the colors of the items on the side indicated by the arrow and report whether a color has changed on that side in the test array. (b) ERP waveforms from ipsilateral versus contralateral electrode sites relative to the side of the array that was encoded into memory. Time zero is the onset of the test array, and the CDA is the difference in voltage between the ipsilateral and contralateral waveforms during the delay period. Negative is plotted upward. (c) CDA amplitude as a function of the number of items on the to-be-remembered side, averaged over subjects. Note that CDA amplitude reaches asymptote near the average working memory capacity limit. (d) Scatterplot of individual subjects, showing that individual differences in working memory capacity (Kmax) are correlated with differences in CDA asymptote (quantified as the difference in CDA amplitude between set sizes 2 and 4).
Figure 3
Figure 3
(a) Essence of the continuous resource and discrete slot classes of models. (b) Example of the continuous report task with color stimuli. The cue (thicker box) indicates which item should be reported by clicking on the color wheel. (c) Hypothetical distribution of response errors (difference between actual color and reported color) according to the slot model [48]. If the cued item is present in memory (violet line), the errors will be normally distributed around the correct value (the Von Mises distribution is used for circular dimensions such as hue). If the cued item is not remembered (brown line), errors will be random (a uniform distribution). The actual data consist of a weighted sum of these two distributions (black line). (d) Observed data from set sizes 3 and 6, and estimates of the parameters of the underlying distributions [48]. (e) Continuous report task for orientation [49]. The sample array contains circles with gaps; when the test display appears, the subject reports the remembered orientation of the gap in the item that is cued by the thicker circle; the report the orientation by clicking on the corresponding location on the cue circle. (f) Standard deviation (SD) of the distribution of response errors in the task shown in (e) as a function of set size. The group data are well fit by a function that rises linearly, has an inflection point at the average Kmax, and is then flat. (g) Inflection point as a function of Kmax for individual subjects, showing that the point at which the SD reaches asymptote for a given subject is predicted by that subject’s VWM capacity.
Figure 4
Figure 4
(a) Spatial VWM paradigm of Bays and Husain [46]. Observers report whether the probe was displaced leftward or rightward relative to the corresponding sample item. (b) Results from set size 8 in a replication experiment [52]. The X axis shows the amount of displacement of the probe relative to the original item, with negative values indicating a leftward displacement and positive values indicating a rightward displacement. The Y axis shows the probability that the subject reported a rightward displacement. When the displacement was large, subjects were nearly perfect: they nearly always reported a rightward displacement for a large rightward displacement and almost never reported a rightward displacement for a large leftward displacement. Bays and Husain argued that this nearly perfect memory for large displacements at set size 8 was strong evidence against the slot model and in favor of the resource model, but later research showed that these results could be explained by a guessing strategy [52]. (c) Results when the task was changed slightly to eliminate the guessing strategy. Observers were no longer nearly perfect for large displacements. Panels (b) and (c) were reprinted from [52] with kind permission from Springer Science and Business Media.
Figure 5
Figure 5
Neural representation of three cell assemblies (groups of neurons coding separate objects in VWM). Each cell assembly consists of a group of neurons from one or more cortical areas. In some models, neurons are recruited to a specific cell assembly at the moment of encoding to represent the features of the object being encoded, and a given neuron may be allocated to different cell assemblies depending on the information being stored in memory. (a) Groups of neurons coding a given object form local recurrent loops within an area (small U-shaped arrows) and long-range recurrent loops between areas (large arrows). The recurrent connections cause the activity to be maintained over time, and the activity oscillates as it bounces back and forth between neurons (both within and between cortical areas). Most models include only one or two cortical areas (e.g., inferotemporal and prefrontal cortex), but many different areas are likely synchronized in this manner. (b) The neurons in a given cell assembly spike together briefly (represented by vertical lines), and then the activity decays. The different cell assemblies spike at different times, minimizing interference between them. However, a given cell assembly must spike again before it decays too far (in which case the cell assembly stops firing and the VWM representation is lost). This limits the number of cell assemblies that can be simultaneously active without either interfering with each other or decaying into oblivion.

Similar articles

Cited by

References

    1. Anderson JR, et al. ACT-R: A theory of higher level cognition and its relation to visual attention. Human-Computer Interaction. 1997;12:439–462.
    1. Meyer DE, Kieras DE. A computational theory of executive cognitive processes and multiple-task performance: Part 1. Basic mechanisms. Psychol Rev. 1997;104:3–65. - PubMed
    1. Kyllonen PC, Christal RE. Reasoning ability is (little more than) working-memory capacity?! Intelligence. 1990;14:389–433.
    1. Engle RW, et al. Working memory, short-term memory, and general fluid intelligence: a latent-variable approach. J Exp Psychol Gen. 1999;128:309–331. - PubMed
    1. Simons DJ, Levin DT. Change blindness. Trends in Cognitive Sciences. 1997;1:261–267. - PubMed

Publication types