

A framework to spatially cluster air pollution monitoring sites in US based on the PM2.5 composition
- PMID: 23850585
- PMCID: PMC3878877
- DOI: 10.1016/j.envint.2013.06.003
A framework to spatially cluster air pollution monitoring sites in US based on the PM2.5 composition
Abstract
Background: Heterogeneity in the response to PM2.5 is hypothesized to be related to differences in particle composition across monitoring sites which reflect differences in source types as well as climatic and topographic conditions impacting different geographic locations. Identifying spatial patterns in particle composition is a multivariate problem that requires novel methodologies.
Objectives: Use cluster analysis methods to identify spatial patterns in PM2.5 composition. Verify that the resulting clusters are distinct and informative.
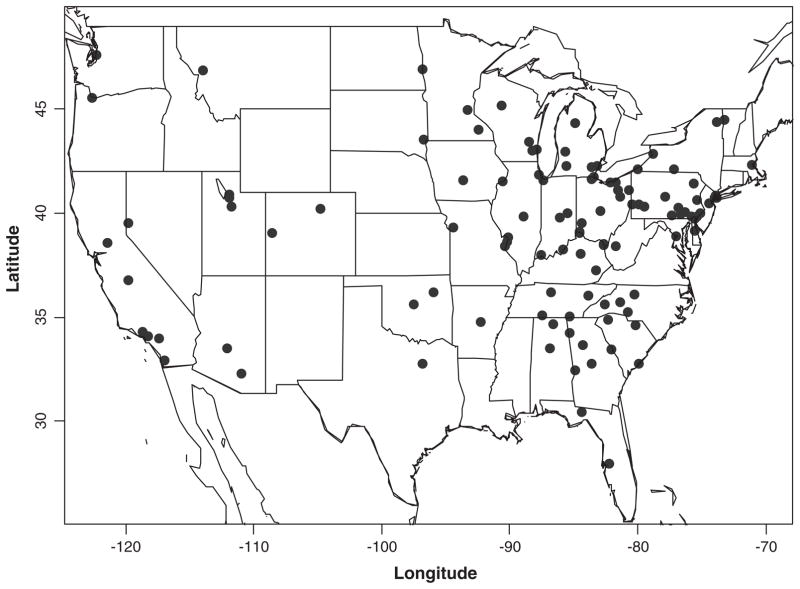
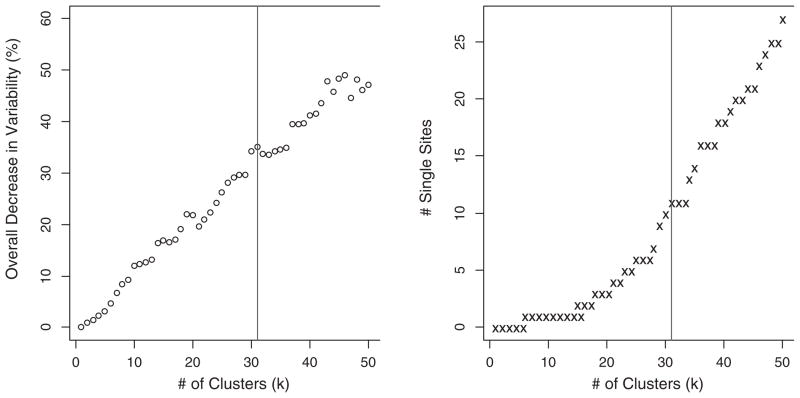
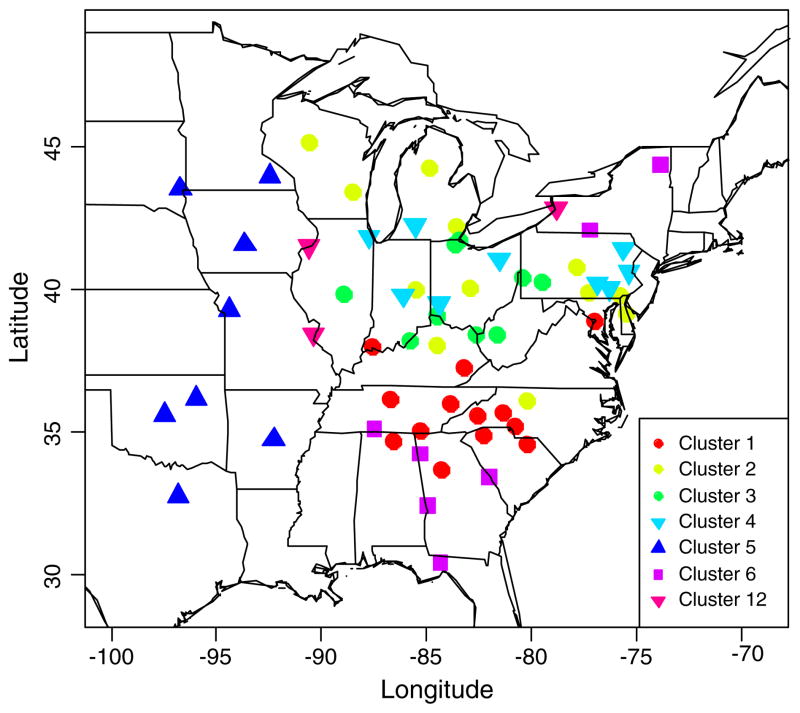
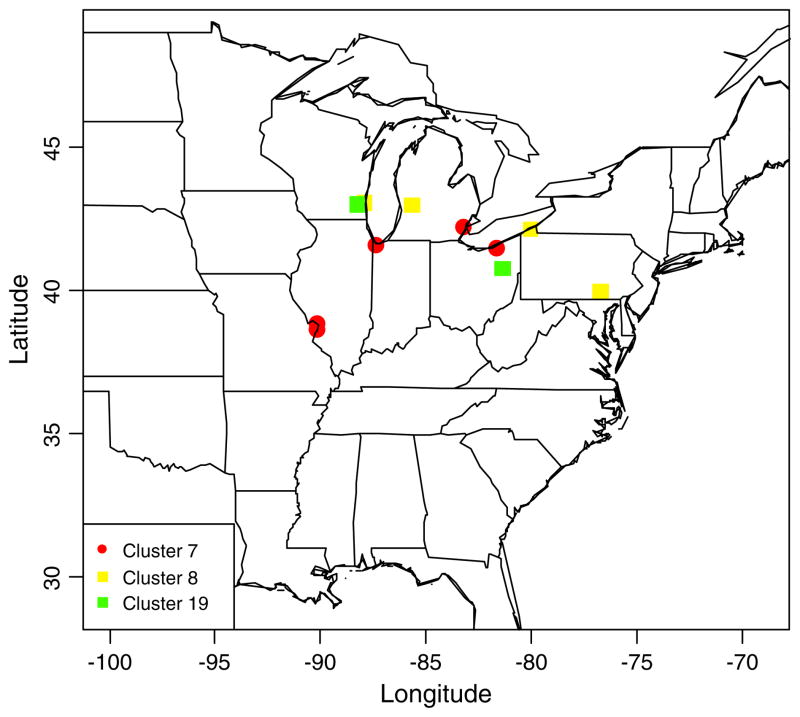
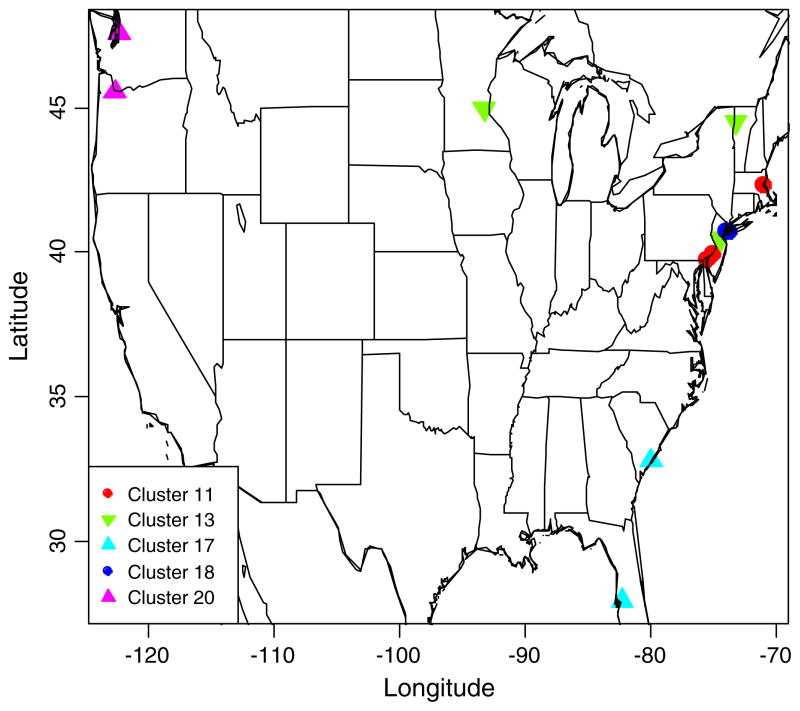
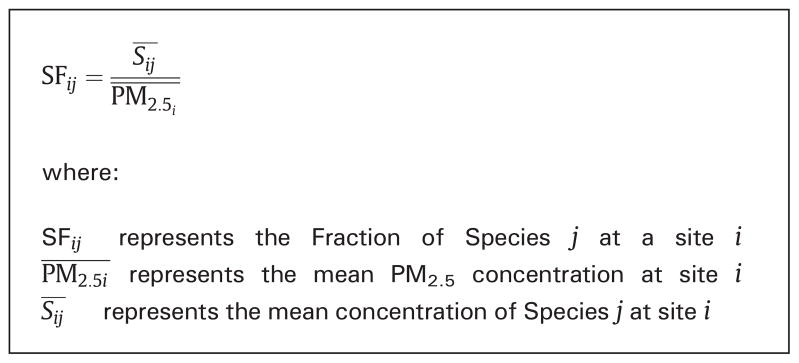
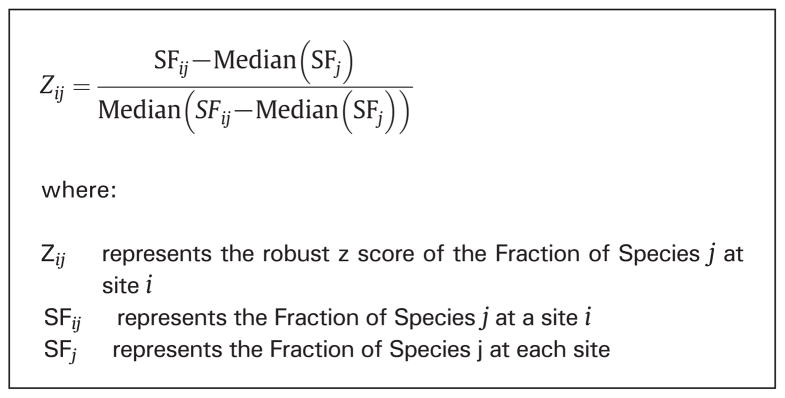
Methods: 109 monitoring sites with 75% reported speciation data during the period 2003-2008 were selected. These sites were categorized based on their average PM2.5 composition over the study period using k-means cluster analysis. The obtained clusters were validated and characterized based on their physico-chemical characteristics, geographic locations, emissions profiles, population density and proximity to major emission sources.
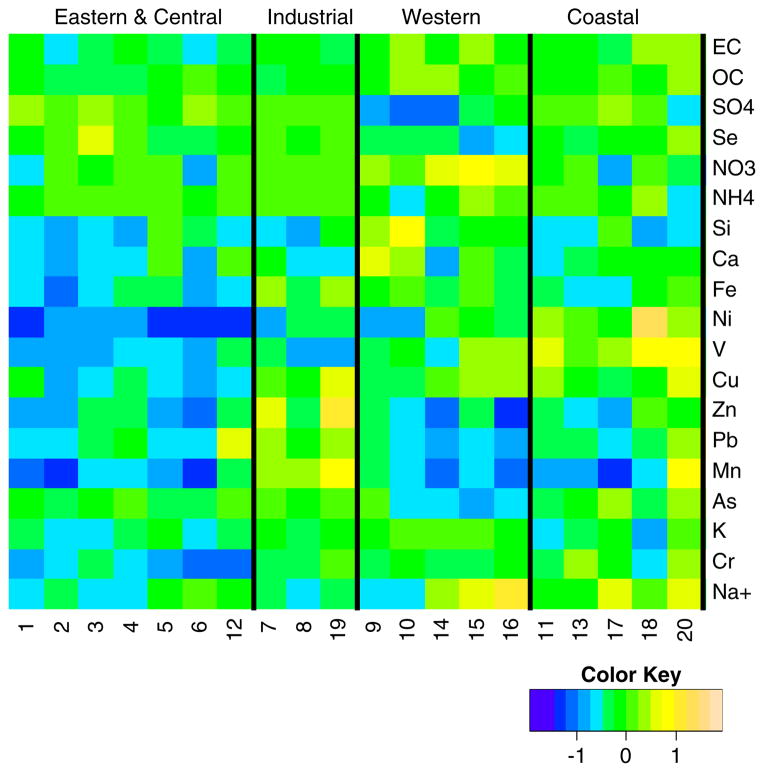
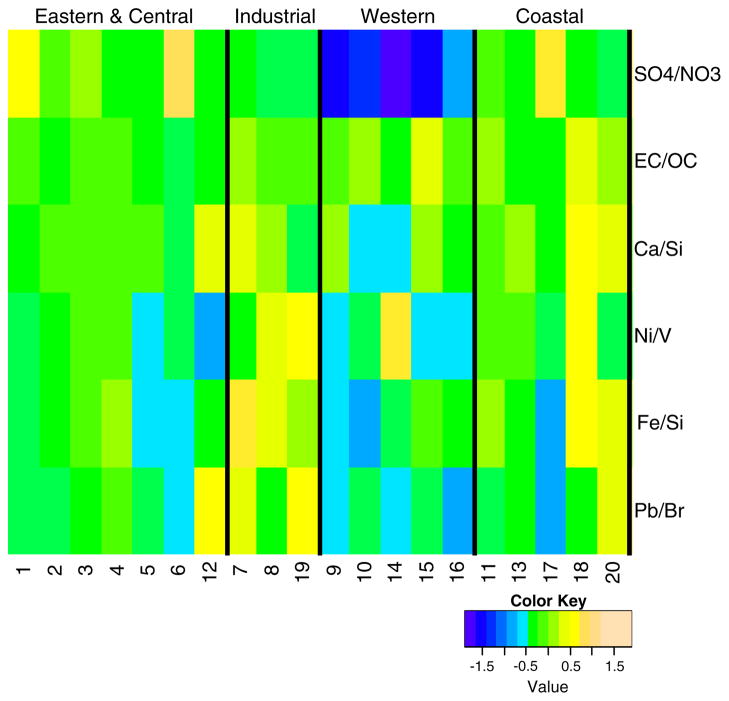
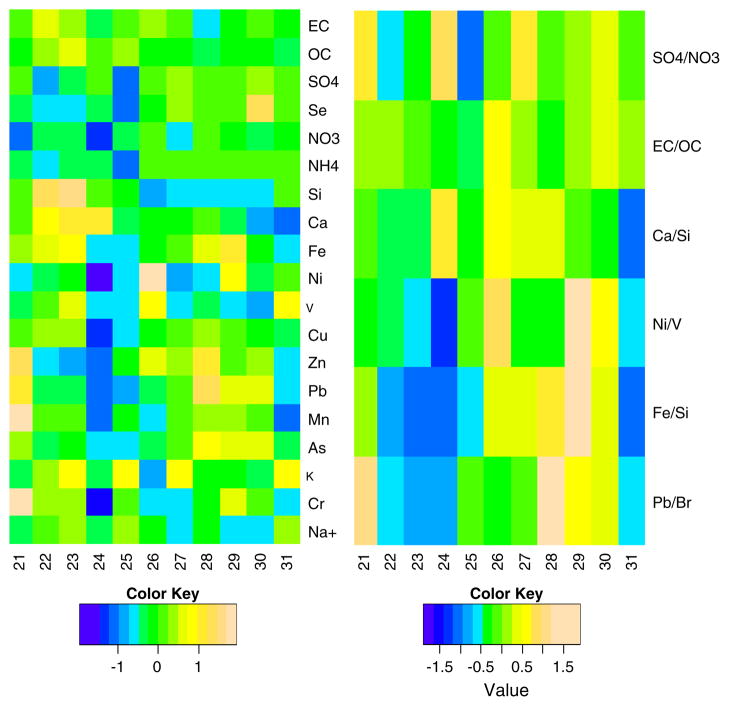
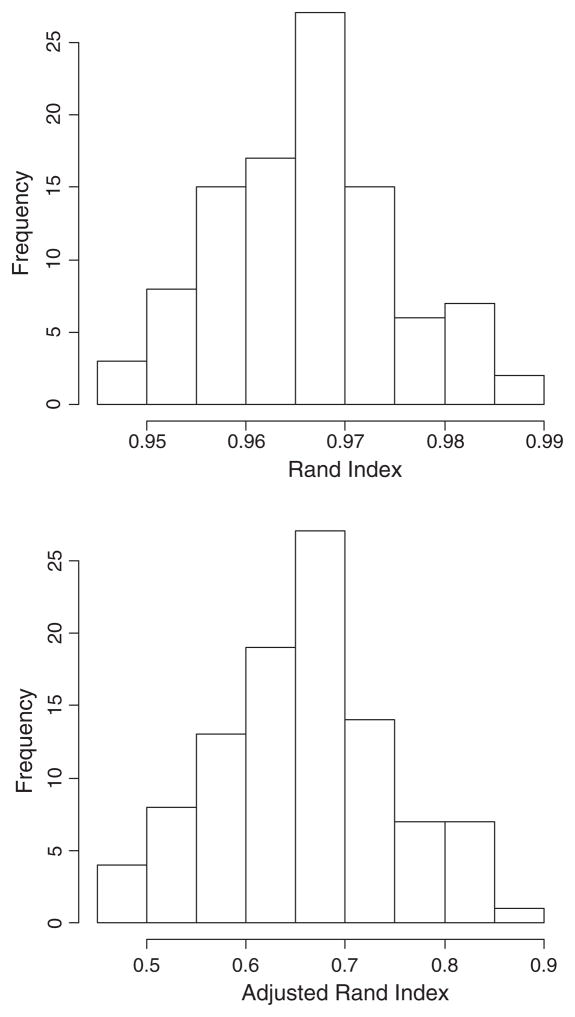
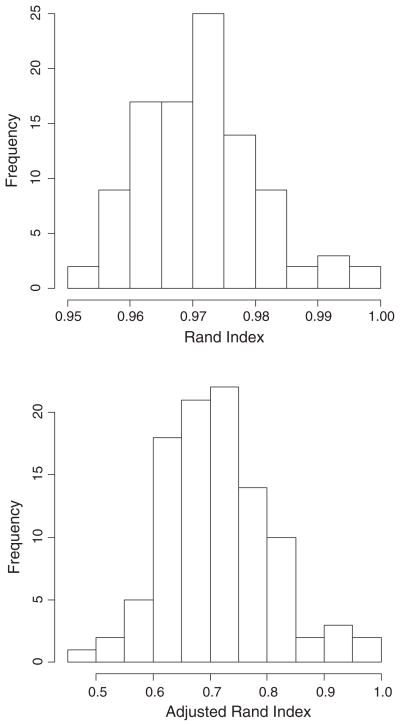
Results: Overall 31 clusters were identified. These include 21 clusters with 2 or more sites which were further grouped into 4 main types using hierarchical clustering. The resulting groupings are chemically meaningful and represent broad differences in emissions. The remaining clusters, encompassing single sites, were characterized based on their particle composition and geographic location.
Conclusions: The framework presented here provides a novel tool which can be used to identify and further classify sites based on their PM2.5 composition. The solution presented is fairly robust and yielded groupings that were meaningful in the context of air-pollution research.
Keywords: AQS; Air Quality Standards; Air pollution profiles; CPC; Cluster analysis; Condensation Particle Counter; EC; EPA; Effect modification; Elemental Carbon; Environmental Protection Agency; Multi-pollutant mixtures; NAS; National Academies of Science; OC; Organic Carbon; PM(2.5); Particle matter with a diameter of 2.5 μm or less; k-Means.
Copyright © 2013 Elsevier Ltd. All rights reserved.
Figures


References
-
- Adame J, Notario A, Villanueva F, Albaladejo J. Application of cluster analysis to surface ozone, NO2 and SO2 daily patterns in an industrial area in Central-Southern Spain measured with a DOAS system. Sci Total Environ. 2012;429:281–91. - PubMed
-
- Agrawal H, Malloy QGJ, Welch WA, Wayne Miller J, Cocker DR. In-use gaseous and particulate matter emissions from a modern ocean going container vessel. Atmos Environ. 2008;42:5504–10.
-
- Ault AP, Gaston CJ, Wang Y, Dominguez G, Thiemens MH, Prather KA. Characterization of the single particle mixing state of individual ship plume events measured at the port of Los Angeles. Environ Sci Technol. 2010;44:1954–61. - PubMed
-
- Beaver S, Palazoglu A. A cluster aggregation scheme for ozone episode selection in the San Francisco, CA Bay Area. Atmos Environ. 2006;40:713–25.
Publication types
MeSH terms
Substances
Grants and funding
LinkOut - more resources
Full Text Sources
Other Literature Sources
Medical
Research Materials
