. 2013 Aug 7;79(3):567-78.
doi: 10.1016/j.neuron.2013.06.008. Epub 2013 Jul 11.

Motor cortex feedback influences sensory processing by modulating network state

Affiliations

Motor cortex feedback influences sensory processing by modulating network state

Edward Zagha et al. Neuron. .

Abstract

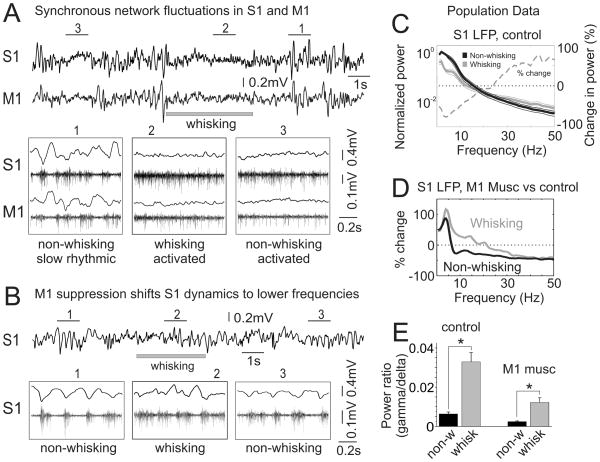
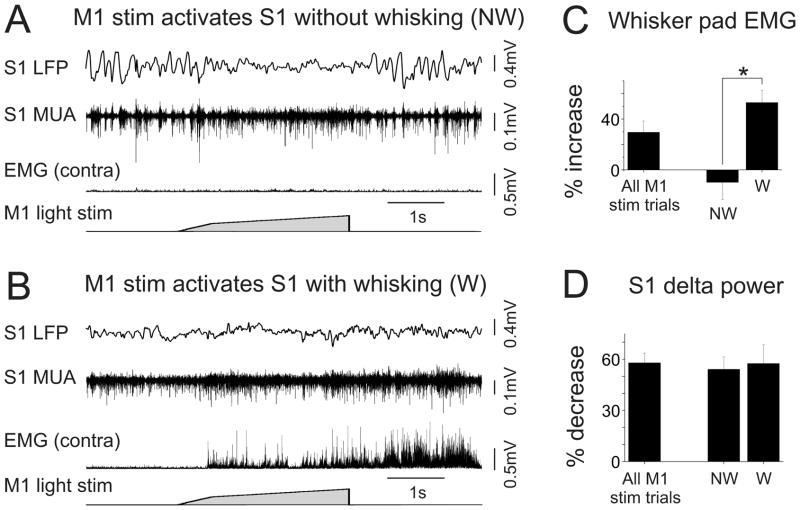
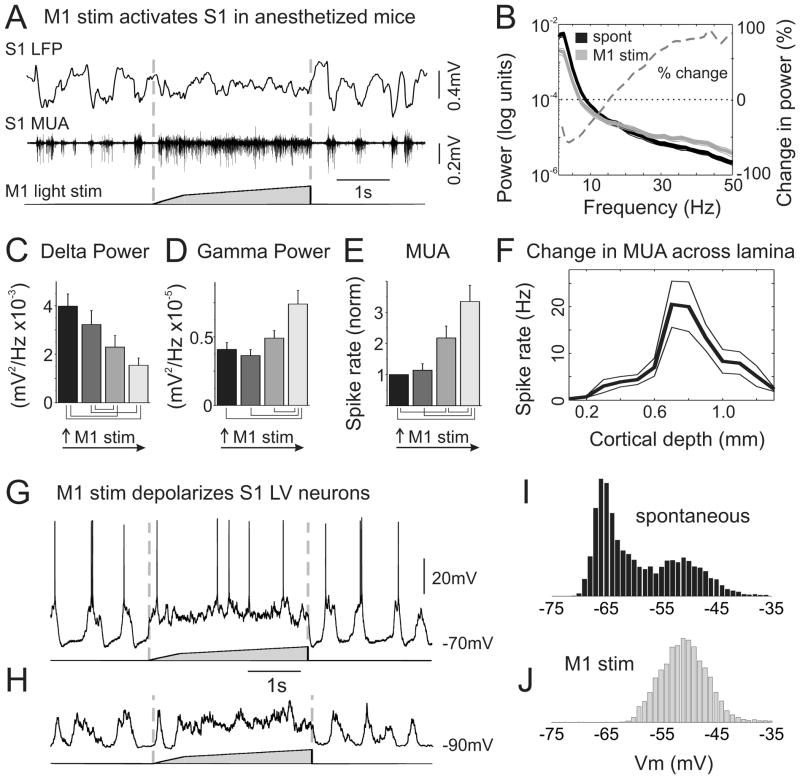
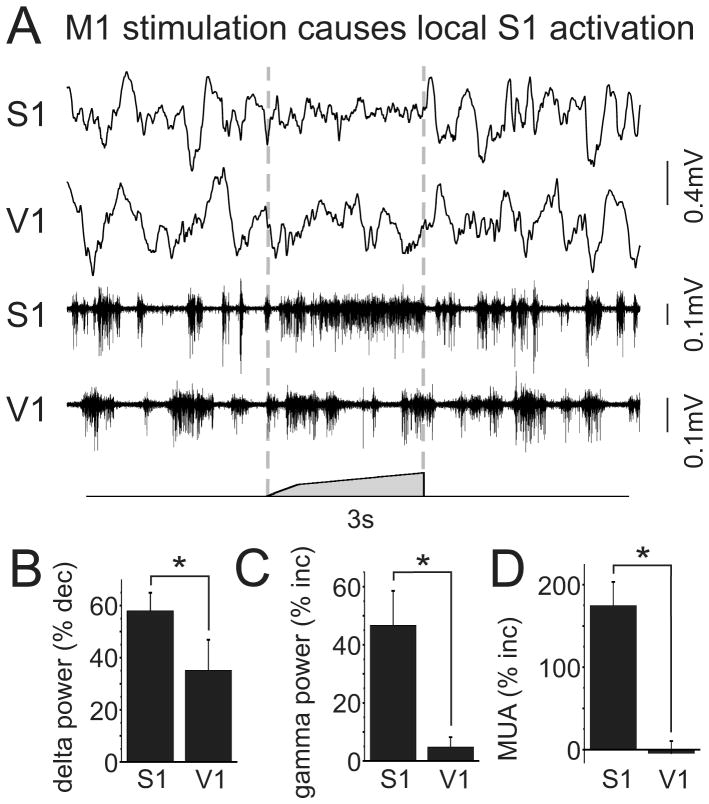
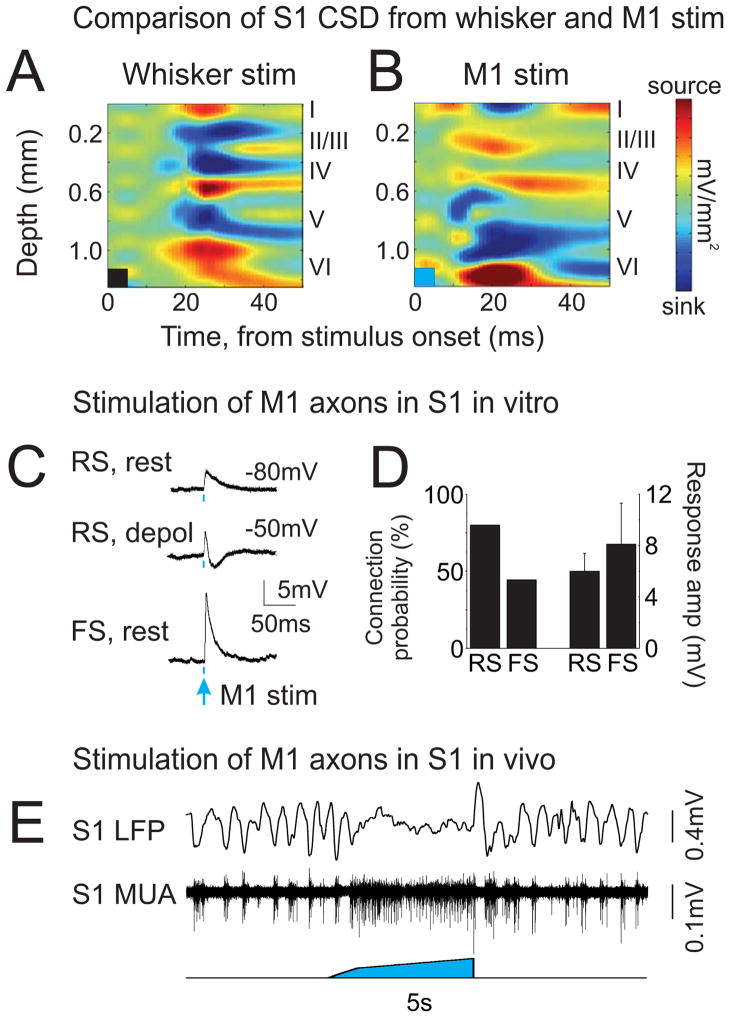
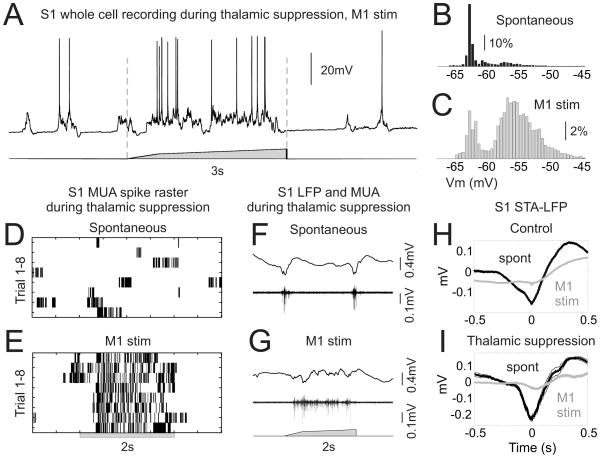
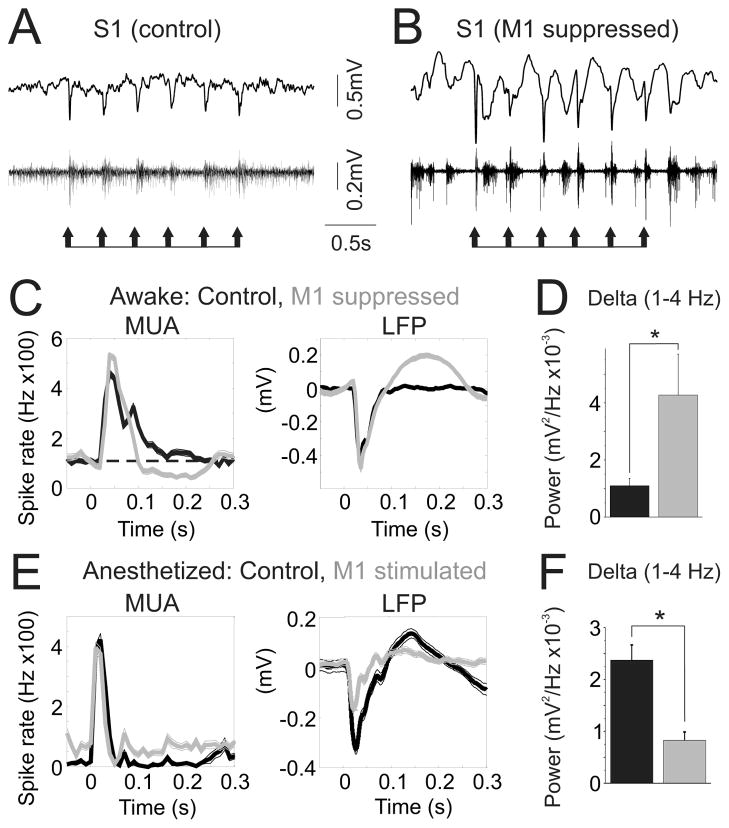
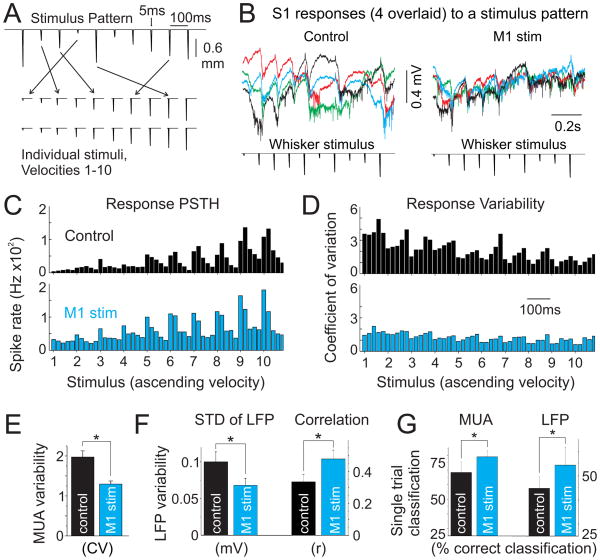
Long-range corticocortical communication may have important roles in context-dependent sensory processing, yet we know very little about how these pathways influence their target regions. We studied the influence of primary motor cortex activity on primary somatosensory cortex in the mouse whisker system. We show that primary motor and somatosensory cortices undergo coherent, context-dependent changes in network state. Moreover, we show that motor cortex activity can drive changes in somatosensory cortex network state. A series of experiments demonstrate the involvement of the direct corticocortical feedback pathway, providing temporally precise and spatially targeted modulation of network dynamics. Cortically mediated changes in network state significantly impact sensory coding, with activated states increasing the reliability of responses to complex stimuli. By influencing network state, corticocortical communication from motor cortex may ensure that during active exploration the relevant sensory region is primed for enhanced sensory discrimination.


Figures

Figure 1
Figure 1. Suppressing vM1 in waking mice shifts S1 network dynamics to lower frequencies
(A) Top traces, simultaneous LFP recordings in S1 (top) and vM1 (bottom) in a head-fixed, waking mouse. A period of spontaneous whisking is noted by the gray bar. Bottom traces, expanded regions of above, showing LFP (top) and MUA (bottom) for both S1 and vM1 recordings. Note activated network dynamics in S1 and vM1 associated with both whisking and non-whisking periods, and slow rhythmic dynamics during non-whisking. (B) Layout as above, recording from the same S1 site during focal vM1 suppression by local muscimol injection. LFP and MUA display enhanced slow rhythmic features, during both whisking and non-whisking. (C–E) Population data, analyses of S1 LFP signals, parsed into whisking (gray) and non-whisking (black) periods. (C) Normalized S1 LFP power spectra during control conditions, comparing whisking and non-whisking; thick lines are mean, thin lines +/− standard error. The gray dashed line is percent change [100*(whisking-non)/non], referencing scales at the right border of the graph. Dotted black lines [C,D] indicate zero change in power. (D) Changes in the S1 LFP power spectra comparing control and vM1 muscimol conditions [100*(muscimol-control)/control], for whisking and non-whisking periods. Positive-going changes indicate increased power during vM1 suppression. (E) Comparisons of S1 LFP gamma/delta power ratio for control (left) and vM1 muscimol (right) conditions. In both conditions whisking increased the gamma/delta ratio, although vM1 suppression significantly impacted the range of modulation. Bar graphs (in all figures) are mean +/− standard error. *, p<0.01. See also Supplemental Figure 1.
Figure 2
Figure 2. vM1 stimulation in waking mice modulates whisking activity and S1 state
(A,B) LFP and MUA recordings from layer V of S1 in a head-fixed waking mouse while monitoring contralateral whisker pad EMG activity and delivering vM1 stimuli. (A) An example of vM1-evoked S1 activation in the absence of whisking. Note the return of slow, rhythmic network activity following stimulus offset. (B) An example of vM1-evoked S1 activation associated with whisking. In this trial whisking outlasted the vM1 stimulus, and the network remained activated throughout the whisking period. (C) Population data of whisker pad EMG signals during vM1 stimulation compared to spontaneous periods. The right bars depict the results from sorting vM1 responses into whisking (W) and non-whisking (NW) trials. (D) Population data of decreases in S1 LFP delta power during vM1 stimulation compared to spontaneous periods. vM1 stimulation caused similar decreases in S1 delta power in whisking and non-whisker trials. *, p<0.05.
Figure 3
Figure 3. vM1 stimulation in anesthetized mice activates S1
(A) Example recording from LV of S1, showing LFP (top) and MUA (middle) in response to a three second vM1 light stimulus (bottom). Note that the slow oscillations, present immediately before and after the stimulus, are disrupted throughout the vM1 stimulation. (B) Population average power spectra from S1 recordings of spontaneous activity (black) and during vM1 stimulation (gray). Gray dashed line is the percent change in power [100*(stim-spont)/spont] demonstrating reduced power at delta frequencies and increased power at gamma frequencies with vM1 stimulation. Dotted black line indicates zero power change. (C–E) Population data, comparing spontaneous S1 activity (black) to responses from increasing intensities of vM1 light stimulation. Note graded changes in delta power (C), gamma power (D) and MUA (E). Lines below bar graphs denote differences of statistical significance from Tukey post-hoc pairwise comparisons, p<0.05. (F) Population data from laminar multielectrode recordings, showing S1 spike rate increases across all layers during S1 activation. Spontaneous spike rates have been subtracted to isolate vM1-evoked activity. (G) A whole cell current clamp recording from a layer V S1 neuron, in response to a three second vM1 stimulus. vM1 stimulation produced a sustained depolarization with high frequency membrane potential fluctuations. (H) Same recording as above, hyperpolarized by DC to eliminate spiking. (I,J) Vm histograms of the neuron shown in [G], during spontaneous periods (I) and during vM1 stimulation (J). See also Supplemental Figure 2.
Figure 4
Figure 4. vM1 stimulation causes local S1 activation
(A) Simultaneous recordings conducted in layer V of S1 and V1 while stimulating vM1. vM1 stimulation caused robust S1 activation concurrent with modest changes in V1. (B–D) Population data, comparing changes in S1 and V1 delta power (B), gamma power (C) and multiunit spiking (D). *, p<0.05.
Figure 5
Figure 5. Evidence for involvement of the cortico-cortical feedback pathway
(A,B) CSD plots of average S1 responses from an example experiment. Brief (5 ms) deflections of the principal whisker (A) evoked onset current sinks in layers IV, II/III and V and current sources in layers I and VI. Brief (5 ms) vM1 stimuli (B) evoked onset current sinks in layers V, VI and layer I and current sources in layers II/III. Stimulus durations are depicted by the colored boxes in the bottom left of each plot. Color scales are +/−10 mV/mm2 for whisker stimuli and +/−5 mV/mm2 for vM1 stimuli. (C) Synaptic responses from layer V S1 neurons in vitro, evoked by stimulating axons and terminals of vM1 neurons in S1. The 2 ms light pulses are indicated by blue dots below traces. Responses from a regular spiking neuron (RS), consisting of a short latency EPSP at rest (top), and an EPSP-IPSP sequence (middle) when depolarized to just below spike threshold. Bottom, EPSP from a fast spiking neuron (FS) at rest. (D) Population data, quantifying connection probabilities (left) and response amplitudes (right) from vM1 inputs onto regular spiking and fast spiking neurons in S1. (E) In vivo S1 response to stimulation of vM1 axons in S1. Limiting direct stimulation to the cortico-cortical vM1 axons was sufficient to evoke S1 activation. See also Supplemental Figure 3.
Figure 6
Figure 6. vM1 modulation of S1 activity does not require thalamocortical transmission
(A) A whole cell current clamp recording from a layer V S1 neuron, in response to a three second vM1 stimulus during thalamic suppression. Note the presence of prolonged hyperpolarized periods (Down states) in the spontaneous activity due to thalamic suppression, and the robust depolarization produced by vM1 stimulation. (B,C) Vm histograms of the neuron shown in [A], during spontaneous periods (B) and during vM1 stimulation (C). (D,E) S1 MUA spike rasters of spontaneous activity (D) and successive vM1 stimulation trials (E) during thalamic suppression. (F,G) Example data of S1 LFP (top) and MUA (bottom) during thalamic suppression for spontaneous activity (F) and in response to vM1 stimulation (G). (H,I) Spike-field relationships as calculated by the spike-triggered average of the LFP for spontaneous activity (black) and during vM1 stimulation (gray). Under both control (H) and thalamic suppression (I) conditions, vM1 stimulation abolished the phase-locking of spikes to the negative phase of the slow oscillation. See also Supplemental Figure 4.
Figure 7
Figure 7. vM1 modulates S1 responses to simple sensory stimuli
(A,B) Single trial S1 LFP (top) and MUA (middle) responses to brief (10 ms) whisker stimuli in waking mice, before (A) and during (B) focal vM1 suppression. Stimuli are indicated by the arrows below the traces. (C) Average MUA (left) and LFP (right) responses to whisker stimuli for control (black) and vM1 suppression (gray) conditions from one experiment. The dashed line (C, left) indicates baseline firing rates. (D) Population data, S1 LFP delta power during sensory responses in control (black) and vM1 suppression (gray) conditions. (E–F) Experiments in anesthetized mice, pairing brief deflections of the principal whisker with vM1 stimulation. (E) Average MUA (left) and LFP (right) responses to whisker stimuli for control (black) and vM1 stimulation (gray) trials from one experiment. (F) Population data, S1 LFP delta power during sensory responses in control (black) and vM1 stimulation (gray) conditions. *, p<0.05.
Figure 8
Figure 8. vM1 stimulation enhances S1 representation of complex stimuli
(A) Top, example stimulus pattern, consisting of 10 randomly ordered rapid deflections of the principal whisker delivered at 10 Hz. Bottom, resorting of stimulus patterns into individual stimuli according to velocity, which was used for CV analyses. (B) Single trial examples of raw data (0.3 Hz-5 kHz) from one experiment, showing four overlaid responses to the same whisker stimulus pattern (bottom) during control (left) and vM1 stimluation (right) conditions. (C) Multiunit spike histograms (20 msec bins) from the experiment in [B] in response to all whisker velocities, re-ordered from smallest [1] to largest [10] velocity, for control (black, top) and vM1 stimulation (blue, bottom) trials. Stimulus numbers along the x-axis are positioned at the onset of each whisker stimulus. (D) Corresponding CV for data shown in [C]. Note the reduced variability in MUA responses when paired with vM1 stimulation (bottom), particularly for smaller amplitude sensory stimuli. (E–G) Population data, comparing control (black) and vM1 stimulation (blue) trials. (E) MUA variability, calculated as the CV of MUA responses across all stimuli. (F) LFP variability, calculated as the mean standard deviation throughout the response period (left) and the mean correlation from pair-wise comparisons of individual trials (right). (G) Correct classification percentages from linear discriminant analyses of MUA (left) and LFP (right) stimulus pattern responses. Chance is 12.5% correct classification. *, p<0.05. See also Supplemental Figure 5.

Comment in

Similar articles

Cited by

References

    1. Arieli A, Sterkin A, Grinvald A, Aertsen A. Dynamics of ongoing activity: explanation of the large variability in evoked cortical responses. Science. 1996;273:1868–1871. - PubMed
    1. Berger H. Ueber das Elektroenkephalogramm des Menschen. Arch Psychiatr Nervenkrankh. 1929;87:527–570.
    1. Borisovska M, McGinley MJ, Bensen A, Westbrook GL. Loss of olfactory cell adhesion molecule reduces the synchrony of mitral cell activity in olfactory glomeruli. J Physiol. 2011;589:1927–1941. - PMC - PubMed
    1. Brecht M. Movement, confusion, and orienting in frontal cortices. Neuron. 2011;72:193–196. - PubMed
    1. Buzsaki G. Rhythms of the brain. New York: Oxford University Press; 2006.

Publication types

MeSH terms

LinkOut - more resources