Review
. 2013 Sep 2;587(17):2753-66.
doi: 10.1016/j.febslet.2013.07.012. Epub 2013 Jul 12.

A century of enzyme kinetic analysis, 1913 to 2013

Affiliations
Review

A century of enzyme kinetic analysis, 1913 to 2013

Kenneth A Johnson. FEBS Lett. .

Abstract

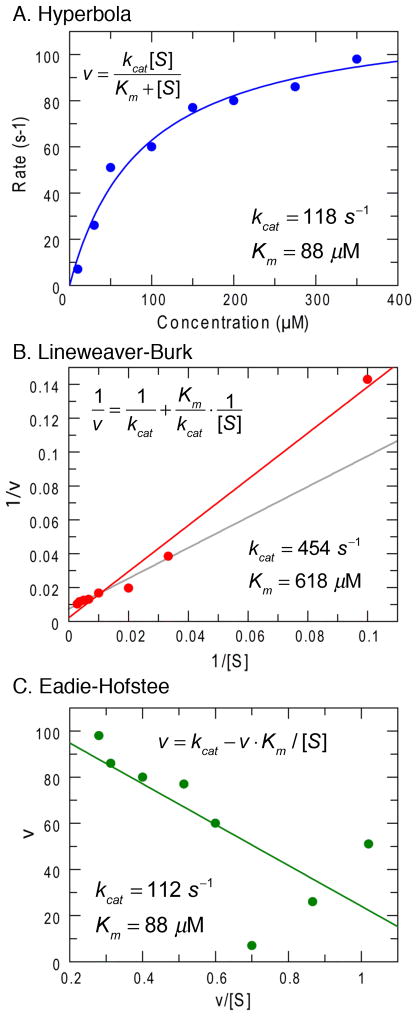
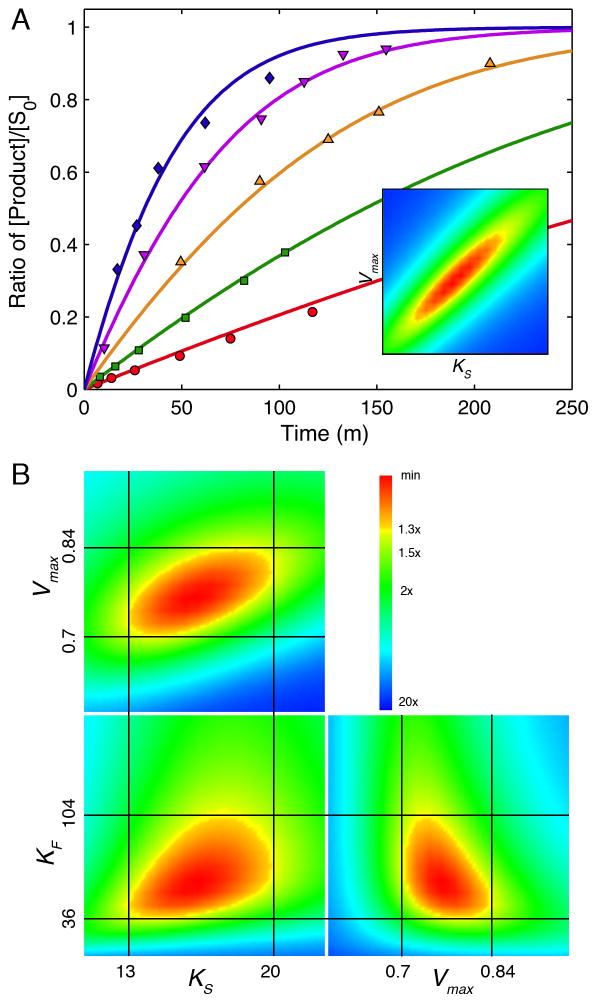
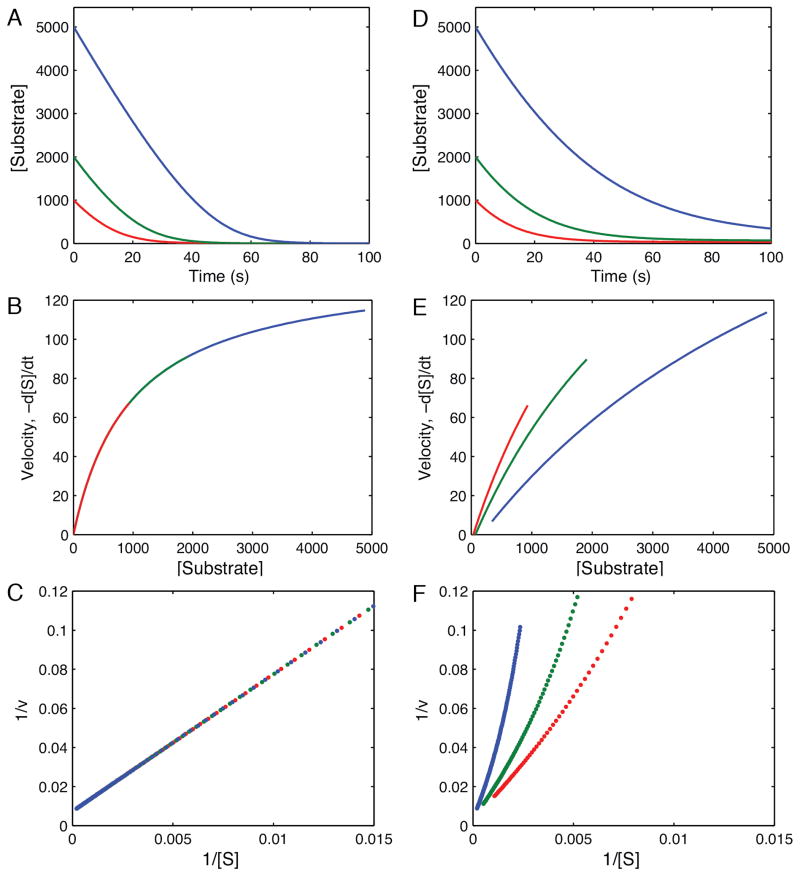
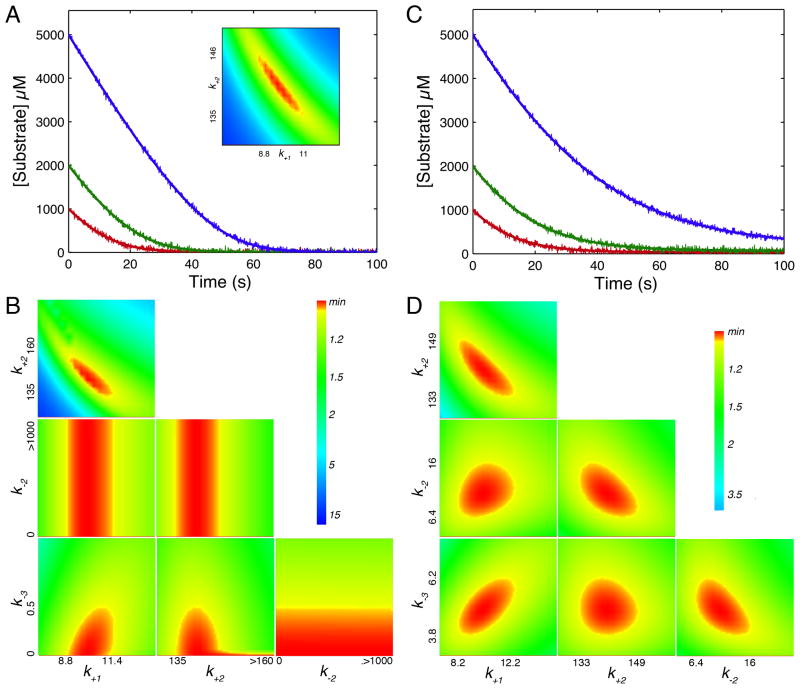
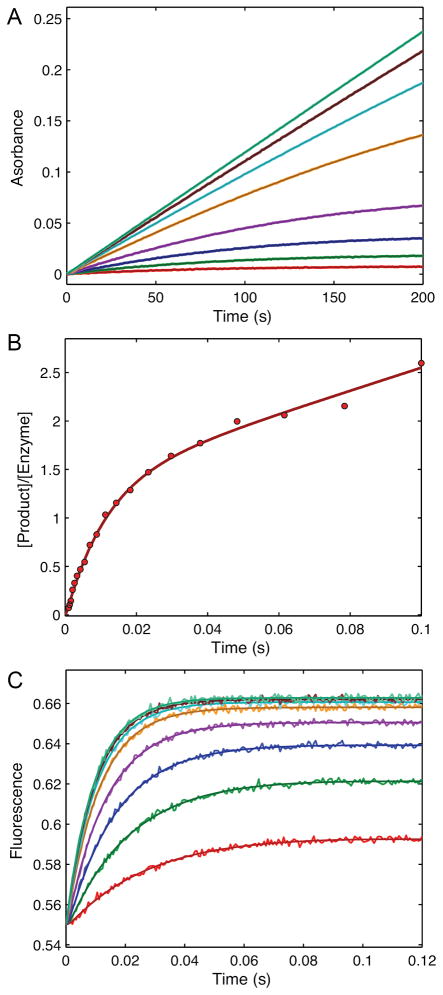
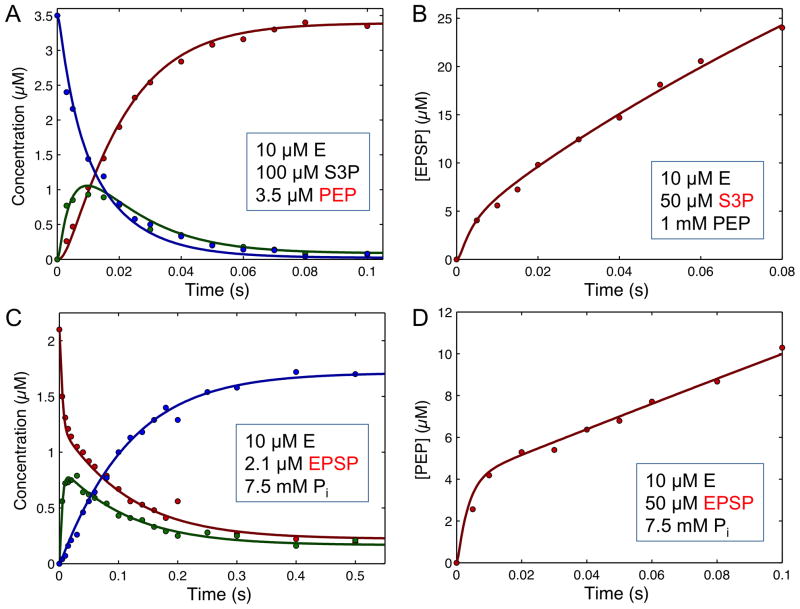
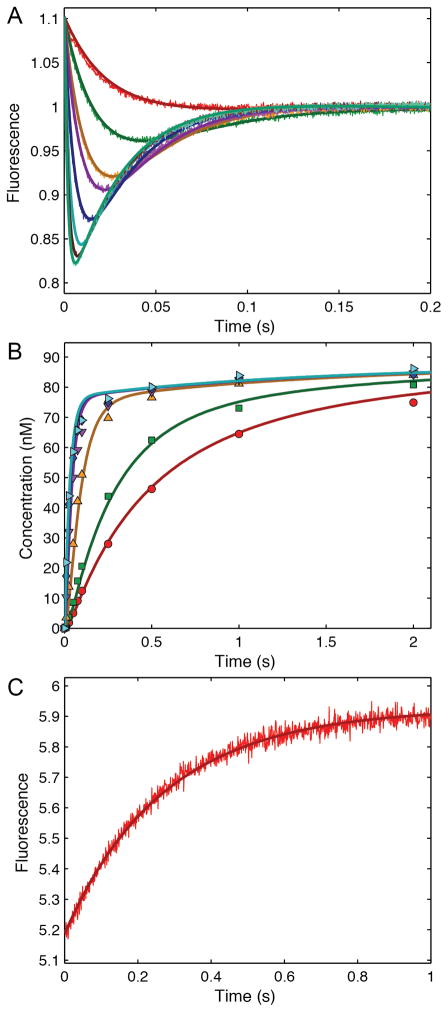
This review traces the history and logical progression of methods for quantitative analysis of enzyme kinetics from the 1913 Michaelis and Menten paper to the application of modern computational methods today. Following a brief review of methods for fitting steady state kinetic data, modern methods are highlighted for fitting full progress curve kinetics based upon numerical integration of rate equations, including a re-analysis of the original Michaelis-Menten full time course kinetic data. Finally, several illustrations of modern transient state kinetic methods of analysis are shown which enable the elucidation of reactions occurring at the active sites of enzymes in order to relate structure and function.

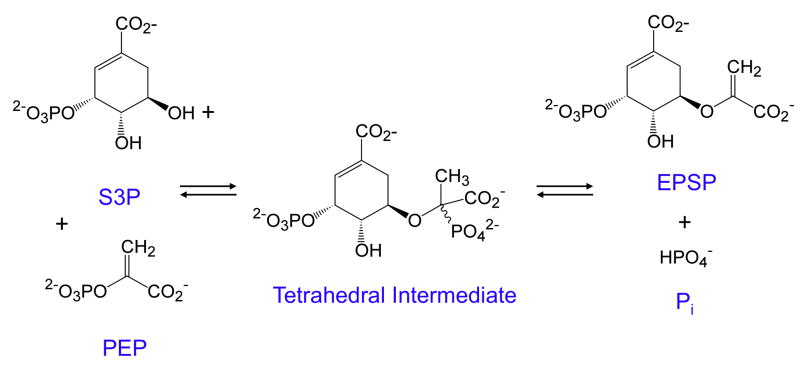
Keywords: 5-enoylpyruvoylshikimate-3-phosphate; 7-diethylamino-3-[([(2-maleimidyl)ethyl]amino)carbonyl]coumarin; Computer simulation; EPSP; Enzyme kinetics; Global data fitting; HIV reverse transciptase; HIVRT; MDCC; Michaelis–Menten; S3P; shikimate 3-phosphate.


Conflict of interest statement

Financial Conflict of Interest: K. A. Johnson is the President of KinTek Corporation, which sells licenses for a professional version of KinTek Explorer software and instruments for transient kinetic analysis.

Figures

Figure 1
Figure 1. Comparison of three methods of fitting data to the Michaelis-Menten equation
A. Data fit by nonlinear regression to a hyperbola. B. Data fit to a Lineweaver-Burk reciprocal plot. The gray line shows the fit obtained after omitting the point at the lowest substrate concentration. C. Data fit using the Eadie-Hofstee equation. In each figure, the equation and the resulting kcat and Km values are displayed.
Figure 2
Figure 2. Global analysis of Michaelis-Menten 1913 data
A: the original Michaelis-Menten data are shown with the results of global fitting. The ratio of product formed (fructose or glucose ) divided by the starting substrate concentration is shown as a function of time for various starting sucrose concentrations (20.8, 41.6, 83, 167 and 333 mM). The smooth lines are drawn based on numerical integration of rate equations derived from Scheme 1 using the rate constants summarized in Table 1 and an enzyme concentration of 25 nM. The Inset shows the confidence contours for a fit involving only two variables to define Vmax and KS. B: Confidence contour analysis showing the dependence of χ2 on each pair-wise combination of three constants (KS, Vmax, and KF, defined by k−1, k+2 and k+5 respectively, according to Scheme 1). The index for the color coded display of χ2 values relative to the minimum are given by the inset. The central red area defines parameters yielding an acceptable fit. Upper and lower error limits for each parameter are obtained from a threshold defined by a 1.3-fold increase in χ2 over the minimum (11), and are designated by the thin black lines and the values listed on each axis.
Figure 3
Figure 3. Simulation and deconvolution of progress curves
A. Progress curves calculated at three starting substrate concentrations (5000, 3000 and 1000 μM) for a simple irreversible enzyme catalyzed reaction (Scheme 2) and showing the decrease in substrate concentration over time. B. The first derivative was calculated from the slope at each time in A, and plotted as a function of the remaining substrate concentration in B, where the data fit a hyperbola. C. The data shown in B are graphed as a Lineweaver-Burke plot, showing a straight line dependence, and demonstrating reduction of the data to a function of only two parameters. D. A set of progress curves for a fully reversible enzyme-catalyzed reaction. E. Analysis of the instantaneous rate as a function of remaining substrate concentration from D shows deviation from a simple hyperbolic relationship. F. Attempts analyze the substrate concentration dependence of the rate on a Lineweaver-Burke plot show deviations from linearity. Simulations were performed using the rate constants summarized in Table 2 according to Scheme 2 and an enzyme concentration of 1 μM.
Figure 4
Figure 4. Understanding progress curve kinetics
A. Synthetic data were generated according to Scheme 2 using the rate constants in Table 2 for an irreversible model. The data were then fit by nonlinear regression to the model with four variable rate constants to get the confidence contours shown in B. The inset to figure A shows the confidence contour obtained with only two variable parameters. C. Synthetic data were generated using the rate constants in Table 2 for a fully reversible model and then fit to generate the confidence contours shown in D. All synthetic data were generated with random error following a normal distribution with a sigma value of 50 (1% of the maximum signal), and using an enzyme concentration of 1 μM. The axes labels on the confidence contour plots show the upper and lower limits for each rate constant defined by a 1.05 threshold in χ2 as described (11). All computations were performed using KinTek Explorer (12).
Figure 5
Figure 5. Information content of kinetic data
This figure shows synthetic data designed to illustrate the information content of various kinetic experiments. A. Steady state kinetics with 0.5 μM enzyme reacting with 0.2, 0.5, 1, 2, 5, 10, 20, and 50 μM substrate. The signal was observed as absorbance due to product with an extinction coefficient of 0.04 μM−1, such that the observable signal is equal to 0.04*[P]. B. Presteady state burst experiment simulated with 2 μM enzyme mixed with 50 μM substrate. The observable signal is the sum of [EP] + [P]. C. A stopped-flow fluorescence signal was simulated with 1 μM enzyme mixed with 2, 5, 10, 20, 50, 100, 200, and 500 μM substrate. The signal, as simulated and derived independently during data fitting was defined by f1*([E] + f2*[ES] + f3*[EP]), indicated that the protein fluorescence change was due to conformational changes occurring with the formation of product. The fluorescence scaling factors derived to be: f1 = 0.55 and f2 = 1 and f3 = 1.26, indicating a 26% increase in fluorescence with chemistry, but no change upon substrate binding. The smooth curves through the data were calculated by simulation from the global fit to the data according to Scheme 2 and the rate constants listed in Table 3. Individual fits to experiments A and B were indistinguishable visually from the global fits shown here and are not shown. Data and simulation are available in the “3_experiments.mec” file in the examples folder of the free student version of KinTek Explorer that can be downloaded at www.kintek-corp.com.
Figure 6
Figure 6. Reaction catalyzed by EPSP synthase
The reaction is shown in which S3P (shikimate 3-phosphate) reacts with PEP (phosphoenolpyruvate) to form EPSP (5-enoylpyruvoylshikimate-3-phosphate) and phosphate.
Figure 7
Figure 7. EPSP presteady-state and single turnover kinetics
A. Single turnover in the forward direction. B. Presteady state burst in the forward direction. C. Single turnover of the reaction in the reverse direction. D. Presteady state burst in the reverse direction. The inset to each figure gives the starting concentration of reach reactant, and the species shown in red contains the radiolabel. Redrawn with permission from (34). The smooth lines were calculated by simulation according to the pathway and rate constants given in Scheme 3. Data and simulations are available in the “EPSP.mec” KinTek Explorer example file.
Figure 8
Figure 8. Structure of fluorescently labeled HIVRT
The structure of HIVRT was rendered in pymol from 1rtd.pdb (39). The position of the fluorescent label (magenta spheres) was docked at the position of the E36C substitution (24). Duplex DNA is in blue (template) and green (primer), while the incoming nucleotide is magenta (sticks).
Figure 9
Figure 9. HIVRT kinetics
A. Fluorescently labeled HIVRT in complex with duplex DNA (200nM MDCC-labeled HIVRT with 300 nM DNA) was mixed with various concentrations of TTP (2, 4, 10, 20, 40, 60, 80, and 100 μM) in a stopped-flow and the time course of fluorescence was recorded. B. Rapid quench-flow methods were used to measure the time dependence of the chemical reaction after mixing the HIVRT-DNA complex (150nMMDCC-labeled HIVRT with 100nM DNA) with various concentrations of TTP (0.25, 0.5, 2, 10, 25, and 100 μM). Redrawn with permission from (38). Smooth curves show the global fit to all of the date according to Scheme 4.
Scheme 1
Scheme 1
Scheme 2
Scheme 2
Scheme 3
Scheme 3
Scheme 4
Scheme 4

References

    1. Michaelis L, Menten ML. Die Kinetik der Invertinwirkung. Biochemische Zeitschrift. 1913;49:333–369.
    1. Johnson KA, Goody RS. The original Michaelis constant: translation of the 1913 Michaelis-Menten paper. Biochemistry. 2011;50:8264–8269. - PMC - PubMed
    1. Goody RS, Johnson KA. The Kinetics of Inverase Action: translation of 1913 paper by Leonor Michaelis and Maud Menten. Biochemistry. 2011 http://pubs.acs.org/doi/suppl/10.1021/bi201284u. - DOI - PMC - PubMed
    1. Sainz-Polo MA, Ramirez-Escudero M, Lafraya A, Gonzalez B, Marin-Navarro J, Polaina J, Sanz-Aparicio J. Three-dimensional structure of Saccharomyces invertase: role of a non-catalytic domain in oligomerization and substrate specificity. The Journal of biological chemistry. 2013;288:9755–9766. - PMC - PubMed
    1. Henri V. Lois générales de l’action des diastases. Hermann; Paris: 1903.

Publication types