

Resting-state fMRI connectivity impairment in schizophrenia and bipolar disorder
- PMID: 23851068
- PMCID: PMC3885301
- DOI: 10.1093/schbul/sbt092
Resting-state fMRI connectivity impairment in schizophrenia and bipolar disorder
Abstract
Background: Schizophrenia and bipolar disorder share aspects of phenomenology and neurobiology and thus may represent a continuum of disease. Few studies have compared connectivity across the brain in these disorders or investigated their functional correlates.
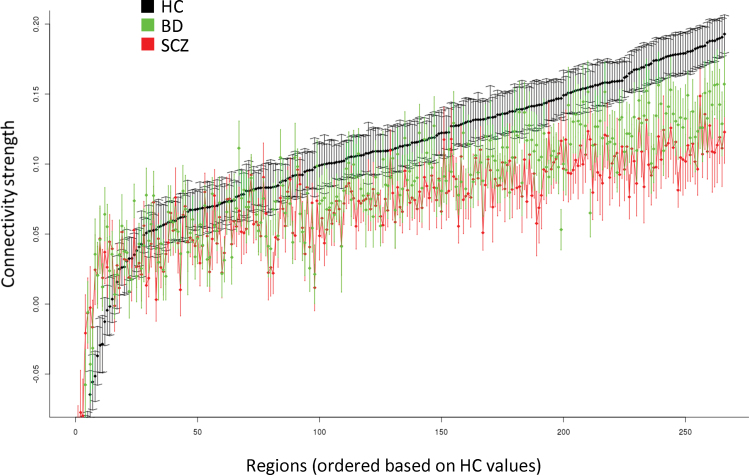
Methods: We used resting-state functional magnetic resonance imaging to evaluate global and regional connectivity in 32 healthy controls, 19 patients with bipolar disorder, and 18 schizophrenia patients. Patients also received comprehensive neuropsychological and clinical assessments. We computed correlation matrices among 266 regions of interest within the brain, with the primary dependent measure being overall global connectivity strength of each region with every other region.
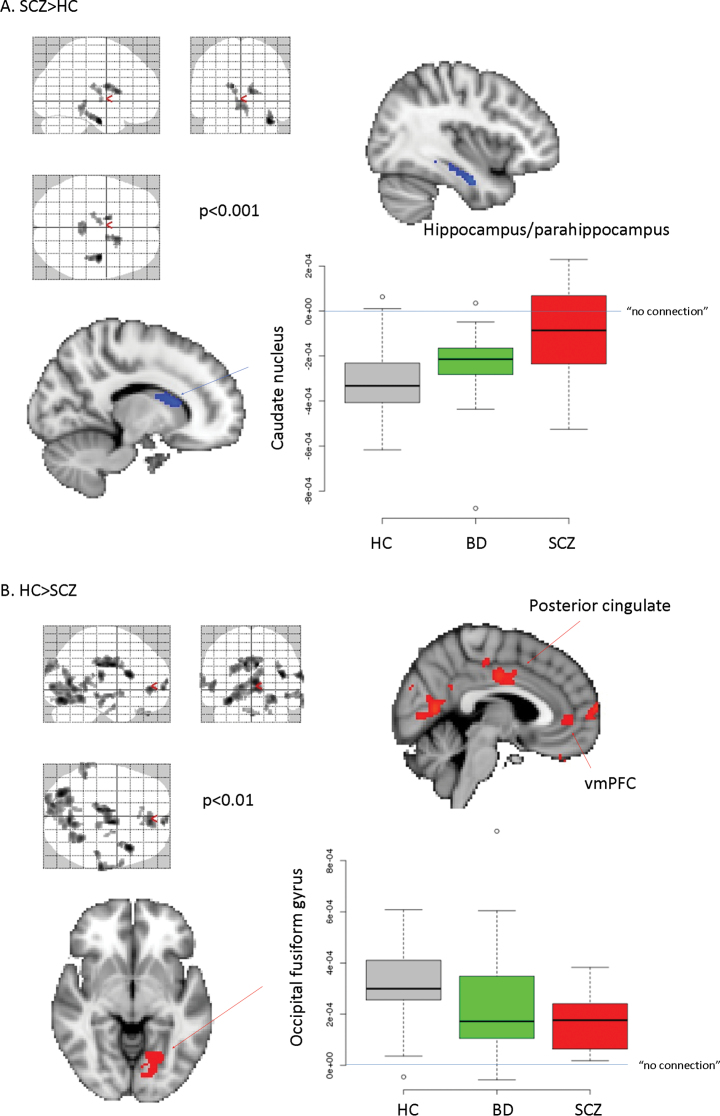
Results: Patients with schizophrenia had significantly lower global connectivity compared with healthy controls, whereas patients with bipolar disorder had global connectivity intermediate to and significantly different from those of patients with schizophrenia and healthy controls. Post hoc analyses revealed that compared with healthy controls, both patient groups had significantly lower connectivity in the paracingulate gyrus and right thalamus. Patients with schizophrenia also had significantly lower connectivity in the temporal occipital fusiform cortex, left caudate nucleus, and left thalamus compared with healthy controls. There were no significant differences among the patient groups in any of these regions. Lower global connectivity among all patients was associated with worse neuropsychological and clinical functioning, but these effects were not specific to any patient group.
Conclusions: These findings are consistent with the hypothesis that schizophrenia and bipolar disorder may represent a continuum of global disconnectivity in the brain but that regional functional specificity may not be evident.
Keywords: bipolar disorder; connectivity; resting-state fMRI; schizophrenia.
Figures
References
-
- Kraepelin E, Defendorf AR. Clinical Psychiatry: A Text-Book for Students and Physicians [abstracted and adapted from the 6th German ed. of Kraepelin’s “Lehrbuch der psychiatric”]. Norwood, MA: The Macmillan Company; 1904.
-
- American Psychiatric Association Diagnostic and Statistical Manual of Mental Disorders, Fourth Edition: DSM-IV-TR® Arlington, VA: American Psychiatric Association; 2000.
Publication types
MeSH terms
Grants and funding
LinkOut - more resources
Full Text Sources
Other Literature Sources
Medical
