. 2013 Oct;119(4):941-53.
doi: 10.1097/ALN.0b013e3182a05bd3.

Cyclosporine-inhibitable blood-brain barrier drug transport influences clinical morphine pharmacodynamics

Affiliations

Cyclosporine-inhibitable blood-brain barrier drug transport influences clinical morphine pharmacodynamics

Konrad Meissner et al. Anesthesiology. 2013 Oct.

Abstract

Background: The blood-brain barrier is richly populated by active influx and efflux transporters influencing brain drug concentrations. Morphine, a drug with delayed clinical onset, is a substrate for the efflux transporter P-glycoprotein in vitro and in animals. This investigation tested whether morphine is a transporter substrate in humans.

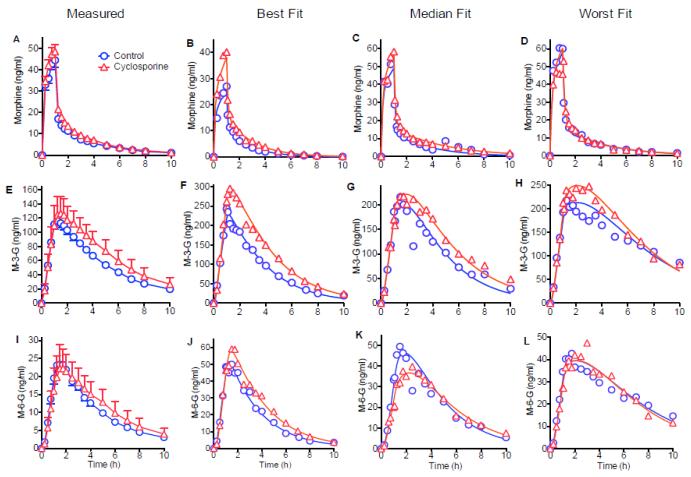
Methods: Fourteen healthy volunteers received morphine (0.1 mg/kg, 1-h IV infusion) in a crossover study without (control) or with the infusion of validated P-glycoprotein inhibitor cyclosporine (5 mg/kg, 2-h infusion). Plasma and urine morphine and morphine glucuronide metabolite concentrations were measured by mass spectrometry. Morphine effects were measured by miosis and analgesia.

Results: Cyclosporine minimally altered morphine disposition, increasing the area under the plasma morphine concentration versus time curve to 100 ± 21 versus 85 ± 24 ng/ml·h (P < 0.05) without changing maximum plasma concentration. Cyclosporine enhanced (3.2 ± 0.9 vs. 2.5 ± 1.0 mm peak) and prolonged miosis, and increased the area under the miosis-time curve (18 ± 9 vs. 11 ± 5 mm·h), plasma effect-site transfer rate constant (k(e0), median 0.27 vs. 0.17 h(-1)), and maximum calculated effect-site morphine concentration (11.5 ± 3.7 vs. 7.6 ± 2.9 ng/ml; all P < 0.05). Analgesia testing was confounded by cyclosporine-related pain.

Conclusions: Morphine is a transporter substrate at the human blood-brain barrier. Results suggest a role for P-glycoprotein or other efflux transporters in brain morphine access, although the magnitude of the effect is small, and unlikely to be a major determinant of morphine clinical effects. Efflux may explain some variability in clinical morphine effects.


Figures

Figure 1
Figure 1
Effects of cyclosporine on plasma concentrations of (A) morphine, (E) morphine-3-glucuronide (M-3-G), and (I) morphine-6-glucuronide (M-6-G) during and after a 1-h infusion of morphine (0.1 mg/kg) in subjects receiving nothing (controls, open circles) or a 2-h cyclosporine infusion (2.5 mg/kg/hr, begun 1 h before the morphine infusion, open triangles). Times are relative to the start of the morphine infusion. Results are shown as the mean ± SD (N = 14). Pharmacokinetic model fits (best-median-worst, respectively) of a 2-compartment pharmacokinetic model for are shown for (B-D) morphine, (F-H) morphine-3-glucuronide (M-3-G), and (J-L) morphine-6-glucuronide (M-6-G) concentrations.
Figure 2
Figure 2
Morphine effects on dark-adapted pupil diameter, and influence of cyclosporine. Times are relative to the start of the morphine infusion. Symbols reflect controls (circles) and cyclosporine-treated subjects (triangles). Results are shown as the mean ± SD (N = 14) for (A) pupil diameter versus time, (B) pupil diameter change from baseline (miosis) versus time, and (C) miosis versus plasma morphine concentration (error bars omitted for clarity). Pharmacodynamic model fits for miosis using the Emax model (Equation 1) are shown for the (D) best, (E) median, and (F) worst data fits.
Figure 3
Figure 3
Model-predicted biophase morphine concentrations during and after a 1-h infusion of morphine (0.1 mg/kg) in subjects receiving nothing (controls, open circles) or a 2 h cyclosporine infusion (2.5 mg/kg/hr, begun 1 h before the morphine infusion, open triangles). Times are relative to the start of the morphine infusion. Results are shown as the mean ± SD (N = 14).
Figure 4
Figure 4
Thermal pain perception before, during and after a one-hour infusion of morphine. Times are relative to the start of the morphine infusion. The 2-hcyclosporine infusion (−1 to 1 h) was started 1 h before morphine (−1 to 0 h). Results are shown as the mean ± SD (N = 14) with some error bars omitted for clarity. (A) Maximally tolerated temperatures in control (circles) and cyclosporine (triangles) sessions. No time-specific maximally tolerated temperature was significantly greater than predrug baseline, in either controls or cyclosporine-treated subjects. (B and C) Verbal analog scores in response to specific thermal stimuli applied in random order at each time. Temperatures were 41.0, 43.0, 44.8, 46.5, 48.2, and 50.0 °C. (B and C) Results are shown for selected temperatures in controls (circles) and cyclosporine-treated subjects (triangles) at (B) 44.8 °C and (C) 46.5 °C. (D and E) Results are shown for all temperatures at selected times in (D) controls and (E) cyclosporine-treated subjects.
Figure 4
Figure 4
Thermal pain perception before, during and after a one-hour infusion of morphine. Times are relative to the start of the morphine infusion. The 2-hcyclosporine infusion (−1 to 1 h) was started 1 h before morphine (−1 to 0 h). Results are shown as the mean ± SD (N = 14) with some error bars omitted for clarity. (A) Maximally tolerated temperatures in control (circles) and cyclosporine (triangles) sessions. No time-specific maximally tolerated temperature was significantly greater than predrug baseline, in either controls or cyclosporine-treated subjects. (B and C) Verbal analog scores in response to specific thermal stimuli applied in random order at each time. Temperatures were 41.0, 43.0, 44.8, 46.5, 48.2, and 50.0 °C. (B and C) Results are shown for selected temperatures in controls (circles) and cyclosporine-treated subjects (triangles) at (B) 44.8 °C and (C) 46.5 °C. (D and E) Results are shown for all temperatures at selected times in (D) controls and (E) cyclosporine-treated subjects.

References

    1. Lotsch J. Pharmacokinetic-pharmacodynamic modeling of opioids. J Pain Symptom Manage. 2005;29:S90–103. - PubMed
    1. Kharasch ED. Intraoperative methadone: rediscovery, reappraisal, and reinvigoration? Anesth Analg. 2011;112:13–6. - PMC - PubMed
    1. Cordon-Cardo C, O’Brien JP, Casals D, Rittman-Grauer L, Biedler JL, Melamed MR, Bertino JR. Multidrug-resistance gene (P-glycoprotein) is expressed by endothelial cells at blood-brain barrier sites. Proc Natl Acad Sci U S A. 1989;86:695–8. - PMC - PubMed
    1. Bendayan R, Ronaldson PT, Gingras D, Bendayan M. In situ localization of P-glycoprotein (ABCB1) in human and rat brain. J Histochem Cytochem. 2006;54:1159–67. - PMC - PubMed
    1. Tournier N, Decleves X, Saubamea B, Scherrmann JM, Cisternino S. Opioid transport by ATP-binding cassette transporters at the blood-brain barrier: Implications for neuropsychopharmacology. Curr Pharm Des. 2011;17:2829–42. - PubMed

Publication types