. 2013 Aug;20(8):1008-14.
doi: 10.1038/nsmb.2611. Epub 2013 Jul 14.

High-resolution structure of TBP with TAF1 reveals anchoring patterns in transcriptional regulation

Affiliations

High-resolution structure of TBP with TAF1 reveals anchoring patterns in transcriptional regulation

Madhanagopal Anandapadamanaban et al. Nat Struct Mol Biol. 2013 Aug.

Abstract

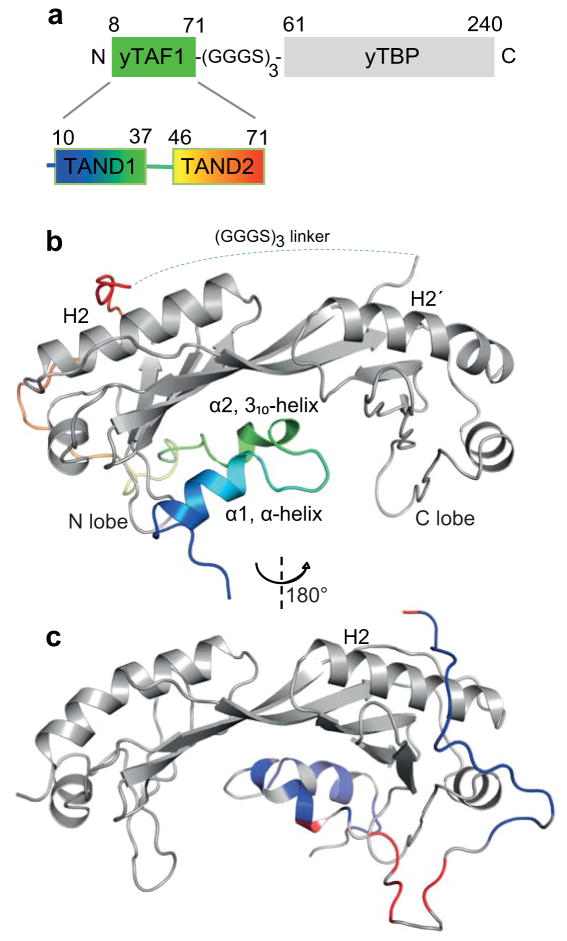
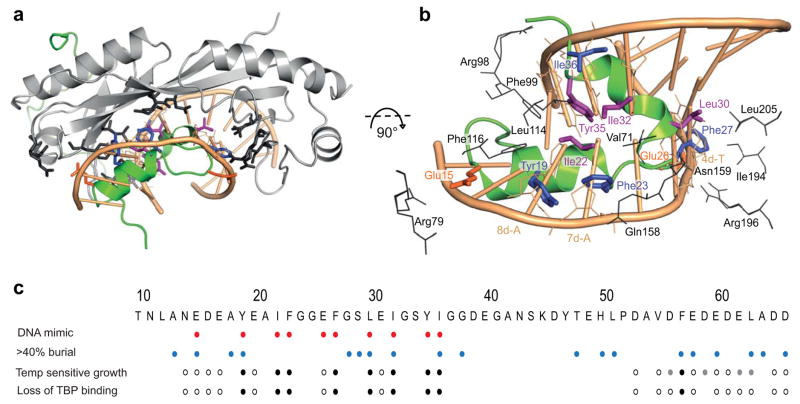
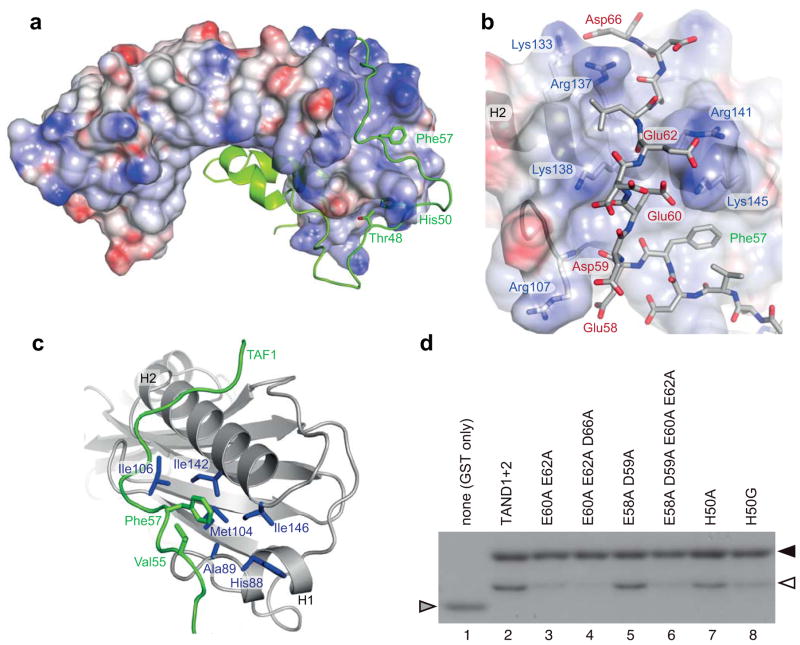
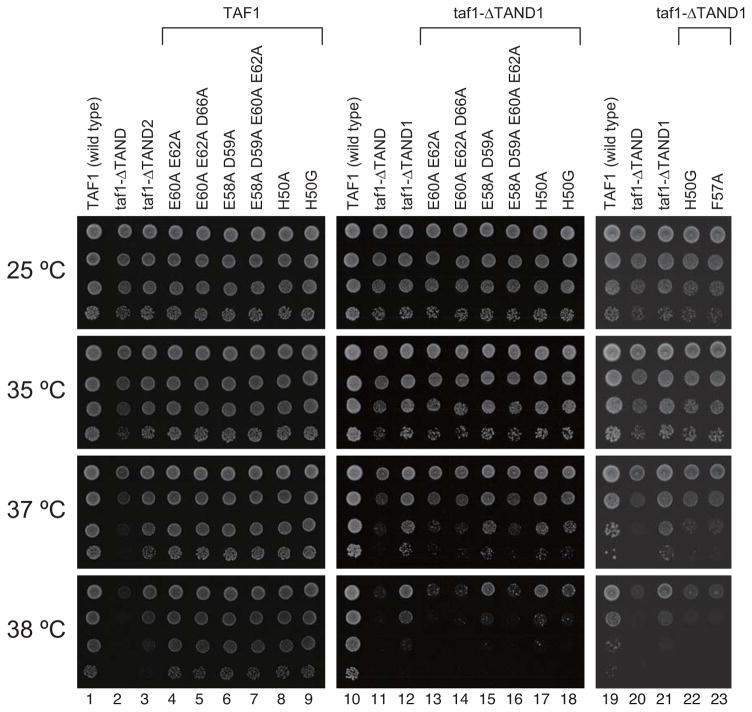
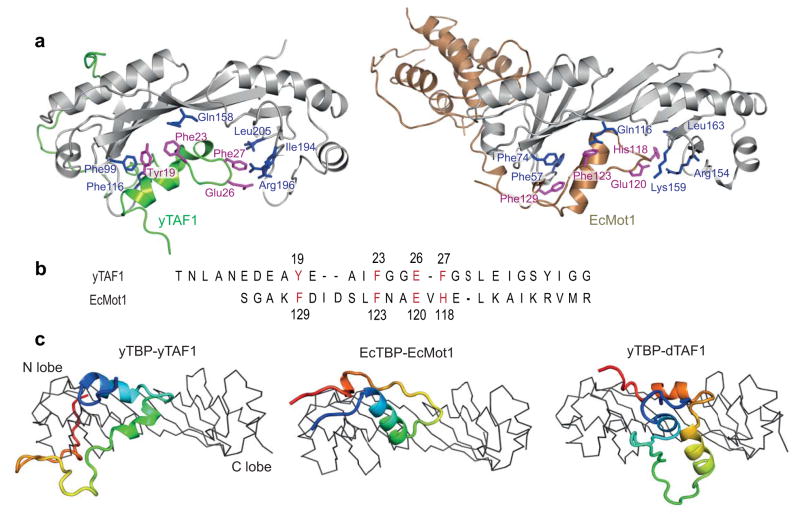
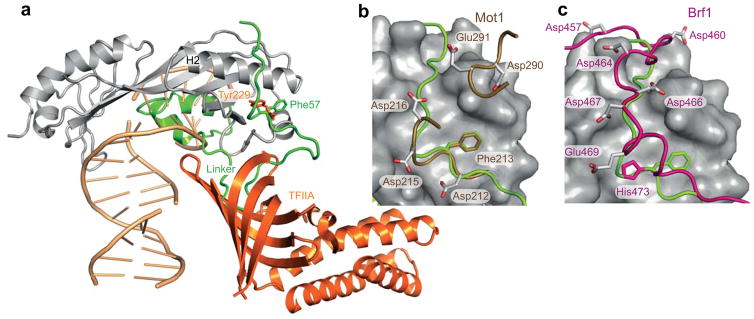
The general transcription factor TFIID provides a regulatory platform for transcription initiation. Here we present the crystal structure (1.97 Å) and NMR analysis of yeast TAF1 N-terminal domains TAND1 and TAND2 bound to yeast TBP, together with mutational data. We find that yeast TAF1-TAND1, which in itself acts as a transcriptional activator, binds TBP's concave DNA-binding surface by presenting similar anchor residues to TBP as does Mot1 but from a distinct structural scaffold. Furthermore, we show how TAF1-TAND2 uses an aromatic and acidic anchoring pattern to bind a conserved TBP surface groove traversing the basic helix region, and we find highly similar TBP-binding motifs also presented by the structurally distinct TFIIA, Mot1 and Brf1 proteins. Our identification of these anchoring patterns, which can be easily disrupted or enhanced, provides insight into the competitive multiprotein TBP interplay critical to transcriptional regulation.


Conflict of interest statement

COMPETING FINANCIAL INTERESTS

The authors declare no competing financial interests.

Figures

Figure 1
Figure 1. Structure and dynamics of yTBP–yTAF1 binding
(a) Schematic representation of yTBP-yTAF1 fusion protein. The yTBP-yTAF1 fusion protein comprises the yTBP core domain and the yTAF1-TAND1 and -TAND2 regions. A (GGGS)3 fusion linker connects the two proteins. (b) Cartoon representation of yTBP (grey) -yTAF1 (N-blue to C-red). The approximate location of the disordered fusion linker connecting yTAF1 and yTBP is indicated (dashed line). Key yTBP helices 2 (H2) and 2′ (H2′) as well as secondary structure elements of yTAF1 are annotated. (c ) same as (b) but rotated 180° in y (indicated) and −55° in x and colored by NMR relaxation rates. Residues in yTAF with mean R1 decay rates within ±2σ of the mean value for yTBP in blue, > +4σ in red; R and NOE data show the same pattern (Supplementary Fig. 1).
Figure 2
Figure 2. TATA-box mimicry of yTAF1-TAND1
(a) Superposition of yTBP (grey) -yTAF1 (green) onto the yTBP-DNA complex (PDB 1YTB; only the TATA-box is shown). Interacting residues are shown in sticks and colored as below. (b) Close-up view of the TAND1 and TBP interaction, with overlayed TATA-box as in (a). Interacting residues in yTBP (grey) and residues in yTAF1-TAND1 mimicking TATA-box riboses (blue), bases (purple) and phosphates (orange) parts are labelled. (c) DNA-mimicking residues in yTBP-TAF1-TAND (red) and TAF1 side chains >40% buried in the TBP complex (blue) are indicated together with previous results from single alanine mutation screening showing temperature sensitive growth and/or lost TBP binding (black: severe effects, grey: milder effects, empty: no effect),.
Figure 3
Figure 3. Electrostatic and hydrophobic anchoring of yTAF1-TAND2 to TBP
(a) Electrostatic surface representation of yTBP, with the bound yTAF1-TAND2 in green and with anchoring TAND2 residues annotated. (b) Detailed view of the surface groove interaction connecting yTAF1-TAND2 (sticks) and yTBP (cartoon). Participating side chains in the charge-charge interaction network are shown in sticks and labelled, as is the Phe57 anchor residue. Hydrogen bonds are listed in Supplementary Table 1. (c) The yTBP hydrophobic surface pocket, lined by residues (blue) in helix 1 (His88 and Ala89), strand 2 (Met104 and Ile106), and helix 2 (Ile142 and Ile146), binds the anchoring Phe57 residue supported by Val55 in yTAF1-TAND2 (green). (d) GST-pulldown assays. GST-TAND1-TAND2 fusion proteins carrying TAND2 mutations as indicated (lanes 3–8, lane 2 is the wild type) or GST alone (lane 1) were incubated with equimolar TBP. Triangles indicate GST-TAND1-TAND2 (black), TBP (white) and GST (grey) positions.
Figure 4
Figure 4. Multiple acidic residues in TAND2 affect yeast growth
Growth phenotype of yeast strains carrying TAND mutations as indicated. The strains were serially diluted (10-fold), spotted onto YPD medium, and grown at the indicated temperatures for 3 days. Since both TAND1 and TAND2 regions affect TBP binding, effects of site-specific TAND2 mutations on growth were assayed both in the presence (lanes 4–9) and absence (lanes 13–18, 22–23) of TAND1. For direct comparison, a joint experiment was performed with the previously studied F57A mutant.
Figure 5
Figure 5. Similar TBP-anchoring residues in yTAF1-TAND1 and Mot1 despite reverse sequence tracing
(a) Cartoon representation of TBP complexes with yTAF1 (green, current structure) and Mot1 (sand, 3OC3), highlighting interacting residues of TBP (blue) and yTAF1 or Mot1 (magenta). Only part of the Mot1 structure is shown for clarity. (b) Structure-based sequence alignment between the TBP interacting residues of TAF1 and Mot1. TBP anchoring residues are annotated and the Mot1 sequence is reversed as prompted by the reversed structural sequence tracing shown in a. (c) Ribbon style representation of TBP and cartoon yTAF1, Mot1 and dTAF with rainbow coloring (N-terminus:blue, C-terminus:red). The TBP lobes are labeled and the orientation is 90° rotated compared to (a).
Figure 6
Figure 6. Conserved surface groove and anchoring residues in competitive TBP binding
(a) Superposition of TBP-TAF1 on to the TBP-TFIIA (orange) –DNA (wheat) ternary complex (from PDB 1NH2). Aromatic TBP-anchoring residues of TAF1 and TFIIA on the convex TBP surface are shown as sticks and labeled. The linker region between TAND1 and TAND2 of TAF1 protruding into the space occupied by the β-barrel TFIIA structure is highlighted. (b) Mot1 (sand, PDB 3OC3) and (c) Brf1 (magenta, PDB 1NGM) complexes with TBP superimposed onto yTAF1 (green) – yTBP (surface), highlighting in stick representation the common anchoring aromatic residue in these transcription activators and repressors as well as hydrogen binding sidechains connecting to the basic region of TBP. All superpositions were made by structural alignment of the TBP backbone in the respective complexes onto yTBP in the current structure. Only yTBP from the current structure is shown in a–c.

References

    1. Goodrich JA, Tjian R. Unexpected roles for core promoter recognition factors in cell-type-specific transcription and gene regulation. Nat Rev Genet. 2010;11:549–58. - PMC - PubMed
    1. D’Alessio JA, Ng R, Willenbring H, Tjian R. Core promoter recognition complex changes accompany liver development. Proc Natl Acad Sci U S A. 2011;108:3906–11. - PMC - PubMed
    1. Vannini A, Cramer P. Conservation between the RNA polymerase I, II, and III transcription initiation machineries. Mol Cell. 2012;45:439–46. - PubMed
    1. Papai G, Weil PA, Schultz P. New insights into the function of transcription factor TFIID from recent structural studies. Curr Opin Genet Dev. 2011;21:219–24. - PMC - PubMed
    1. Thomas MC, Chiang CM. The general transcription machinery and general cofactors. Crit Rev Biochem Mol Biol. 2006;41:105–78. - PubMed

Publication types

MeSH terms

Substances

Associated data

Grants and funding

LinkOut - more resources