. 2014 Jun 12;33(24):3183-94.
doi: 10.1038/onc.2013.273. Epub 2013 Jul 15.

The FoxO-BNIP3 axis exerts a unique regulation of mTORC1 and cell survival under energy stress

Affiliations

The FoxO-BNIP3 axis exerts a unique regulation of mTORC1 and cell survival under energy stress

A Lin et al. Oncogene. .

Erratum in

  • Oncogene. 2014 Nov 6;33(45):5310. TCGA Research Network [removed]

Abstract

Normal cells possess adaptive mechanisms to couple energy availability with cell growth (cell size increase) and survival, and imbalances are associated with major diseases such as cancer. Inactivation of critical regulators involved in energy stress response, including adenosine monophosphate-activated protein kinase (AMPK), liver kinase B1 (LKB1), tuberous sclerosis complex 1 (TSC1) and tuberous sclerosis complex 2 (TSC2), leads to uncontrolled cell growth yet increased apoptosis under energy stress. These energy stress regulators are also important in tumor suppression and metabolism. Here, we show that forkhead box O (FoxO) transcription factor, a central regulator of tumor suppression and metabolism, plays a unique role in energy stress response. FoxOs inhibit the mammalian target of rapamycin complex 1 (mTORC1), a key regulator of cell growth, under energy stress, and inactivation of FoxOs alleviates energy stress-mediated mTORC1 repression. Surprisingly, unlike AMPK-, Lkb1- or Tsc1/2-deficient cells, FoxO-deficient cells exhibit decreased apoptosis under energy stress. FoxOs operate to inhibit mTORC1 signaling and cell survival independent of AMPK and TSC. Integrated transcriptomic and functional analyses identified BCL2/adenovirus E1B 19 kDa protein-interacting protein 3 (BNIP3)-a negative regulator of both Rheb and Bcl2 prosurvival family members-as a key downstream target of FoxOs to inhibit mTORC1 function and promote apoptosis in response to energy stress. We show that p38β, but not AMPK, is likely to function upstream of FoxO-BNIP3 to mediate energy stress response. Finally, we reveal that low expression of FoxO or BNIP3 correlates with poor clinical outcomes in renal cancer patients. Together, our study uncovers a novel signaling circuit functioning to mediate cellular energy responses to control cell growth and survival. These findings also have important implications to human cancers.


Figures

Figure 1
Figure 1. FoxOs suppress mTORC1 activation in response to energy stress
(A) FoxO1/3/4 L/L, Rosa26-CreERT2 MEFs were treated with vehicle or 4OHT, and then analyzed by western blotting to conform FoxO deletion. (B) FoxO WT and KO MEFs were cultured in DMEM + 10% FBS or glucose free DMEM + 10% FBS for 24 hours. Cell lysates were then analyzed by western blotting. (C) FoxO WT and KO MEFs were treated with 1 mM AICAR for different hours as indicated. Cell lysates were then analyzed by western blotting. (D) Relative mean forward scatter-height (FSC-H) + SD comparing FoxO WT and KO MEFs cultured in DMEM + 10% FBS or glucose free DMEM + 10% FBS for 12 hours. (E) UOK101 cells infected with either control shRNA or FoxO1/FoxO3 shRNA were cultured in glucose free medium for 24 hours or treated with 1 mM AICAR for 2 hours, and then subjected to western blotting analysis. (F) 786-O cells infected with (i) control shRNA, (ii) FoxO1 shRNA, (iii) FoxO3 shRNA, or (iv) FoxO1/FoxO3 shRNA were cultured in glucose free medium for 24 hours or treated with 1 mM AICAR for 2 hours, and then subjected to western blotting analysis.
Figure 2
Figure 2. FoxOs potentiate energy stress-induced apoptosis
(A) FoxO WT and KO MEFs were cultured in glucose containing or free medium for 48 hours, and then subjected to western blotting analysis. (B) FACS analysis showing Annexin V staining of FoxO WT and KO MEFs which were cultured in glucose containing or free medium for 48 hours. (C) Bar graph showing the percentages of Annexin V positive cells of FoxO WT and KO MEFs which were cultured in glucose free medium for different hours as indicated. (D) Bar graph showing the percentages of Annexin V positive cells of FoxO WT and KO MEFs which were treated with 1 mM AICAR for different hours as indicated. (E) FoxO1/3 expression and mTORC1 activation status in human RCC cells. Western blotting was performed on cell lysates from a panel of human RCC cell lines as indicated. (F) Bar graph showing the percentages of Annexin V positive cells of different RCC cells which were cultured in glucose containing or free medium for 48 hours. (G) Various RCC cells were cultured in glucose free medium for different hours as indicated, and then subjected to western blotting analysis. (H and I) Bar graphs showing the percentage of Annexin V positive 786-O cells infected with different shRNAs which were cultured in glucose free medium for 24 hours (H) or treated with 1 mM AICAR for 12 hour (I).
Figure 3
Figure 3. FoxOs operate in parallel to TSC to mediate energy stress response
(A) FoxO WT and KO MEFs were cultured in DMEM + 10% FBS or glucose free DMEM + 10% FBS for 24 hours. Cell lysates were then analyzed by western blotting with various antibodies as indicated. (B) FoxO WT and KO MEFs were treated with AICAR with different concentrations for 2 hours, and subjected to western blotting analysis with various antibodies as indicated. (C) WT, FoxO KO, Tsc1 KO, Tsc1/FoxO KO MEFs were treated with AICAR with different concentrations for 2 hours, and subjected to western blotting analysis with various antibodies as indicated. (D) Bar graphs showing the percentage of Annexin V positive cells of WT, FoxO KO, Tsc1 KO, Tsc1/FoxO KO MEFs cultured in glucose containing or free medium for 24 hours.
Figure 4
Figure 4. FoxOs regulate energy stress-induced BNIP3 expression
(A) Schematic representation of transcriptome analysis. See results for detailed description. (B) Heatmap of top list genes from transcriptome analysis. (C and D) FoxO WT and KO MEFs were cultured in glucose free medium for 24 hours (C) or treated with 1 mM AICAR for 2 hours (D), and then subjected to western blotting and real time PCR analyses to examine BNIP3 expression. (E and F) UOK101 (E) or 786-O cells (F) infected with different shRNAs were treated with 1 mM AICAR for 2 hours, and then subjected to western blotting analysis to examine BNIP3 expression. (G) FoxO WT and KO MEFs were cultured in glucose containing or free medium for 24 hours, and then subjected to ChIP analysis to detect FoxO1/3 biding to BNIP3 promoter. Bar graph and image showing the relative enrichment determined by quantitative RT-PCR following ChIP analysis using IgG (control), FoxO1 and FoxO3 antibodies. (H) Empty vector (EV), constitutively active FoxO1 or FoxO3 was co-transfected with BNIP3 promoter luciferase construct into HEK293T cells, and then subjected to luciferase reporter promoter assay. (I) Sequence alignment of human and mouse BNIP3 promoter region with FoxO binding elements indicated.
Figure 5
Figure 5. BNIP3 mediates FoxO-mediated mTORC1 inhibition in response to energy stress
(A) FoxO WT and KO MEFs were treated with 1mM AICAR with different hours as indicated, and subjected to western blotting analysis. (B) FoxO WT and KO mice were fed ad libitum or fasted for 24 hours, and whole cell lysates from various organs were extracted and subjected to western blotting analysis as indicated. (C) FoxO WT and KO MEFs with stable expression of either empty vector (EV) or BNIP3 were either deprived of glucose for 24 hours, or treated with 1 mM AICAR for 2 hours, and then subjected to western blotting analysis. (D and E) Control shRNA (shCtrl) or BNIP3 shRNA-infected 786-O cells (D) or primary MEFs (E) were cultured in glucose containing or free medium for 24 hours, and then subjected to western blotting analysis. (F) FoxO WT and KO MEFs were cultured in glucose containing or free medium for 24 hours. The endogenous interaction between BNIP3 and Rheb was detected by immunoprecipitation as indicated.
Figure 6
Figure 6. BNIP3 mediates FoxO function in promoting apoptosis under energy deprivation conditions
(A) FoxO WT and KO MEFs with stable expression of either empty vector (EV) or BNIP3 were cultured in glucose containing or free medium for 24 hours. The apoptosis rates of the cells were then detected by Annexin V staining assay. (B and C) Control shRNA or BNIP3 shRNA-infected cells were either deprived of glucose for 24 hours (B) or treated with 1 mM AICAR for 6 hours (C). The apoptosis rates of the cells were then detected by Annexin V staining assay.
Figure 7
Figure 7. p38β, but not LKB1-AMPK, is likely to function upstream of FoxOs to mediate energy stress response
(A) p38β WT and KO MEFs were either treated with 1 mM AICAR for 2 hours or deprived of glucose for 24 hours, and subjected to western blotting for analysis. (B) FACS analysis showing Annexin V staining of p38β WT and KO MEFs which were cultured in glucose containing or free medium for 24 hours. (C) Representative images showing p38β WT and KO MEFs which were cultured in glucose containing or free medium for 24 hours. (D) Bar graph showing the percentages of Annexin V positive cells of p38β WT and KO cells which were either treated with 1 mM AICAR for 6 hours or deprived of glucose for 24 hours. (E) p38β WT and KO MEFs were treated with 1 mM AICAR for 2 hours or deprived of glucose for 24 hours, and then subjected to western blotting and real time PCR analyses to examine BNIP3 expression. (F) p38β WT and KO MEFs were either treated with 1 mM AICAR for 2 hours or deprived of glucose for 24 hours. Cell lysates were collected and immunoprecipitated with FoxO3 antibody, then blotted with phospho-FoxO3 Ser 7 and FoxO3 antibody as indicated.
Figure 8
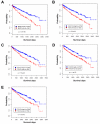
Figure 8. Low FoxO or BNIP3 expression correlates with poor clinical outcomes in clear cell renal cell carcinoma patients
Kaplan Meier plots of ccRCCs stratified by the expression levels of BNIP3 (A), FoxO1/3 (B), FoxO1 (C), FoxO3 (D), or FoxO4 (E).
Figure 9
Figure 9. The working model of FoxO in energy stress response
See discussion for detailed description.

References

    1. Mihaylova MM, Shaw RJ. The AMPK signalling pathway coordinates cell growth, autophagy and metabolism. Nat Cell Biol. 2011 Sep;13(9):1016–23. - PMC - PubMed
    1. Hardie DG, Ross FA, Hawley SA. AMPK: a nutrient and energy sensor that maintains energy homeostasis. Nat Rev Mol Cell Biol. 2012 Apr;13(4):251–62. - PMC - PubMed
    1. Shackelford DB, Shaw RJ. The LKB1-AMPK pathway: metabolism and growth control in tumour suppression. Nat Rev Cancer. 2009 Aug;9(8):563–75. - PMC - PubMed
    1. Laplante M, Sabatini DM. mTOR Signaling in Growth Control and Disease. Cell. 2012 Apr 13;149(2):274–93. - PMC - PubMed
    1. Wullschleger S, Loewith R, Hall MN. TOR signaling in growth and metabolism. Cell. 2006 Feb 10;124(3):471–84. - PubMed

Publication types

MeSH terms