Comparative Study
. 2013 Aug;16(8):1118-24.
doi: 10.1038/nn.3456. Epub 2013 Jul 14.

Canceling actions involves a race between basal ganglia pathways

Affiliations
Comparative Study

Canceling actions involves a race between basal ganglia pathways

Robert Schmidt et al. Nat Neurosci. 2013 Aug.

Abstract

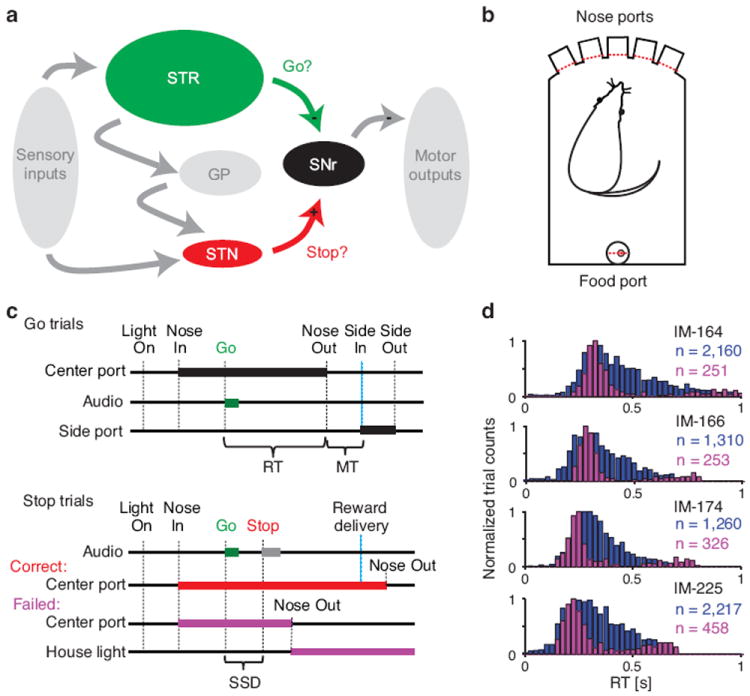
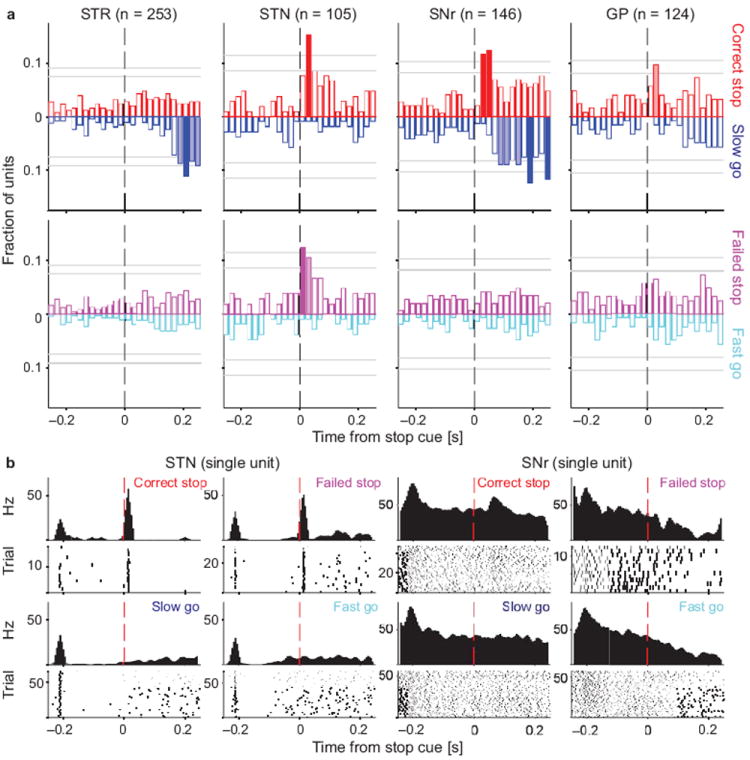
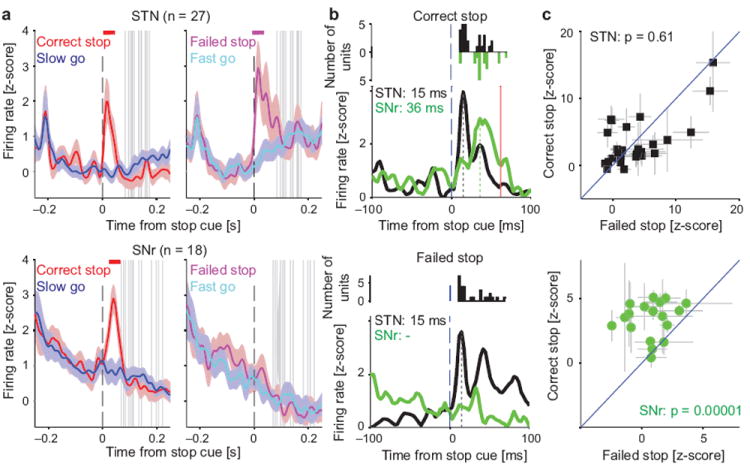
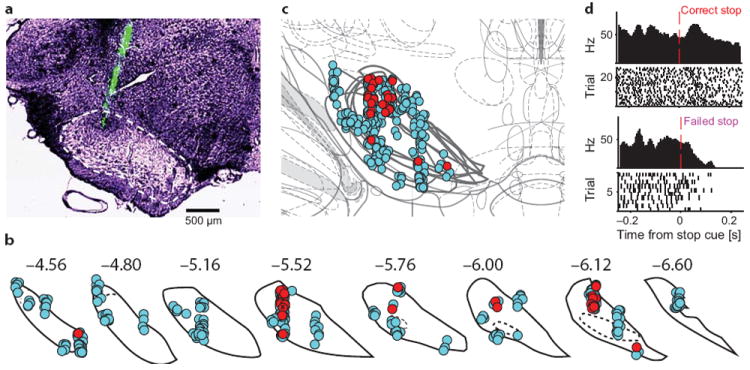
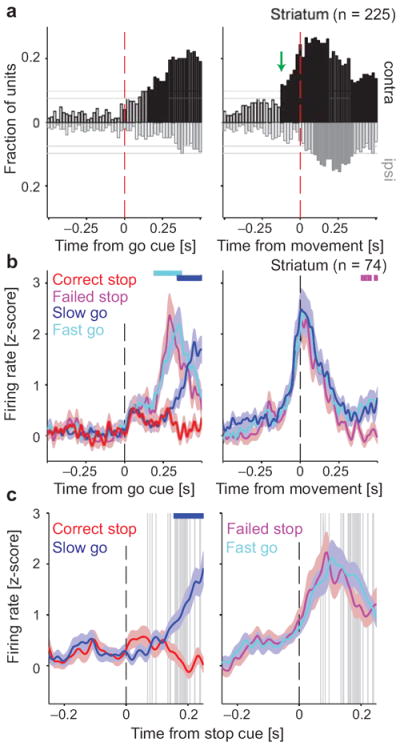
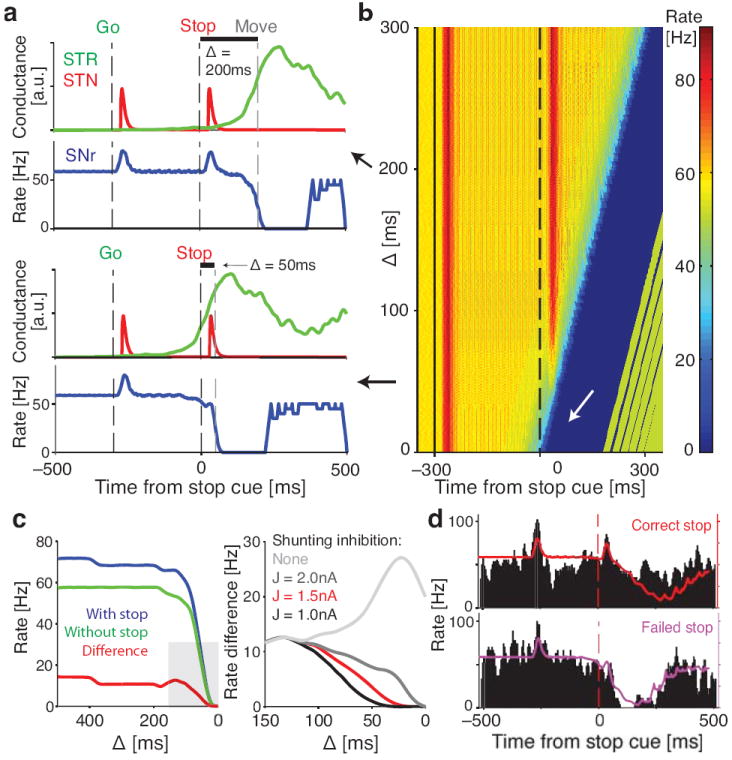
Salient cues can prompt the rapid interruption of planned actions. It has been proposed that fast, reactive behavioral inhibition involves specific basal ganglia pathways, and we tested this by comparing activity in multiple rat basal ganglia structures during performance of a stop-signal task. Subthalamic nucleus (STN) neurons exhibited low-latency responses to 'Stop' cues, irrespective of whether actions were canceled or not. By contrast, neurons downstream in the substantia nigra pars reticulata (SNr) only responded to Stop cues in trials with successful cancellation. Recordings and simulations together indicate that this sensorimotor gating arises from the relative timing of two distinct inputs to neurons in the SNr dorsolateral 'core' subregion: cue-related excitation from STN and movement-related inhibition from striatum. Our results support race models of action cancellation, with stopping requiring Stop-cue information to be transmitted from STN to SNr before increased striatal input creates a point of no return.


Conflict of interest statement

The authors declare no competing financial interests.

Figures

Figure 1
Figure 1
Task events and behavior. (a) Simplified scheme of neural circuitry under investigation during the stop-signal task. Projections from striatum (STR) and STN converge on SNr, which provides tonic inhibition of motor output. (b) Configuration of the operant chamber with five nose ports on one side and a food port on the opposite side. Entry into any port is detected by photodiode beam breaks (red dashes). (c) The task events in Go trials and Stop trials are shown in sequence from left to right. Thick bars indicate occurrence of sensory cues (‘Audio’ and ‘House light’) and rat position within center and side ports. The reaction time (RT) is measured between Go cue onset and movement onset (i.e. ‘Nose Out’ of the center port). Movement time (MT) is the time it takes the rat to go from the center port to the side port. In Stop trials, the stop-signal delay (SSD) is the time between the Go cue and Stop cue onsets. (d) Reaction time distributions for Experiment 1 (rats 10–13, top-bottom). Correct Go trials are shown in blue, and Failed Stop trials in purple. Note that Failed Stop trials have similar reaction times to the faster part of the Go trial distribution.
Figure 2
Figure 2
Distinct processing of the Stop cue across basal ganglia components. (a) For each brain area, bars indicate the fraction of neurons whose firing rate significantly differs between the trial types under comparison. To screen for Stop-related activity, we compared Correct Stop trials with Slow Go trials (top), and Failed Stop trials with Fast Go trials (bottom). For example, movement-related activity is very similar on Fast Go and Failed Stop trials, so it does not show up in this comparison. Activity is aligned on Stop cue onset (or for Go trials, the point at which the Stop signal would have been presented had it been a Stop trial). Upwards bars denote the fraction of units that fired more on Stop trials; downward bars denote the fraction of units that fired more on Go trials. Filled bars indicate times when this fraction significantly exceeded chance level (binomial test; p < 0.05 with pale bars uncorrected and dark bars corrected for multiple comparisons; horizontal grey lines mark respective significance thresholds). All data shown are for contralateral Stop and Go trials (see Fig. S2 for ipsilateral trials and for a direct comparison of Correct and Failed Stop trials). (b) Illustrative examples of individual neuron activity in STN and SNr during Go trials in the four relevant trial types as indicated (both ipsi- and contralateral movements are shown). The STN unit showed a fast, transient increase in activity after the Stop cue in both Correct and Failed Stop trials. On Correct Stop trials the SNr unit also showed a fast increase in firing, and no movement-linked pause. By contrast, on Failed Stop trials the SNr unit simply showed a movement-linked decrease in firing rate and no response to the Stop cue, very similar to Fast Go trials.
Figure 3
Figure 3
Stop cues increase firing in STN before SNr. (a) Firing rate time courses for the neuronal subpopulations that distinguish Stop from Go trials (in contralateral trials; see Fig. 2 and Methods). In each case colored lines show the mean (± s.e.m.) z-score of the firing rate across units (rat breakdown: 11 and 16 STN units from rats 10,11 respectively; 14, 2, and 2 SNr units from rats 10, 12, 13 respectively; see Table S1). Horizontal colored bars at the top of each panel indicate times with significantly different Stop vs Go firing rates (shuffle test, p < 0.05, corrected for multiple comparisons). Vertical grey bars show SSRTs for the corresponding recording sessions. (b) Comparison of Stop cue response latencies for the same STN (black) and SNr (green) units (top, Correct Stop trials; bottom, Failed Stop trials). To aid comparison, baselines are shifted so that lowest activity is in all cases at zero. Vertical dashed lines indicate latency of peak response (STN 15 ms; SNr 36 ms); red line marks shortest SSRT. Inset panels give distributions of single unit response latencies. (c) Peak Stop cue response amplitudes for individual neurons in Correct versus Failed Stop trials (top STN; bottom SNr; grey lines ± s.e.m.). Shown p-values were derived from shuffle tests.
Figure 4
Figure 4
An SNr hotspot for Stop cue responses. (a) Example of a silicon probe recording from SNr. Tips of the 8 probe shanks were coated in DiO (green) for histological visualization. One tip is visible here (the others were more anterior and posterior). SNr boundary is marked with dashes. (b) Reconstructed locations of SNr single-units from all 9 rats, on SNr coronal atlas boundaries. Neurons showing significant differences between Correct and Failed Stop trials (20–100ms after Stop cue in either ipsi- or contralateral trials) are shown in red, others in cyan. Numbers indicate approximate anterior/posterior coordinate relative to bregma. (c) Functional map obtained by stacking atlas sections. Note the dorsolateral cluster of outcome-dependent SNr units (10, 11, and 3 units from rats 11, 15, 18 respectively; see Tab. S1). This cluster was observed when either ipsi- or contralateral movements had to be stopped, and also in latency-matched control comparisons (Fig. S4a–d). (d) Representative unit from the hotspot (from rat 15, marked by small ‘x’ in b) showing similar activity patterns to SNr units from Experiment 1.
Figure 5
Figure 5
Variable timing of a striatal Go process critically determines whether stopping is successful. (a) Fractions of striatal units distinguishing between contra- and ipsilateral movements, at each time point during Go trials. Layout is as Fig. 2. On right, the black solid bars before the red dashed line indicate significant coding of movement direction before movement onset. The 74 units that contributed to these bars were considered potential contributors to a Go process (rat breakdown: 5, 23, 11, and 35 units from rats 10–13, respectively; see Tab. S1). For corresponding analysis of other brain regions, see Fig. S5. (b) Mean (± s.e.m.) firing rate z-score for these 74 striatal units (see Fig. S6 for activity separated by cell type). Cyan bar at the top indicates times with significantly different firing rates on Fast vs. Slow Go trials, blue bar indicates the same for Slow Go vs. Correct Stop trials, and purple bar for Fast Go vs. Failed Stop trials (shuffle test, p < 0.05, corrected for multiple comparisons). (c) Activity of the same striatal units aligned to the Stop cue. Note the different time scale than in (b). Format is as Fig. 3a.
Figure 6
Figure 6
Modeling sensorimotor gating in SNr neurons. (a) Model responses for two illustrative values of Δ, the interval between Stop cue and Move onset. Red and green lines indicate STN and striatal (STR) inputs to the SNr model, and blue line shows the output firing rate of the model SNr cell. Note the clear SNr response to the Stop cue with Δ = 200ms, but not with Δ = 50ms. (b) SNr model responses to the Stop cue over a range of Δ. For small Δ, strong shunting inhibition from striatum prevents STN-evoked spiking to the Stop cue (white arrow). (c) (left) Comparison between model output with and without Stop cue, measured in the 50 ms after STN input reaches SNr. (right) Enlarged view of the grey area, for the range of Δ where Stop cue gating occurs. Red line is the same as on the left panel, other lines show the effects of different levels of shunting inhibition. In all cases the lines indicate the difference between model SNr firing rate with and without the Stop cue. Note that without shunting inhibition the model does not gate the Stop cue as observed in the experimental SNr data. (d) Model SNr output (colored lines) exhibits response to the Stop cue in Correct Stop trials (top) but not in Failed Stop trials (bottom). Failed and Correct Stop trials in the model are based on rat reaction time data (see Fig. S7). Black histogram shows one example rat SNr cell for qualitative comparison to the model. Note that in the model, increased firing to the Stop cue response was always followed by a movement-related decrease as, for simplicity, we did not incorporate our observation that striatal output is subsequently suppressed on Correct Stop trials (Fig. 5b,c; see Discussion).

Comment in

References

    1. Aron AR, Poldrack RA. Cortical and subcortical contributions to Stop signal response inhibition: role of the subthalamic nucleus. J Neurosci. 2006;26:2424–2433. doi: 10.1523/JNEUROSCI.4682-05.2006. - DOI - PMC - PubMed
    1. Frank MJ. Hold your horses: A dynamic computational role for the subthalamic nucleus in decision making. Neural Networks. 2006;19:1120–1136. doi: 10.1016/j.neunet.2006.03.006. - DOI - PubMed
    1. Logan GD, Cowan WB, Davis KA. On the ability to inhibit simple and choice reaction time responses: a model and a method. J Exp Psychol Hum Percept Perform. 1984;10:276–291. - PubMed
    1. Boucher L, Palmeri TJ, Logan GD, Schall JD. Inhibitory control in mind and brain: An interactive race model of countermanding Saccades. Psychol Rev. 2007;114:376–397. doi: 10.1037/0033-295X.114.2.376. - DOI - PubMed
    1. Robbins TW, Gillan CM, Smith DG, de Wit S, Ersche KD. Neurocognitive endophenotypes of impulsivity and compulsivity: towards dimensional psychiatry. Trends Cogn Sci. 2012;16:81–91. doi: 10.1016/J.Tics.2011.11.009. - DOI - PubMed

Publication types

MeSH terms