. 2013 Oct 15;208(8):1212-20.
doi: 10.1093/infdis/jit308. Epub 2013 Jul 12.

The distribution of HIV DNA and RNA in cell subsets differs in gut and blood of HIV-positive patients on ART: implications for viral persistence

Affiliations

The distribution of HIV DNA and RNA in cell subsets differs in gut and blood of HIV-positive patients on ART: implications for viral persistence

Steven A Yukl et al. J Infect Dis. .

Abstract

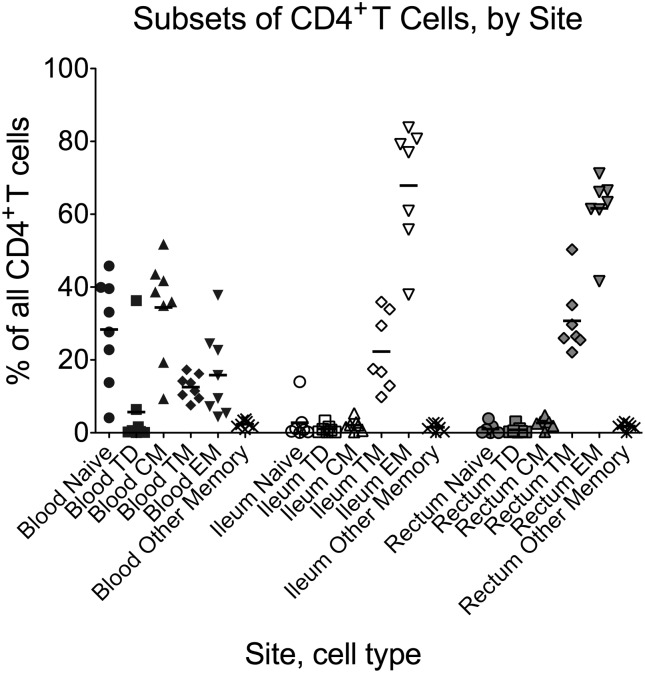
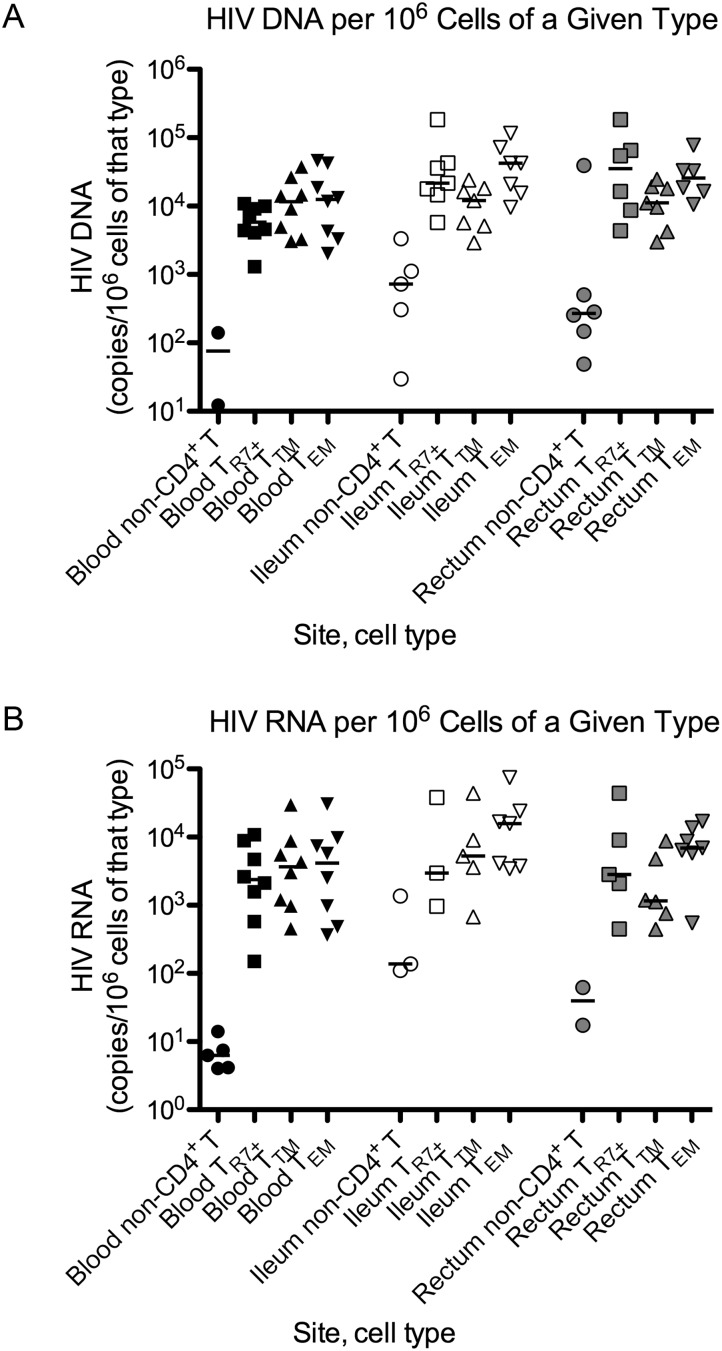
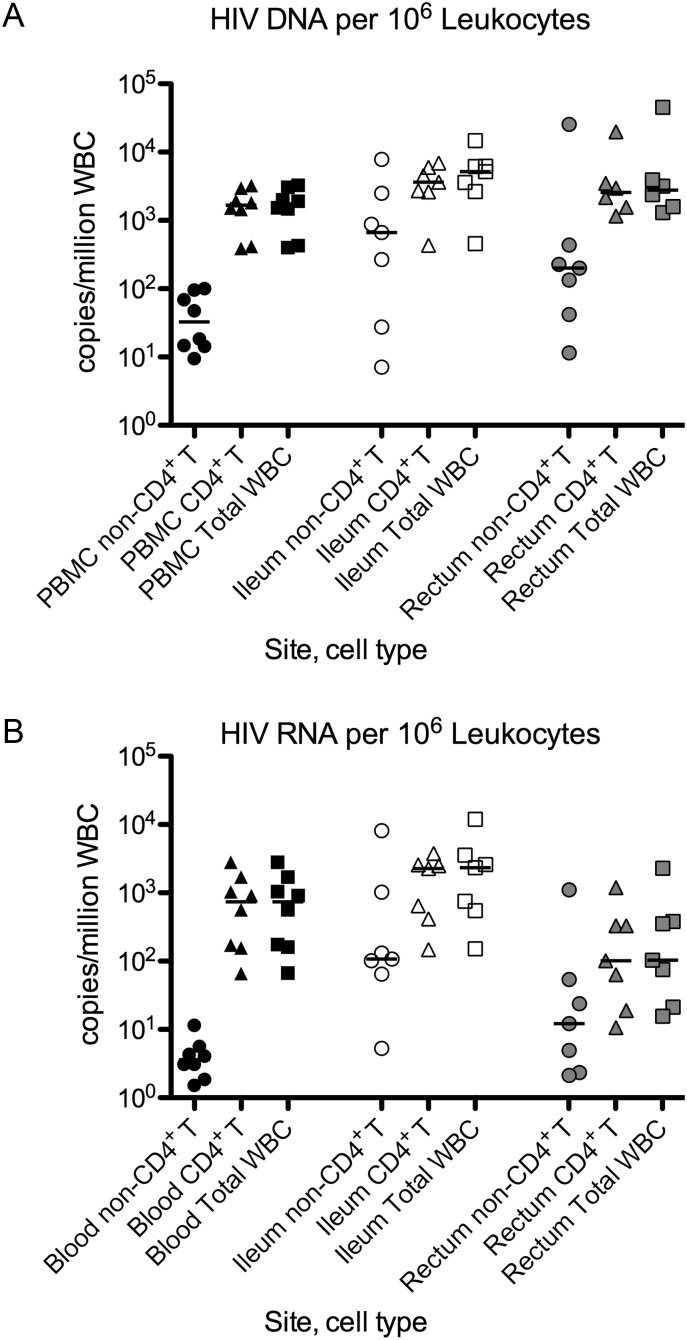
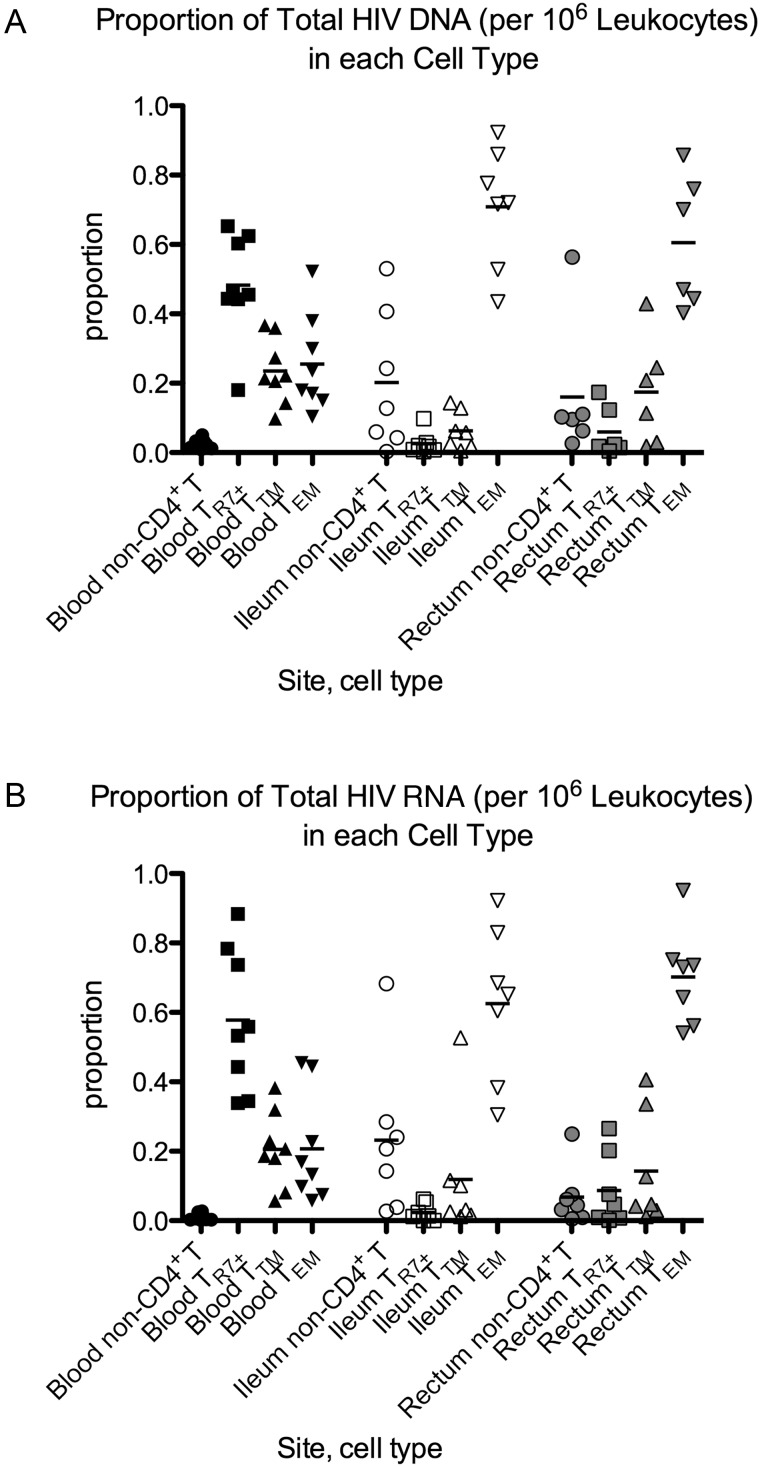
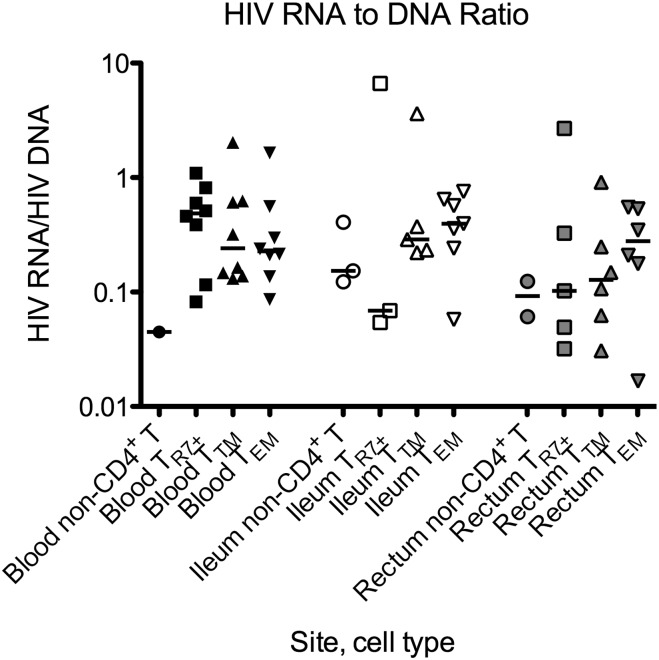
Even with optimal antiretroviral therapy, human immunodeficiency virus (HIV) persists in plasma, blood cells, and tissues. To develop new therapies, it is essential to know what cell types harbor residual HIV. We measured levels of HIV DNA, RNA, and RNA/DNA ratios in sorted subsets of CD4+ T cells (CCR7+, transitional memory, and effector memory) and non-CD4+ T leukocytes from blood, ileum, and rectum of 8 ART-suppressed HIV-positive subjects. Levels of HIV DNA/million cells in CCR7+ and effector memory cells were higher in the ileum than blood. When normalized by cell frequencies, most HIV DNA and RNA in the blood were found in CCR7+ cells, whereas in both gut sites, most HIV DNA and RNA were found in effector memory cells. HIV DNA and RNA were observed in non-CD4+ T leukocytes at low levels, particularly in gut tissues. Compared to the blood, the ileum had higher levels of HIV DNA and RNA in both CD4+ T cells and non-CD4+ T leukocytes, whereas the rectum had higher HIV DNA levels in both cell types but lower RNA levels in CD4+ T cells. Future studies should determine whether different mechanisms allow HIV to persist in these distinct reservoirs, and the degree to which different therapies can affect each reservoir.

Keywords: ART; CD4+ T cell; HIV; HIV-1; gut; ileum; intestine; persistence; rectum; reservoir.


Figures

Figure 1.
Figure 1.
Flow cytometry was used to determine the proportion of all CD4+ T cells from each site (blood, ileum, rectum) that were naive, terminally differentiated effector (Td), central memory (CM), transitional memory (TM), effector memory (EM), or “other memory” cells based on expression of CD3, CD4, CD45RO, CCR7, and CD27 (Table 1). Circles represent naive T cells; squares, terminally differentiated T cells; triangles, central memory T cells; diamonds, transitional memory T cells; inverted triangles, effector memory T cells; X's, all other memory T cells. Black, blood; white, terminal ileum; grey, rectum. Bars represent the means.
Figure 2.
Figure 2.
A and B, HIV DNA (A) and HIV RNA (B) in sorted cells. Cells from blood (black), ileum (white), and rectum (gray) were sorted into leukocytes other than CD4+ T cells (non-CD4+ T; circles) and 3 populations of CD4+ T cells: (1) CCR7+ (TR7+ ; squares), which includes naive, central memory, and “other memory”; (2) transitional memory (TTM; triangles); and (3) effector memory (TEM ; inverted triangles). HIV levels are expressed as copies/106 cells and graphed on a log scale. Only samples with detectable HIV levels are shown. Bars represent the medians.
Figure 3.
Figure 3.
A and B, HIV DNA (A) and RNA (B) with normalization to cell frequency (in 106 WBCs). For each site (blood, ileum, rectum), we used the HIV levels within each cell type (Figure 2) and the frequency of each cell type (% of live singlet CD45+ cells, as determined by flow cytometry) to calculated the HIV content within each cell type in 106 WBCs. Samples that had undetectable HIV levels were assigned a value equal to the detection limit of the assay. The HIV levels in TR7+, TTM, and TEM CD4+ T cells were added to yield an estimate of the total HIV level in CD4+ T cells (triangles), which was added to the level in non-CD4+ T leukocytes (circles) to give an estimate of the total HIV level in WBCs (squares). Data are shown on a log scale. Bars represent the medians. Abbreviations: HIV, human immunodeficiency virus; WBC, white blood cell.
Figure 4.
Figure 4.
A and B, Proportion of HIV DNA (A) and RNA (B) contributed by each cell type. For each cell type, the HIV levels in 106 WBCs were divided by the total HIV level in 106 WBCs (the sum of the HIV levels in the 4 cell types at that site) to yield the proportion of HIV in that cell type. Samples that had undetectable HIV levels were assigned a maximum value equal to the detection limit of the assay. Symbols are used as in Figure 2. Bars represent the means. Abbreviations: HIV, human immunodeficiency virus; WBC, white blood cell.
Figure 5.
Figure 5.
Average transcription per infected cell. For all cell samples in which both HIV RNA and DNA were detectable, the HIV RNA per 106 cells (Fig. 2B) was divided by the HIV DNA per 106 cells (Fig. 2A) to determine the RNA/DNA ratio (average transcription per infected cell). Results are graphed on a log scale. Symbols are used as in Figure 2. Bars represent the medians. Abbreviation: HIV, human immunodeficiency virus.

Comment in

References

    1. Schockmel GA, Yerly S, Perrin L. Detection of low HIV-1 RNA levels in plasma. J Acquir Immune Defic Syndr Hum Retrovirol. 1997;14:179–83. - PubMed
    1. Dornadula G, Zhang H, VanUitert B, et al. Residual HIV-1 RNA in blood plasma of patients taking suppressive highly active antiretroviral therapy. JAMA. 1999;282:1627–32. - PubMed
    1. Havlir DV, Bassett R, Levitan D, et al. Prevalence and predictive value of intermittent viremia with combination HIV therapy. JAMA. 2001;286:171–9. - PubMed
    1. Maldarelli F, Palmer S, King MS, et al. ART suppresses plasma HIV-1 RNA to a stable set point predicted by pretherapy viremia. PLoS Pathog. 2007;3:e46. - PMC - PubMed
    1. Chun TW, Carruth L, Finzi D, et al. Quantification of latent tissue reservoirs and total body viral load in HIV-1 infection. Nature. 1997;387:183–8. - PubMed

Publication types

MeSH terms