. 2013 Sep;14(9):959-65.
doi: 10.1038/ni.2649. Epub 2013 Jul 14.

Antiapoptotic Mcl-1 is critical for the survival and niche-filling capacity of Foxp3⁺ regulatory T cells

Affiliations

Antiapoptotic Mcl-1 is critical for the survival and niche-filling capacity of Foxp3⁺ regulatory T cells

Wim Pierson et al. Nat Immunol. 2013 Sep.

Abstract

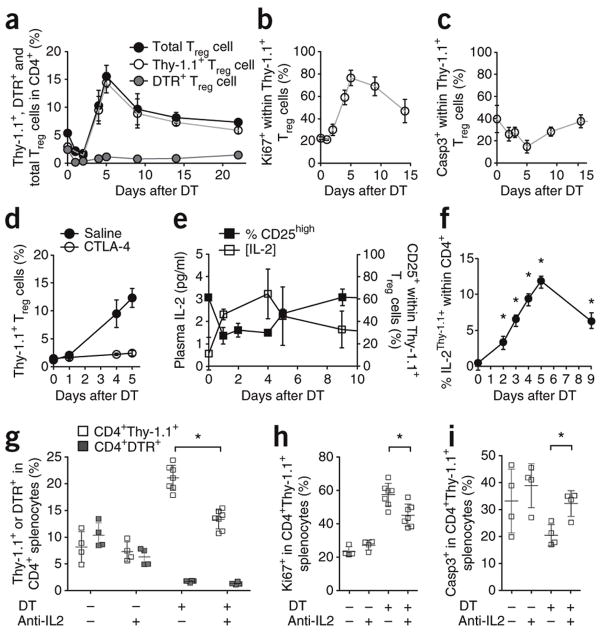
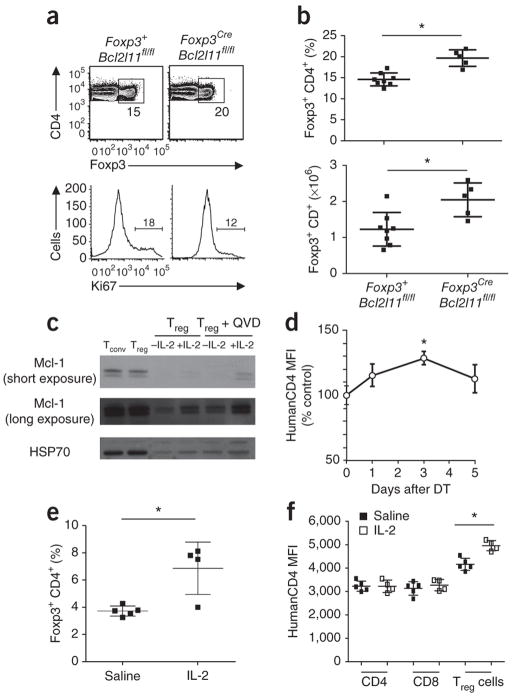
Foxp3⁺ regulatory T (Treg) cells are a crucial immunosuppressive population of CD4⁺ T cells, yet the homeostatic processes and survival programs that maintain the Treg cell pool are poorly understood. Here we report that peripheral Treg cells markedly alter their proliferative and apoptotic rates to rapidly restore numerical deficit through an interleukin 2-dependent and costimulation-dependent process. By contrast, excess Treg cells are removed by attrition, dependent on the Bim-initiated Bak- and Bax-dependent intrinsic apoptotic pathway. The antiapoptotic proteins Bcl-xL and Bcl-2 were dispensable for survival of Treg cells, whereas Mcl-1 was critical for survival of Treg cells, and the loss of this antiapoptotic protein caused fatal autoimmunity. Together, these data define the active processes by which Treg cells maintain homeostasis via critical survival pathways.


Conflict of interest statement

The authors declare no competing financial interests.

Figures

Figure 1
Figure 1
Homeostatic expansion of Treg cells is driven by increased production of IL-2. (a) Percentages of DTR+ Treg cells Thy1.1+ Treg cells and total Treg cells in Foxp3Thy1.1/DTR females depleted of Foxp3DTR+ Treg cells on day 0. Blood leukocytes were assessed on indicated days (n=4,3,7,3,4,4,4,4 mice). (b,c) Proliferation rate (b; percentage Ki67+) and apoptosis rate (c; percentage activated caspase 3+) of Thy1.1+ Treg cells, after DT treatment of Foxp3Thy1.1/DTR females on day 0. (d) Percentages of Thy1.1+ Treg cells in peripheral blood after DT treatment of saline-treated (n=3,3,3 mice/group) or CTLA4-Ig–treated Foxp3Thy1.1/DTR female mice (n=3,3,3 mice/group). (e) Plasma IL-2 (left axis, n=27,3,3,12,14 mice/group) and surface CD25 expression on Thy1.1+ Treg cells (right axis, n=4,3,7,3,4,4 mice/group) from days 0 to 15 for female Foxp3Thy1.1/DTR mice depleted of Foxp3DTR+ Treg cells (f) Proportion of Thy1.1+ (reporter for IL-2) cells within the CD4+Foxp3 population after DT injection of Foxp3+/DTR.IL2-Thy1.1 mice. (g) Foxp3Thy1.1/DTR mice were depleted of DTR+ Treg cells and injected daily with an IL-2 blocking antibody (a-IL2) or an immunoglobulin isotype-matched control antibody. Splenocytes were analyzed on day 6 for the percentages of DTR+ and Thy1.1+ Treg cells, with or without Treg cell depletion (DT treatment) and with or without anti–IL-2 treatment (n=4,4,7,7 mice/group). (h,i) Proliferation rate (h; percentage Ki67+) and apoptosis rate (i; activated caspase-3+) of Thy1.1+ regulatory T cells, with or without DT treatment and with or without anti-IL-2 treatment (n=4). (a–i) Mean ± s.d., *P < 0.05, t-test. Data are representative of 3(a–f) and 2 (g–i) independent experiments.
Figure 2
Figure 2
The intrinsic apoptosis pathway is required to restrain Treg cell numbers to homeostatic levels. (a) Representative flow profiles (TCRβ versus Foxp3 gated on CD4+ cells, Ki67 histograms gated on Foxp3+ CD4+ cells) for wild-type, Foxp3CreBak−/−Baxfl/fl mice and control littermates at 6–8 weeks of age. Numbers in plots indicate (top) the percentage of Foxp3+TCRβ+ regulatory T cells and (bottom) the fraction of proliferating Foxp3+CD4+ cells (Ki67+). (b) Average percentages and absolute numbers (mean ± s.d.) of splenic Foxp3+ Treg cells in wt, Foxp3CreBak−/−Baxfl/fl mice and control littermates at 6–8 weeks of age (n=3,3,5,3 mice/group). (a–b) Data from one experiment representative of three are shown. Mean ± s.d., *P < 0.05, t-test.
Figure 3
Figure 3
Regulatory T cell survival is independent of Bcl-2 and Bcl-xL. (a) C57BL/6.Ly5.1 (Ly5.1) chimeras reconstituted with a 50:50 mixture of hematopoietic precursors from wild-type Ly5.1 and either Bcl2+/+ or Bcl2−/− mice, analyzed 8–12 weeks later. Gates show the percentage of Ly5.2+CD4+Foxp3+ cells recovered from the thymus or spleen. (b) Average percentages (mean ± s.d.) of Ly5.2+CD4+Foxp3+ cells recovered from the thymus and spleen of the same mixed hematopoietic chimeras reconstituted with precursors from either wild-type (Bcl2+/+) or Bcl2−/− mice (n= 4,6 mice/group). (a,b) Data from one experiment representative of three are shown. (c) Representative flow profiles of CD4 versus Foxp3 gated on CD4+ cells from Foxp3CreBcl2l1wt/wt and Foxp3CreBcl2l1fl/fl mice. Gates show the percentage of CD4+Foxp3+ cells recovered from the thymus or spleen. (d) Average percentages (mean ± s.d.) of CD4+Foxp3+ Treg cells in the thymus and spleen of Foxp3CreBcl2l1wt/wt and Foxp3CreBcl2l1fl/fl siblings at 6–8 weeks of age (n = 6,9 respectively). (c,d) Data pooled from three independent experiments are shown.
Figure 4
Figure 4
Spontaneous fatal immunopathology after Treg cell–specific deletion of Mcl-1. (a) HuCD4 reporter for Mcl-1 expression was measured in lymphocyte subsets in Cd127CreMcl1wt/fl-huCD4 female mice, 6–8 weeks of age. Average huCD4 reporter MFI in CD4CD8 (DN), CD4+CD8+ (DP) and single positive (SP) thymocytes, the latter subdivided into CD4CD8+ SP, conventional CD4+CD8 SP and CD4+CD8 Foxp3+ SP (n = 3 mice/group). (b) Average huCD4 reporter MFI in splenic CD19+ B cells, naïve conventional CD4+ (CD4+ nTc), activated conventional CD4+ (CD4+ actTc), Foxp3+ Treg cells, naive conventional CD8+ (CD8+ nTc) and activated conventional CD8+ T cells (CD8+ actTc) (n = 3 mice/group). (c) Representative histogram of huCD4 reporter MFI in naive conventional CD4+ (CD4+ nTc), Foxp3+ Treg cells and naive conventional CD8+ (CD8+ nTc), with control huCD4 staining in wild-type Foxp3+ Treg cells. (a–c) Data from one experiment representative of three. (d) Weights of male Foxp3CreMcl1wt/wt, Foxp3CreMcl1wt/fl and Foxp3CreMcl1fl/fl littermates at 6–8 weeks of age (n=11,20,16 mice/group). (e) Survival curve for male Foxp3CreMcl1wt/wt, Foxp3CreMcl1wt/fl and Foxp3CreMcl1fl/fl littermates (n=16,18,18 mice/group)). (f) Plasma IgE levels in male Foxp3CreMcl1wt/wt and Foxp3CreMcl1fl/fl littermates at 4–8 weeks of age (n=6,12 mice/group). (g,h) Average disease score (g) and representative histology (h; scale bar, 200 μm) of the lungs and small intestine of male Foxp3CreMcl1wt/wt and Foxp3CreMcl1fl/fl littermates at 4–8 weeks of age (n=11, 9 mice/group). (i) Average percentage of CD44+CD62Llow activated cells within CD4+ and CD8+ splenic T cells in Foxp3CreMcl1wt/wt, Foxp3CreMcl1wt/fl and Foxp3CreMcl1fl/fl littermates at 6–8 weeks of age (n=12,9,11,10,4,d8 mice/group). (d–i) Data pooled from 3 experiments. Mean ± s.d., * P < 0.05, t-test.
Figure 5
Figure 5
Mcl-1 is required for Treg cell survival. (a) Average percentages of Foxp3+ Treg cells within splenic CD4+ T cells in male Foxp3CreMcl1wt/wt, Foxp3CreMcl1wt/fl and Foxp3CreMcl1fl/fl littermates at 6–8 weeks of age (n=14,12,11 mice/group). (b) Average percentages of Ki67+ cells within splenic Foxp3+ Treg cells in Foxp3CreMcl1wt/wt, Foxp3CreMcl1wt/fl and Foxp3CreMcl1fl/fl littermates at 6–8 weeks of age (n=14,12,11 mice/group). (a,b) Data pooled from 3 experiments. c) Expression of the huCD4 reporter for excision of Mcl1 in Foxp3+ and Foxp3 cells in male Foxp3CreMcl1fl/fl mice (n=3,4,3 mice/group). Data from one experiment representative of three. (d) Ly5.1 versus Foxp3 expression on lymph node cells from mixed chimeras with Mcl1fl/fl or Bcl2l1fl/fl Ly5.2 donor compartments analyzed 3 d after treatment with tamoxifen or vehicle control. Gates display the fraction of Treg cells arising from (top) wildtype Ly5.1+ and (bottom) Mcl1fl/fl or Bcl2l1fl/fl Ly5.1 cells. Plots are representative of 3 experiments, each with n = 3 mice/group. (e) Ratios of Ly5.1+ to Ly5.1 CD4+Foxp3+ lymph node cells in mixed chimeras with the indicated Ly5.2+ donor compartment 3 d after treatment with tamoxifen or vehicle (n=3,3,4,6 mice/group). Data from one experiment representative of three is shown. Mean ± s.d., *P < 0.05, t-test.
Figure 6
Figure 6
Regulation of Mcl-1 in Treg cells by Bim and IL-2. (a) Representative flow cytometric profiles for CD4 vs Foxp3 gated on CD4+ cells (gates indicate fraction of Treg cells within CD4+ lymph node cells) and Ki67 histograms gated on Foxp3+CD4+ cells (gate indicates the fraction of proliferating Treg cells) for Foxp3wtBcl2l11fl/fl and Foxp3CreBcl2l11fl/fl littermates at 6–8 weeks of age. (b) Average percentages and absolute number of CD4+Foxp3+ Treg cells from pooled lymph nodes of Foxp3wtBcl2l11fl/fl and Foxp3CreBcl2l11fl/fl littermates (n=8,5 mice/group). Data from one experiment representative of three are shown. (c) Immunoblot analysis of Mcl-1 expression in ex vivo isolated conventional T cells (Tconv) or Treg cells, or Treg cells cultured overnight with or without IL-2, in the absence or presence of QVD-OPH (a broad spectrum caspase inhibitor used to prevent apoptosis in the absence of IL-2). Data from one experiment representative of three are shown. (d) Cd127CreMcl1wt/fl-huCD4Foxp3wt/DTR females were depleted of Foxp3DTR+ Treg cells on day 0 and huCD4 (Mcl1 reporter) expression was measured in Foxp3+ Treg cells during the expansion phase. MFI was normalized to Treg cells from Cd127CreMcl1wt/fl-huCD4Foxp3wt mice (n=4 mice/group). Data from one experiment representative of two are shown. (e) Cd127CreMcl1wt/fl-huCD4 mice were injected with IL-2-anti-IL-2 antibody complexes or saline and on day 2 were measured for CD4+Foxp3+ Treg cell expansion in the peripheral blood and f, expression of huCD4 reporter for Mcl1 expression (n=5,4 mice/group). Mean ± s.d., * P < 0.05, t-test.

Comment in

References

    1. Gavin MA, et al. Foxp3-dependent programme of regulatory T-cell differentiation. Nature. 2007;445:771–775. - PubMed
    1. Sakaguchi S, et al. FOXP3+ regulatory T cells in the human immune system. Nat Rev Immunol. 2010;10:490–500. - PubMed
    1. Fontenot JD, et al. A function for interleukin 2 in Foxp3-expressing regulatory T cells. Nat Immunol. 2005;6:1142–1151. - PubMed
    1. Chougnet CA, et al. A major role for Bim in regulatory T cell homeostasis. J Immunol. 2011;186:156–163. - PMC - PubMed
    1. Siggs OM, et al. Opposing functions of the T cell receptor kinase ZAP-70 in immunity and tolerance differentially titrate in response to nucleotide substitutions. Immunity. 2007;27:912–926. - PMC - PubMed

Publication types

MeSH terms

Substances