. 2014 Jan;21(1):79-91.
doi: 10.1038/cdd.2013.75. Epub 2013 Jul 12.

Molecular mechanisms of ATP secretion during immunogenic cell death

Affiliations

Molecular mechanisms of ATP secretion during immunogenic cell death

I Martins et al. Cell Death Differ. 2014 Jan.

Abstract

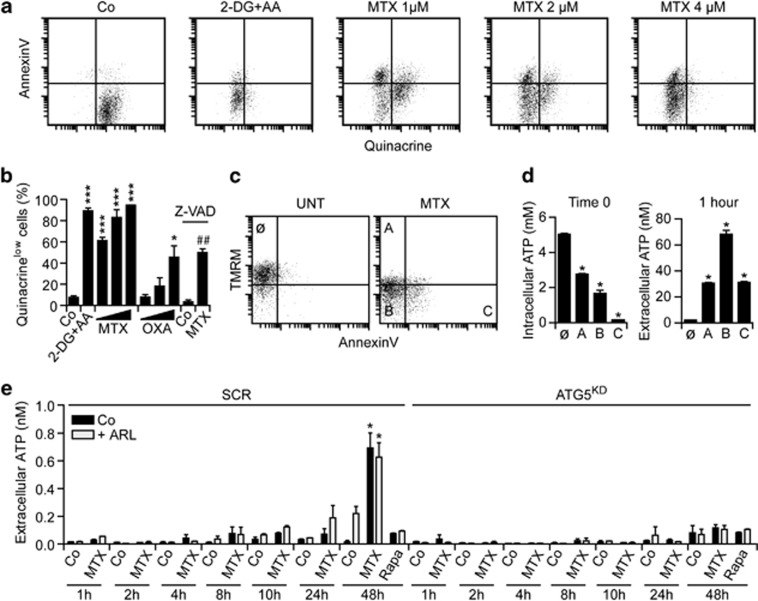
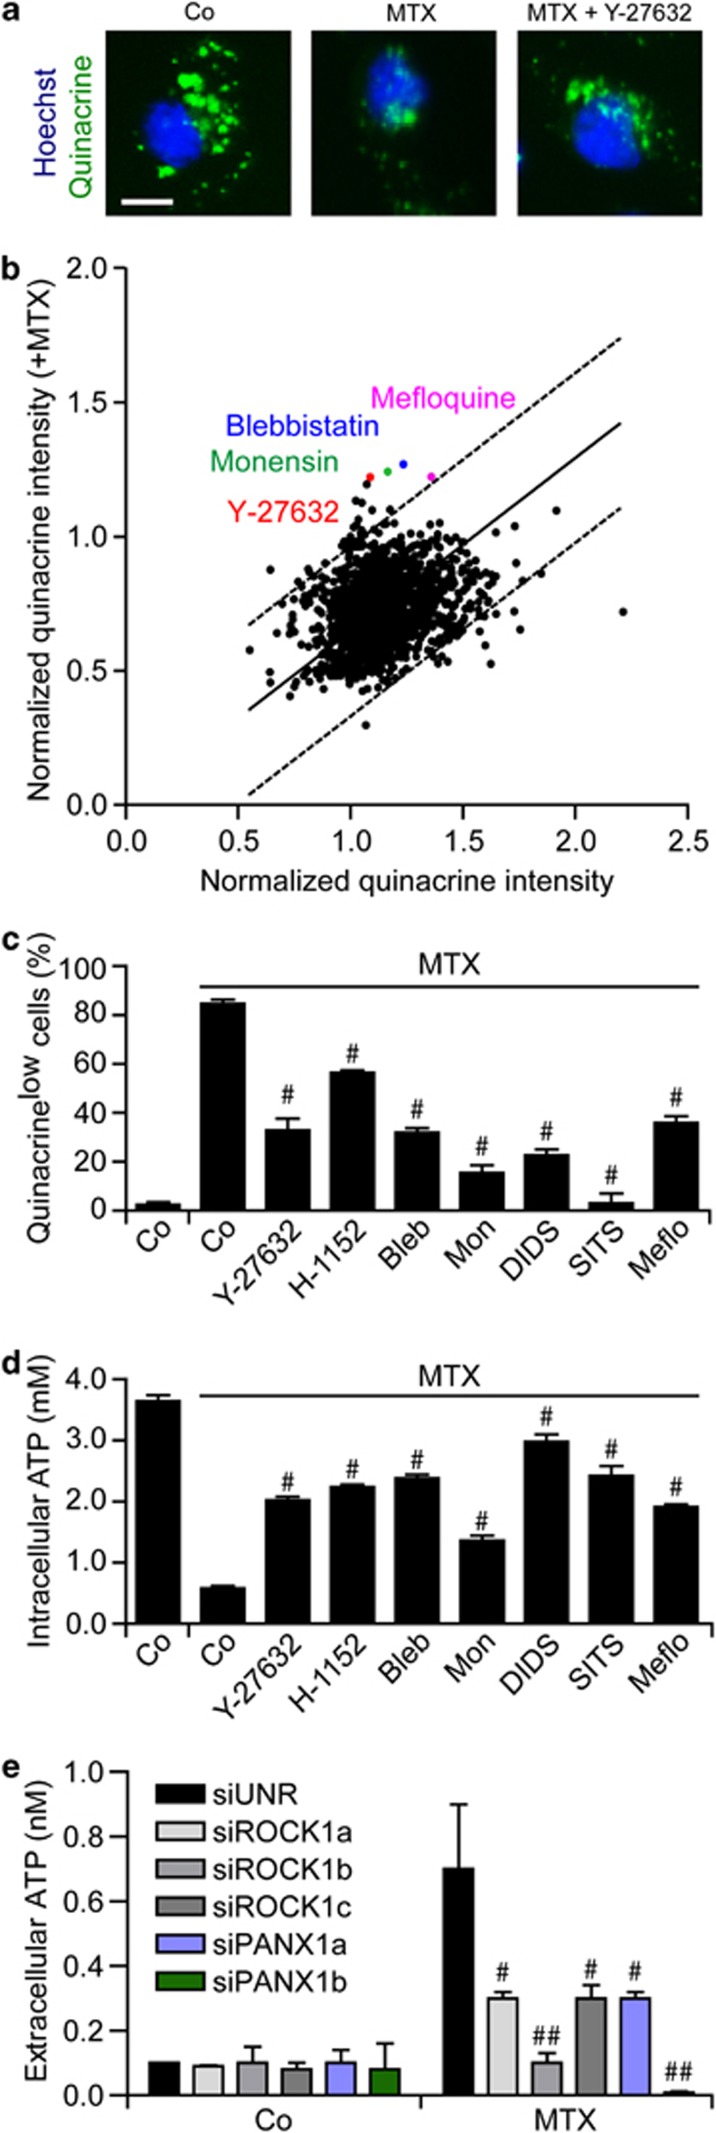
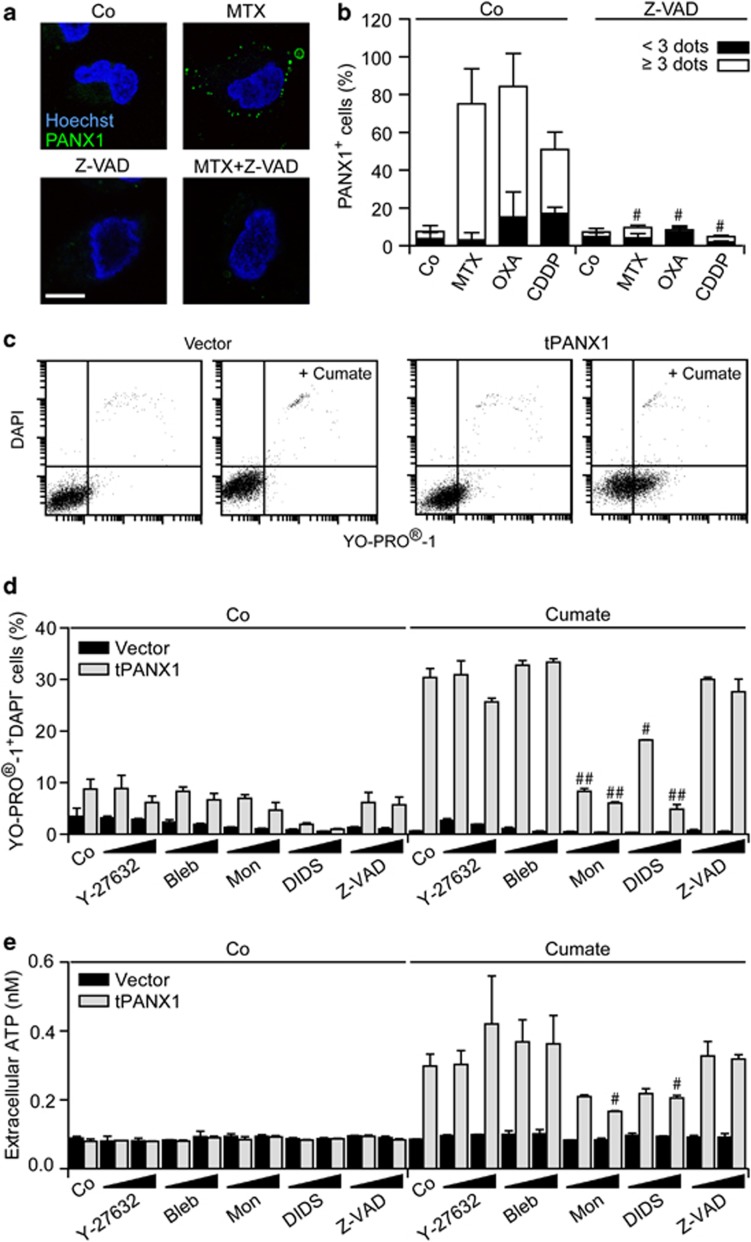
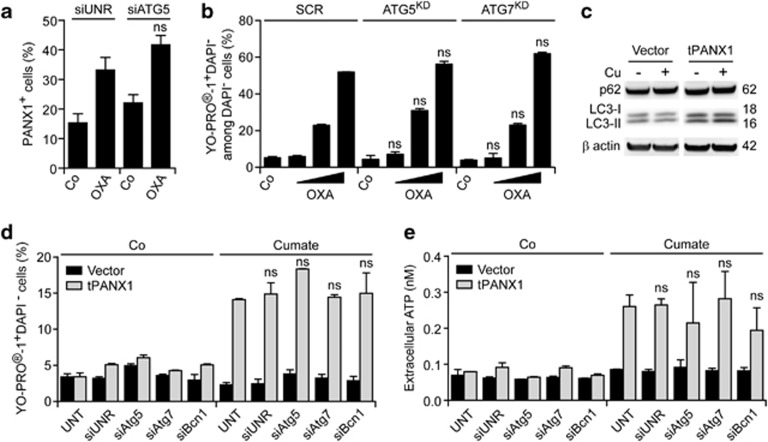
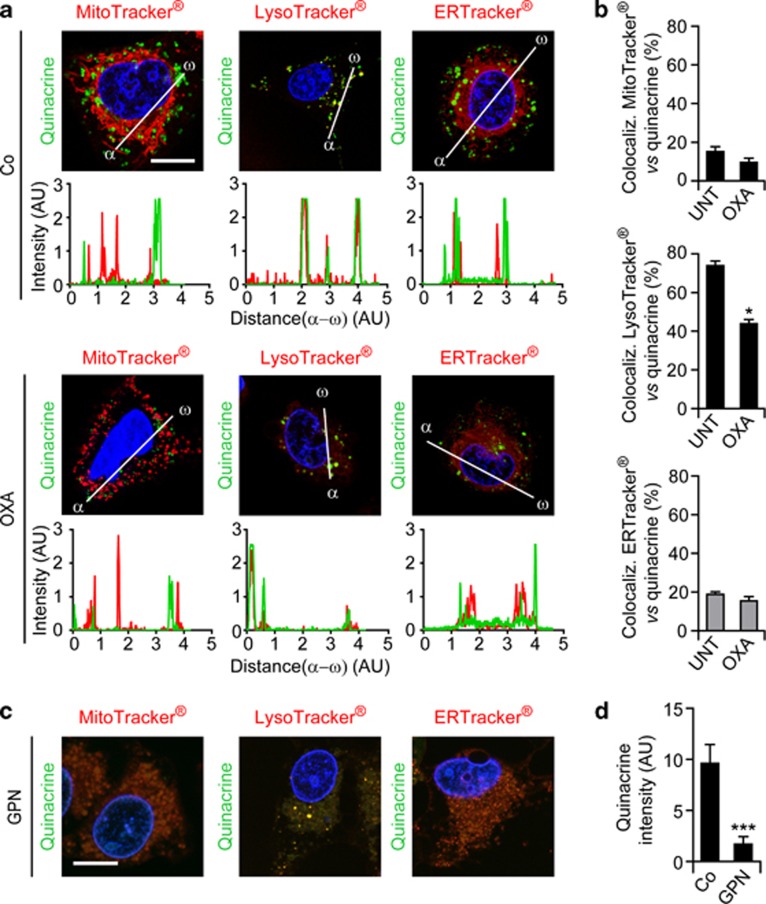
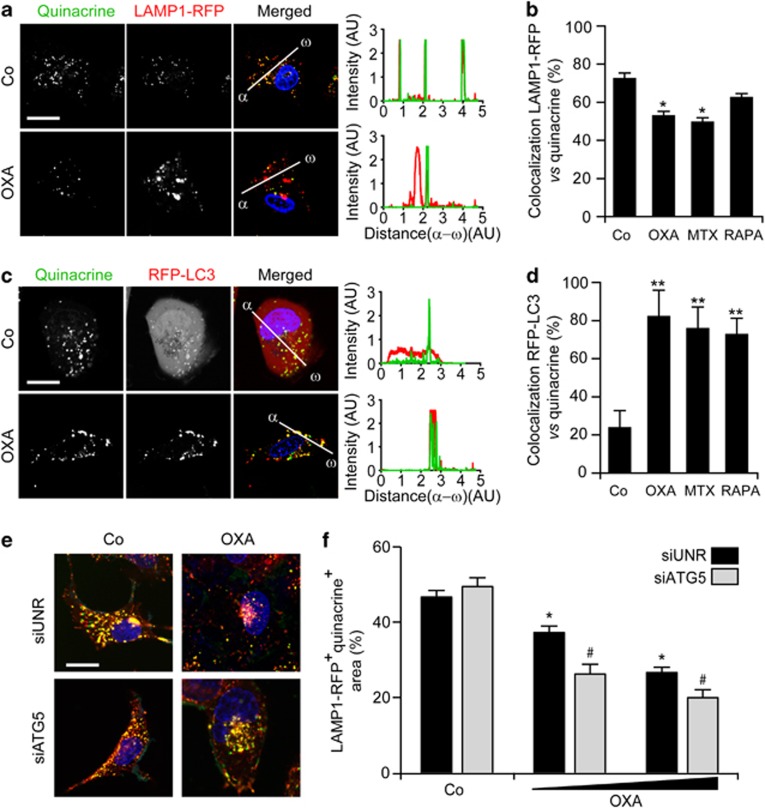
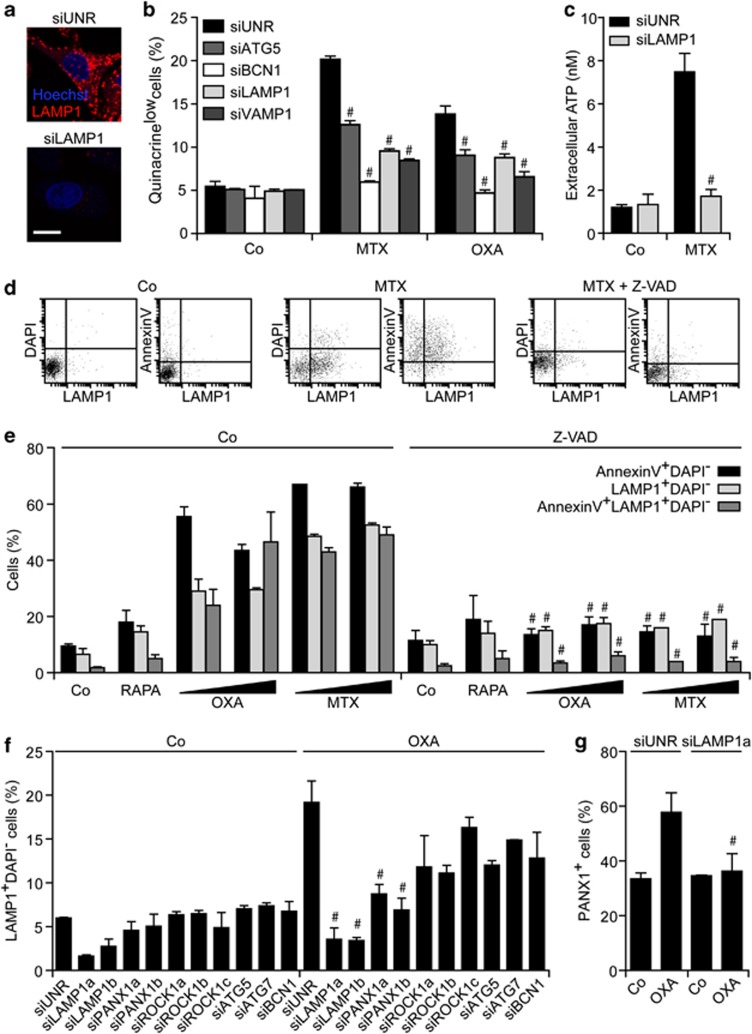
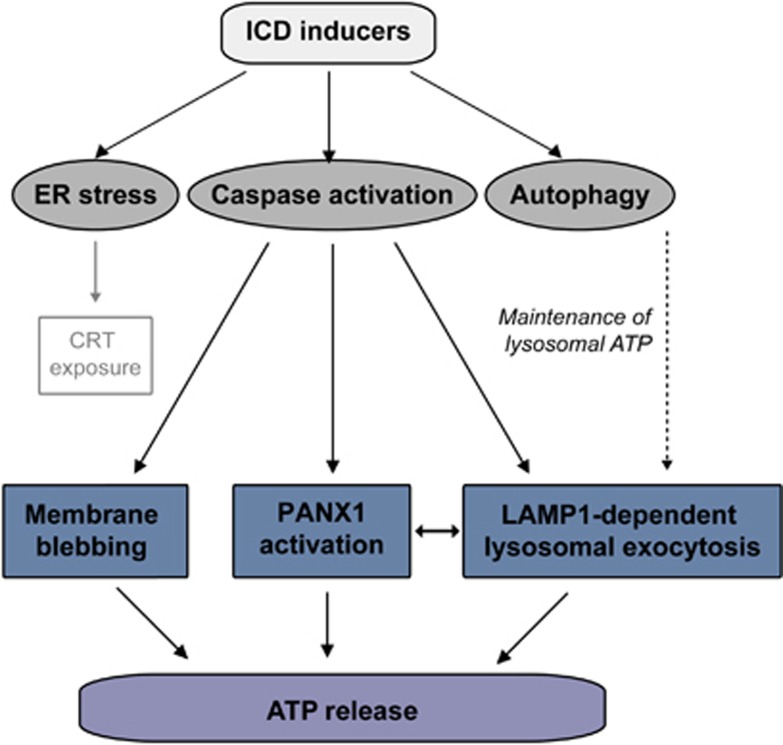
The immunogenic demise of cancer cells can be induced by various chemotherapeutics, such as anthracyclines and oxaliplatin, and provokes an immune response against tumor-associated antigens. Thus, immunogenic cell death (ICD)-inducing antineoplastic agents stimulate a tumor-specific immune response that determines the long-term success of therapy. The release of ATP from dying cells constitutes one of the three major hallmarks of ICD and occurs independently of the two others, namely, the pre-apoptotic exposure of calreticulin on the cell surface and the postmortem release of high-mobility group box 1 (HMBG1) into the extracellular space. Pre-mortem autophagy is known to be required for the ICD-associated secretion of ATP, implying that autophagy-deficient cancer cells fail to elicit therapy-relevant immune responses in vivo. However, the precise molecular mechanisms whereby ATP is actively secreted in the course of ICD remain elusive. Using a combination of pharmacological screens, silencing experiments and techniques to monitor the subcellular localization of ATP, we show here that, in response to ICD inducers, ATP redistributes from lysosomes to autolysosomes and is secreted by a mechanism that requires the lysosomal protein LAMP1, which translocates to the plasma membrane in a strictly caspase-dependent manner. The secretion of ATP additionally involves the caspase-dependent activation of Rho-associated, coiled-coil containing protein kinase 1 (ROCK1)-mediated, myosin II-dependent cellular blebbing, as well as the opening of pannexin 1 (PANX1) channels, which is also triggered by caspases. Of note, although autophagy and LAMP1 fail to influence PANX1 channel opening, PANX1 is required for the ICD-associated translocation of LAMP1 to the plasma membrane. Altogether, these findings suggest that caspase- and PANX1-dependent lysosomal exocytosis has an essential role in ATP release as triggered by immunogenic chemotherapy.


Figures

Figure 1
Figure 1
Intra- and extracellular ATP levels in the course of immunogenic cell death. (a and b) Human osteosarcoma U2OS cells were maintained in control conditions (Co) or treated with 30 mM 2-deoxyglucose (2-DG), 2 μg/ml antimycin A (AA), 150, 300 or 600 μM oxaliplatin (OXA) or 1, 2 or 4 μM mitoxantrone (MTX, 4 μM when not otherwise indicated), alone or combined with 50 μM Z-VAD-fmk (Z-VAD) for 24 h, and then co-stained for the cytofluorometric detection of intracellular ATP (with quinacrine, green fluorescence) and phosphatidylserine exposure (with PE-conjugated AnnexinV, red fluorescence). Representative dot plots and quantitative data (means±S.E.M., n=3) are reported. *P<0.05, ***P<0.001 (Student's t-test), as compared with cells maintained in Co conditions; ##P<0.01 (Student's t-test), as compared with cells treated with 4 μM MTX only. (c and d) U2OS cells were maintained in Co conditions or treated with 4 μM MTX for 18 h, and then co-stained for the cytofluorometric detection of plasma membrane integrity (with DAPI, blue fluorescence), mitochondrial transmembrane potential (with TMRM, red fluorescence) and phosphatidylserine exposure (with FITC-conjugated AnnexinV, green fluorescence). DAPI cells were then sorted according to TMRM and FITC signals, as indicated (c) and either immediately lysed for the assessment of intracellular ATP levels or re-placed in culture for 1 h, followed by the quantification of ATP secretion in culture supernatants (d). Representative dot plots and quantitative data (means±S.E.M., n=3) are reported. *P<0.05 (Student's t-test) as compared with cells in gate Ø. (e) Murine fibrosarcoma MCA205 cells stably transfected with either a scrambled (SCR) or an Atg5-targeting shRNA (Atg5KD) were maintained in Co conditions or treated with 4 μM MTX alone or in combination with 3 μM ARL67156 (ARL) for the indicated time, followed by the assessment of ATP secretion into culture supernatants. Quantitative data (means±S.E.M., n=3) are reported. *P<0.05 (Student's t-test) as compared with cells maintained in Co conditions or treated with ARL only for 48 h
Figure 2
Figure 2
Chemical library screen for the identification of ATP release inhibitors. (a and b) Human osteosarcoma U2OS cells were treated with 1530 compounds from the ICCB Known Bioactives Library (final concentration 30 μM) or the US-Drug collection (final concentration 1 μM), alone or combined with 4 μM mitoxantrone (MTX), for 18 h, and then stained for the fluorescence microscopy-assisted detection of nuclei (with Hoechst 33342, blue fluorescence) and ATP-containing vesicles (with quinacrine, green fluorescence). Representative images (scale bar=10 μm) and quantitative data are reported. Each dot represents the normalized mean quinacrine fluorescence associated with one compound alone (x axis) and combined with MTX (y axis). (c and d) U2OS cells were maintained in control (Co) conditions or treated with 60 μM Y-27632, 2 μM H-1152, 25 μM blebbistatin (Bleb), 5 μM monensin (Mon), 10 μM 4,4′-diisothiocyano-2,2'-stilbenedisulfonic acid (DIDS), 10 μM 4-acetamido-4-isothiocyano-stilbene-2,2-disulfonic acid (SITS) and 10 μM mefloquine (Meflo), alone or combined with 4 μM MTX, for 18 h, and then stained for the cytofluorometric (c) or luminometric (d) quantification of ATP levels. Quantitative data (means±S.E.M., n=3) are reported. #P<0.05 (Student's t-test) as compared with cells treated with MTX only. (e) U2OS cells were transfected with a non-targeting siRNA (siUNR) or with the indicated siRNAs for 48 h, and then maintained in Co conditions or treated with 4 μM MTX for additional 18 h. Eventually, ATP release in culture supernatants was monitored by a luciferase-based test. #P<0.05, ##P<0.01 (Student's t-test) as compared with siUNR-transfected cells treated with MTX only
Figure 3
Figure 3
ATP release through PANX1 channels. (a and b) Human osteosarcoma U2OS cells were maintained in control conditions (Co) or treated with 2 μM mitoxantrone (MTX), 300 μM oxaliplatin (OXA) and 75 μM cisplatin (CDDP), alone or in combination with 50 μM Z-VAD-fmk (Z-VAD-fmk), for 18 h, and stained for the fluorescence microscopy-assisted detection of nuclei (with Hoechst 33342, blue fluorescence) and PANX1 at the cell surface (green fluorescence). Representative images (scale bar=10 μm) and the % of cells exhibiting <3 or ≥3 PANX1 dots are reported (means±S.E.M., n>100 cells). #P<0.05 (Student's t-test) as compared with cells treated with MTX, OXA or CDDP only. (ce) Murine fibrosarcoma MCA205 cells stably transfected with a construct coding for truncated PANX1 (tPANX1) under the control of a cumate-inducible promoter or with the corresponding empty vector were maintained in Co conditions or treated with 15 or 30 μM Y-27632, 5 or 10 μM blebbistatin (Bleb), 2.5 or 5 μM monensin (Mon), 5 or 10 μM 4,4′-diisothiocyano-2,2'-stilbenedisulfonic acid (DIDS) or 25 or 50 μM Z-VAD-fmk (Z-VAD) for 4 h, and then exposed or not to cumate for additional 48 h. Finally, cells were processed for the cytofluorometric detection of YO-PRO-1 and DAPI uptake (c and d) and ATP concentration in supernatants was assayed by a luciferase-based assay (e). Representative dot plots and quantitative data (means±S.E.M., n=3) are reported. #P<0.05, ##P<0.01 (Student's t-test) as compared with cells treated with cumate only
Figure 4
Figure 4
Autophagy-independent ATP release through PANX1 channels. (a) Human osteosarcoma U2OS cells were transfected with a non-targeting siRNA (siUNR) or with a siRNA specific for ATG5 for 48 h, then maintained in control (Co) conditions or treated with 300 μM oxaliplatin (OXA) for additional 18 h. Finally, cells were processed for the immunofluorescence microscopy-assisted detection of PANX1 at the cell surface. The percentage of cells exhibiting ≥3 PANX1 dots are reported (means±S.E.M., n>100 cells). ns, non-significant (Student's t-test) as compared with siUNR-transfected, OXA-treated cells. (b) Murine fibrosarcoma MCA205 cells stably transfected with either a scrambled (SCR) shRNA or shRNAs targeting Atg5 (Atg5KD) or Atg7 (Atg7KD) were maintained in Co conditions or treated with 75, 150 or 300 μM OXA for 18 h, followed by the cytofluorometric detection of YO-PRO-1 and DAPI uptake. Quantitative data are reported (means±S.E.M., n=3). ns, non-significant (Student's t test) as compared with equally treated SCR cells. (c) Murine fibrosarcoma MCA205 cells stably transfected with a construct coding for truncated PANX1 (tPANX1) under the control of a cumate-inducible promoter or with the corresponding empty vector were treated or not with cumate (Cu) for 48 h, followed by the immunoblotting-assisted detection of the indicated autophagic markers. β-actin levels were monitored to ensure equal lane loading. (d and e) MCA205 cells stably transfected with a plasmid-encoding tPANX1 or the corresponding empty vector were left untransfected (UNT) or transiently transfected with a non-targeting siRNA (siUNR) or with the indicated autophagy-modulatory siRNAs for 48 h, and then exposed or not to cumate for additional 48 h. Eventually, cells were subjected to the cytofluorometric detection of YO-PRO-1 and DAPI uptake, whereas ATP levels in culture supernatants were quantified by means of a luciferase-based assay. Quantitative data (means±S.E.M., n=3) are reported. ns, non-significant (Student's t-test) as compared with UNT cells treated with cumate only
Figure 5
Figure 5
Co-localization between ATP-containing vesicles and lysosomes. (ad) Human osteosarcoma U2OS cells were maintained in control conditions (Co), incubated with 600 μM oxaliplatin (OXA) for 18 h (a and b) or with 300 μM glycyl-L-phenylalanine 2-naphthylamide (GPN) for 15 min (c and d), and then co-stained for the fluorescence microscopy-assisted visualization of nuclei (with Hoechst 33342, blue fluorescence), ATP-containing vesicles (with quinacrine, green fluorescence) and mitochondria (with MitoTracker Red), lysosomes (with LysoTracker Red) or the endoplasmic reticulum (with ERTracker Red). Representative images (scale bar=10 μm), representative fluorescent signals along randomly assigned αω axes and quantitative data (means±S.E.M., n=3) are reported. *P<0.05, ***P<0.001 (Student's t-test) as compared with cells maintained in Co conditions
Figure 6
Figure 6
Chemotherapy-induced ATP redistribution into autophago(lyso)somes. (ad) Human osteosarcoma U2OS cells stably transfected with a plasmid coding for a LAMP1-RFP (a and b) or a RFP-LC3 (c and d) chimera were maintained in control conditions (Co) or treated with 600 μM oxaliplatin (OXA), 4 μM mitoxantrone (MTX) or 1 μM rapamycin (RAPA) for 18 h, and then processed for the fluorescence microscopy-assisted visualization of nuclei (with Hoechst 33342, blue fluorescence), ATP-containing vesicles (with quinacrine, green fluorescence) and LAMP1-RFP (a and b) or RFP-LC3 (c and d; both emitting in red). Representative images (scale bar=10 μm), representative fluorescent signals along randomly assigned αω axes and quantitative data (means±S.E.M., n=3) are reported. *P<0.05, **P<0.01 (Student's t-test) as compared with cells maintained in Co conditions. (e and f) U2OS cells stably expressing LAMP1-RFP were transfected with a non-targeting siRNA (siUNR) or with a siRNA targeting ATG5 for 48 h, and then were either maintained in Co conditions or treated with 300 or 600 μM OXA for additional 18 h. Finally, cells were processed for the fluorescence microscopy-assisted visualization of nuclei (with Hoechst 33342, blue fluorescence), ATP-containing vesicles (with quinacrine, green fluorescence) and LAMP1-RFP (emitting in red). Representative images (scale bar=10 μm) and quantitative data on the % of the LAMP1-RFP+ intracellular surface not stained with quinacrine (means±S.E.M., n=3) are reported. *P<0.05 (Student's t-test) as compared with siUNR-transfected cells maintained in Co conditions; #P<0.05 (Student's t-test) as compared with siUNR-transfected cells treated with the same dose of OXA
Figure 7
Figure 7
Lysosomes and autophago(lyso)somes participate in the trafficking and/or in the maintenance of the intracellular ATP pool. (ac) Human osteosarcoma U2OS cells were transfected with a non-targeting siRNA (siUNR) or with the indicated siRNAs for 48 h, and then maintained in control conditions (Co) or treated with 4 μM mitoxantrone (MTX) or 300 μM oxaliplatin (OXA) for additional 18 h. Finally, cells were processed for the fluorescence microscopy-assisted visualization of nuclei (with Hoechst 33342, blue fluorescence), ATP-containing vesicles (with quinacrine, green fluorescence) or LAMP1 (revealed with an secondary antibody emitting in red) (a and b), and ATP levels in culture supernatants assessed by a luciferase-based test (c). Representative images (scale bar=10 μm) and quantitative data (means±S.E.M., n=3) are reported. #P<0.05 (Student's t-test), as compared with siUNR-transfected cells treated with MTX or OXA, as appropriate. (d and e) U2OS cells were maintained in Co conditions or treated with 1 μM rapamycin (RAPA), 150 or 300 μM OXA, or 2 or 4 μM MTX, alone or in combination with 50 μM Z-VAD-fmk (Z-VAD), for 18 h. Thereafter, LAMP1 exposure (with a LAMP1-specific antibody revealed in red), phosphatidylserine externalization (with FITC-conjugated AnnexinV, green fluorescence) and cell death-associated plasma membrane permeabilization (with DAPI, blue fluorescence) were monitored by flow cytometry. Quantitative data (means±S.E.M., n=3) are reported. #P<0.05 (Student's t-test), as compared with cells treated with an equivalent concentration of OXA or MTX in the absence of Z-VAD. (f and g) U2OS cells were transfected with siUNR or with the indicated siRNAs for 48 h, and then either left untreated (Co) or exposed to 300 μM OXA for 18 h. Finally, either LAMP1 exposure (with a LAMP1-specific antibody revealed in red), and cell death-associated plasma membrane permeabilization (with DAPI, blue fluorescence) was assessed by cytofluorometry (f), or PANX1 exposure was determined by immunofluorescence microscopy (g). Quantitative data (means±S.E.M., n=3) are reported. #P<0.05 (Student's t-test), as compared with siUNR-transfected cells treated with OXA
Figure 8
Figure 8
Mechanism of ATP secretion during immunogenic cell death (ICD). ICD inducers such as mitoxantrone and oxaliplatin simultaneously activate various cytoprotective and cytotoxic signaling pathways, including the endoplasmic reticulum (ER) stress response, which is responsible for the exposure of calreticulin (CRT) on the cell surface; the caspase cascade, which – among various pro-apoptotic functions – mediates cell blebbing as well as the activation of pannexin 1 (PANX1); and autophagy, which is required for the trafficking/maintenance of vesicular ATP pools. A complex crosstalk among all these signaling modules appears to be required for the ICD-associated release of ATP

References

    1. Galluzzi L, Senovilla L, Zitvogel L, Kroemer G. The secret ally: immunostimulation by anticancer drugs. Nat Rev Drug Discov. 2012;11:215–233. - PubMed
    1. Kroemer G, Galluzzi L, Kepp O, Zitvogel L. Immunogenic cell death in cancer therapy. Annu Rev Immunol. 2013;31:51–72. - PubMed
    1. Krysko DV, Garg AD, Kaczmarek A, Krysko O, Agostinis P, Vandenabeele P. Immunogenic cell death and DAMPs in cancer therapy. Nat Rev Cancer. 2012;12:860–875. - PubMed
    1. Vanneman M, Dranoff G. Combining immunotherapy and targeted therapies in cancer treatment. Nat Rev Cancer. 2012;12:237–251. - PMC - PubMed
    1. Galluzzi L, Vitale I, Abrams JM, Alnemri ES, Baehrecke EH, Blagosklonny MV, et al. Molecular definitions of cell death subroutines: recommendations of the Nomenclature Committee on Cell Death 2012. Cell Death Differ. 2012;19:107–120. - PMC - PubMed

Publication types

MeSH terms