. 2013 Sep;163(1):161-79.
doi: 10.1104/pp.113.218453. Epub 2013 Jul 12.

Plasticity of the Arabidopsis root system under nutrient deficiencies

Affiliations

Plasticity of the Arabidopsis root system under nutrient deficiencies

Benjamin D Gruber et al. Plant Physiol. 2013 Sep.

Abstract

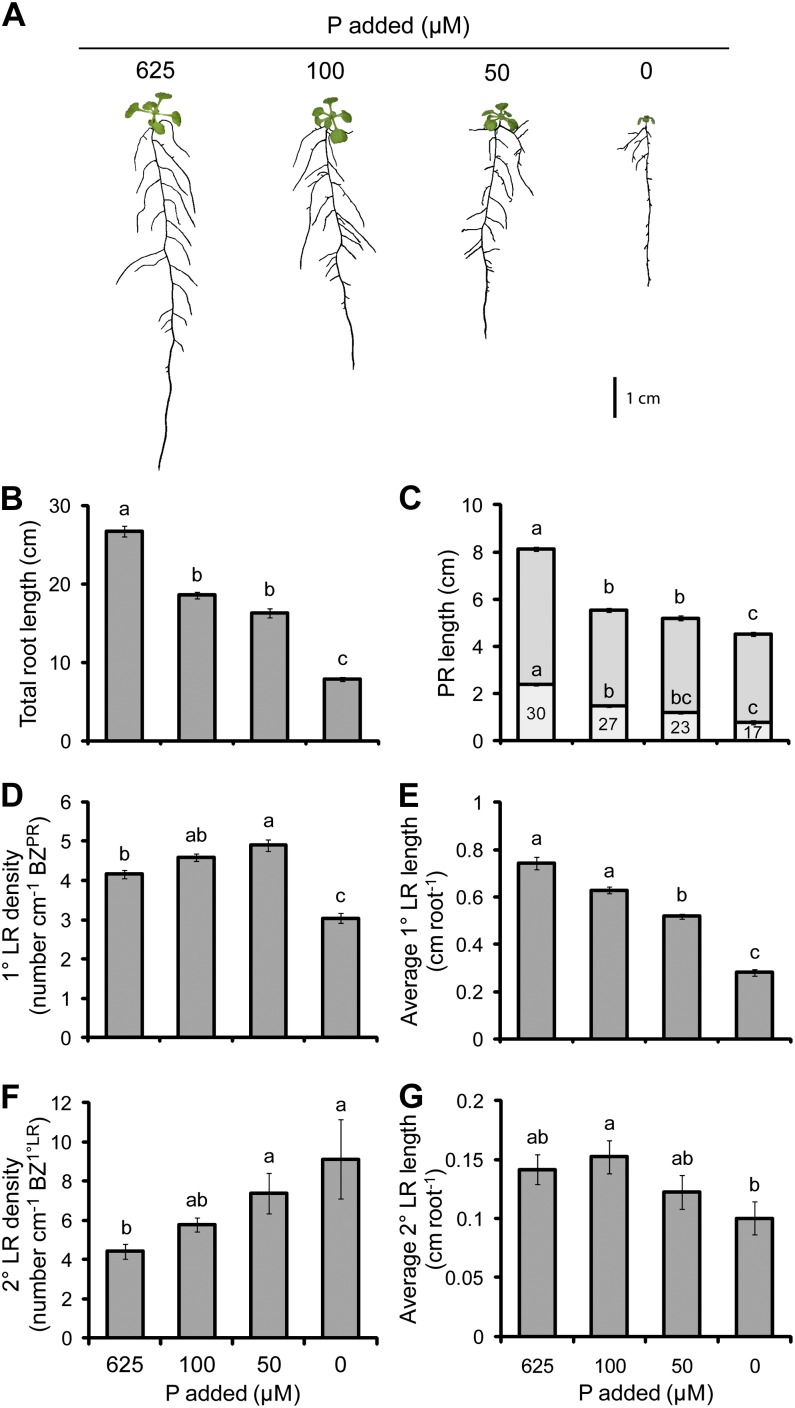
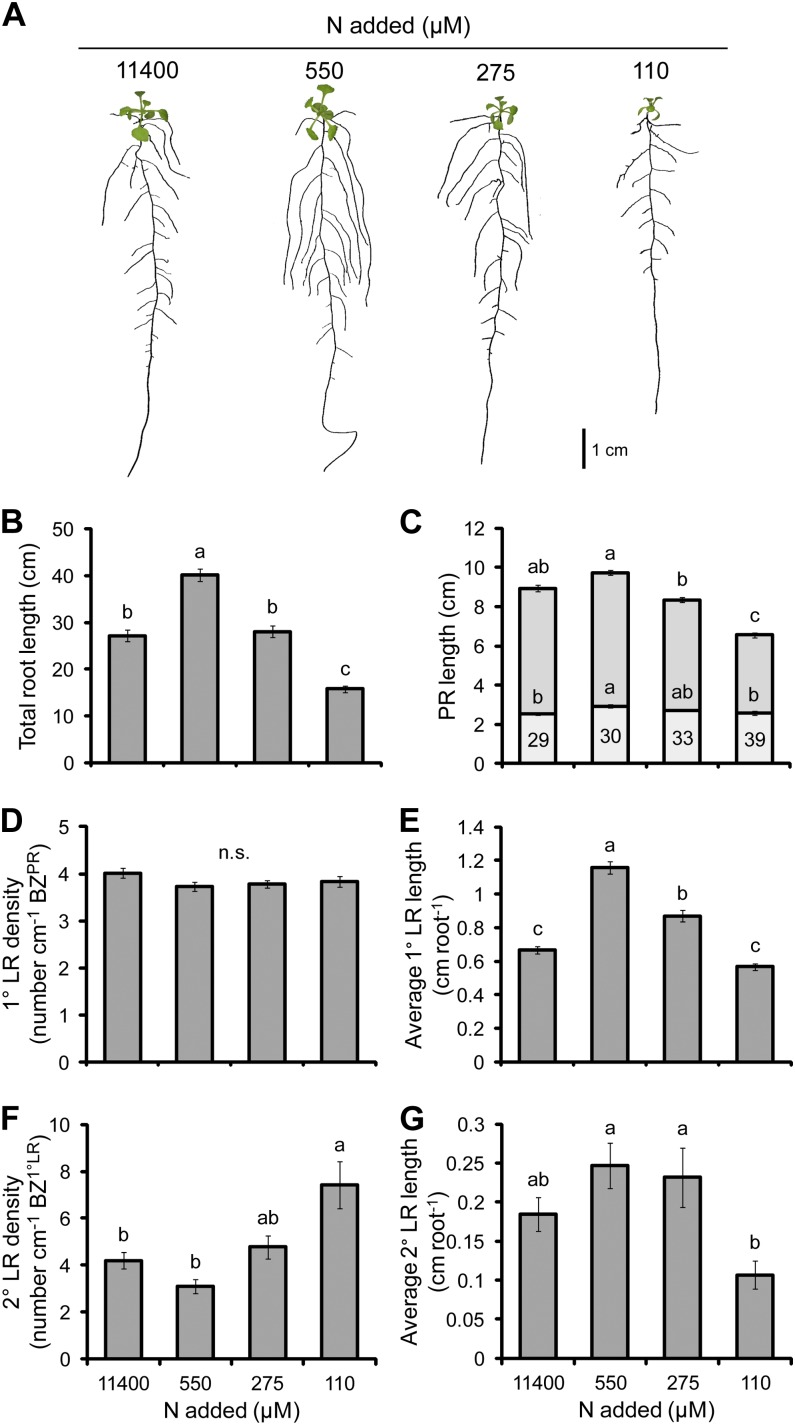
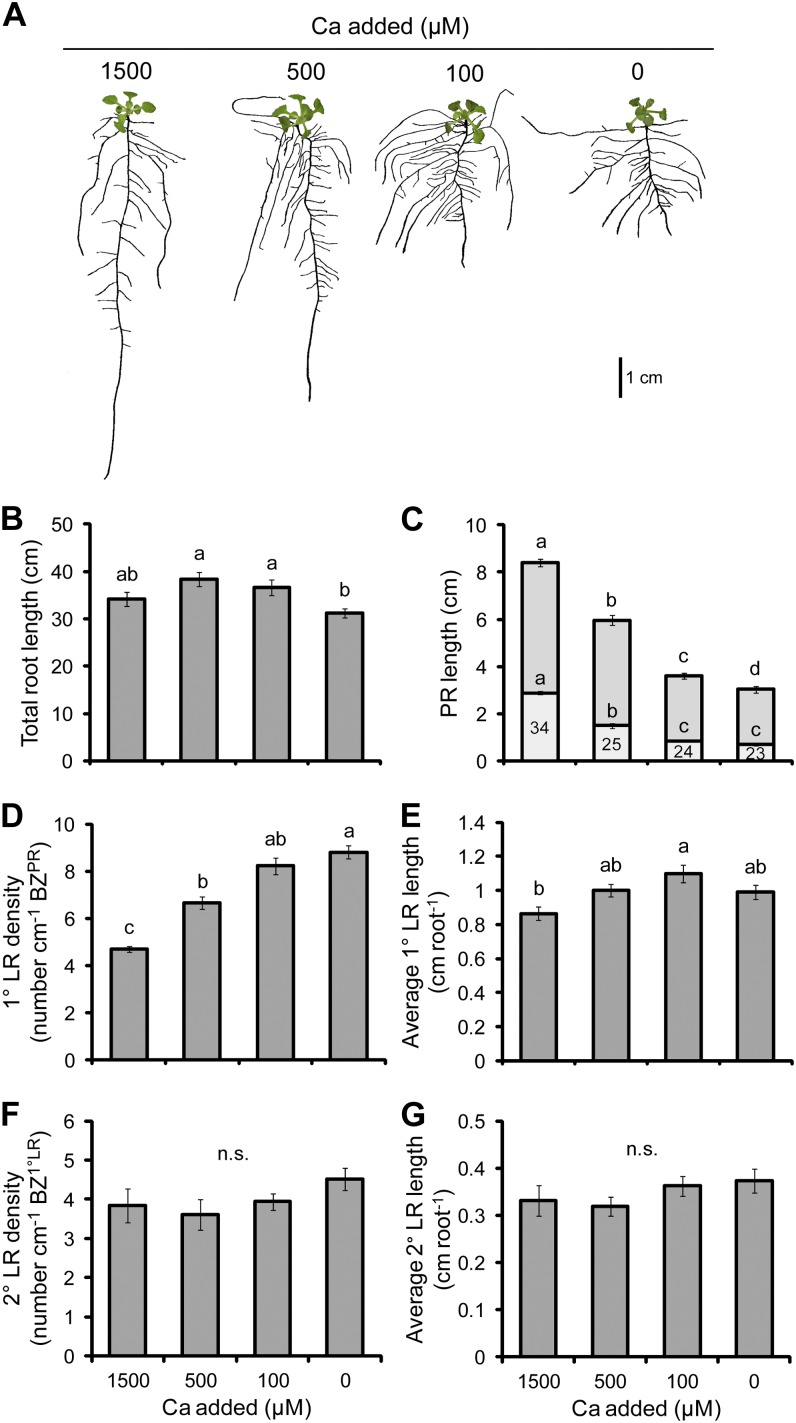
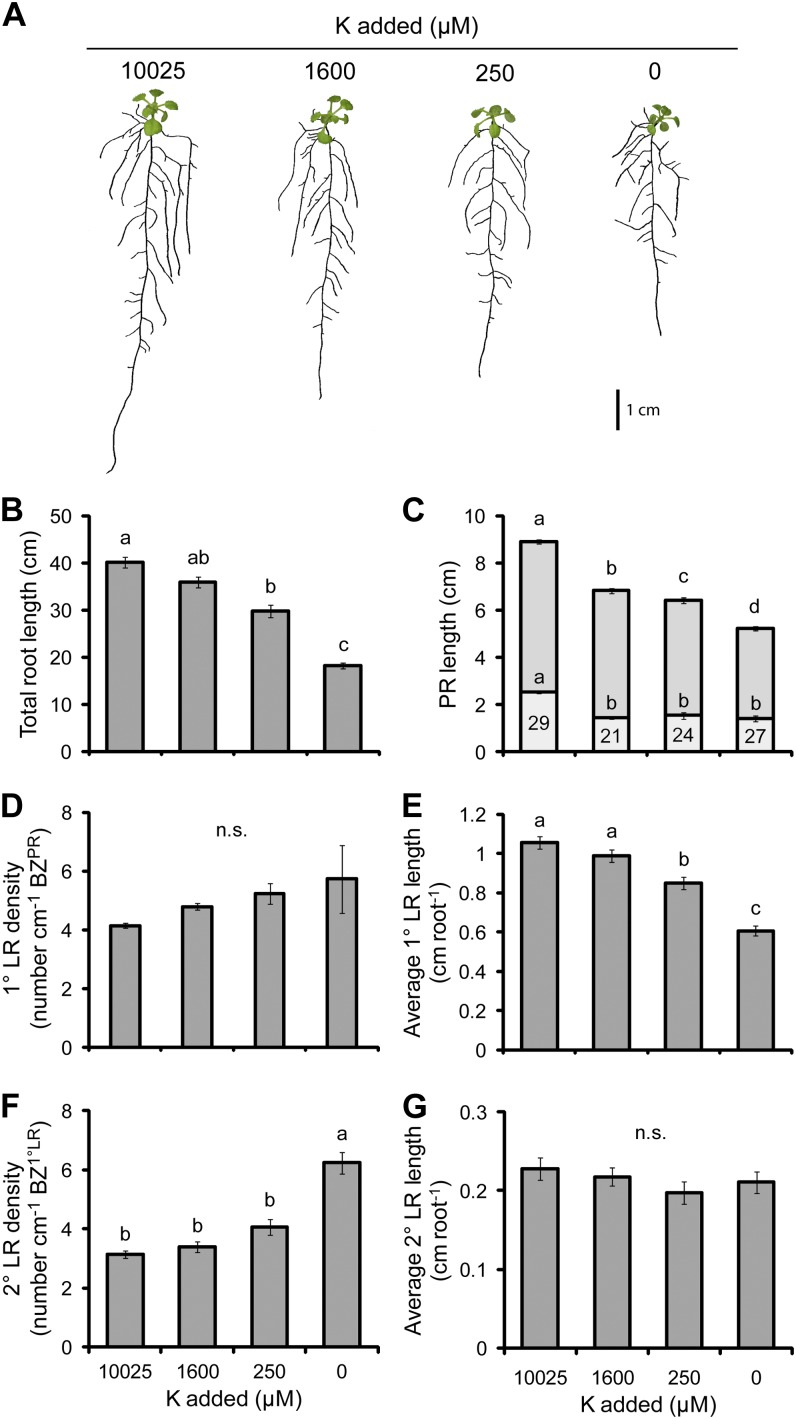
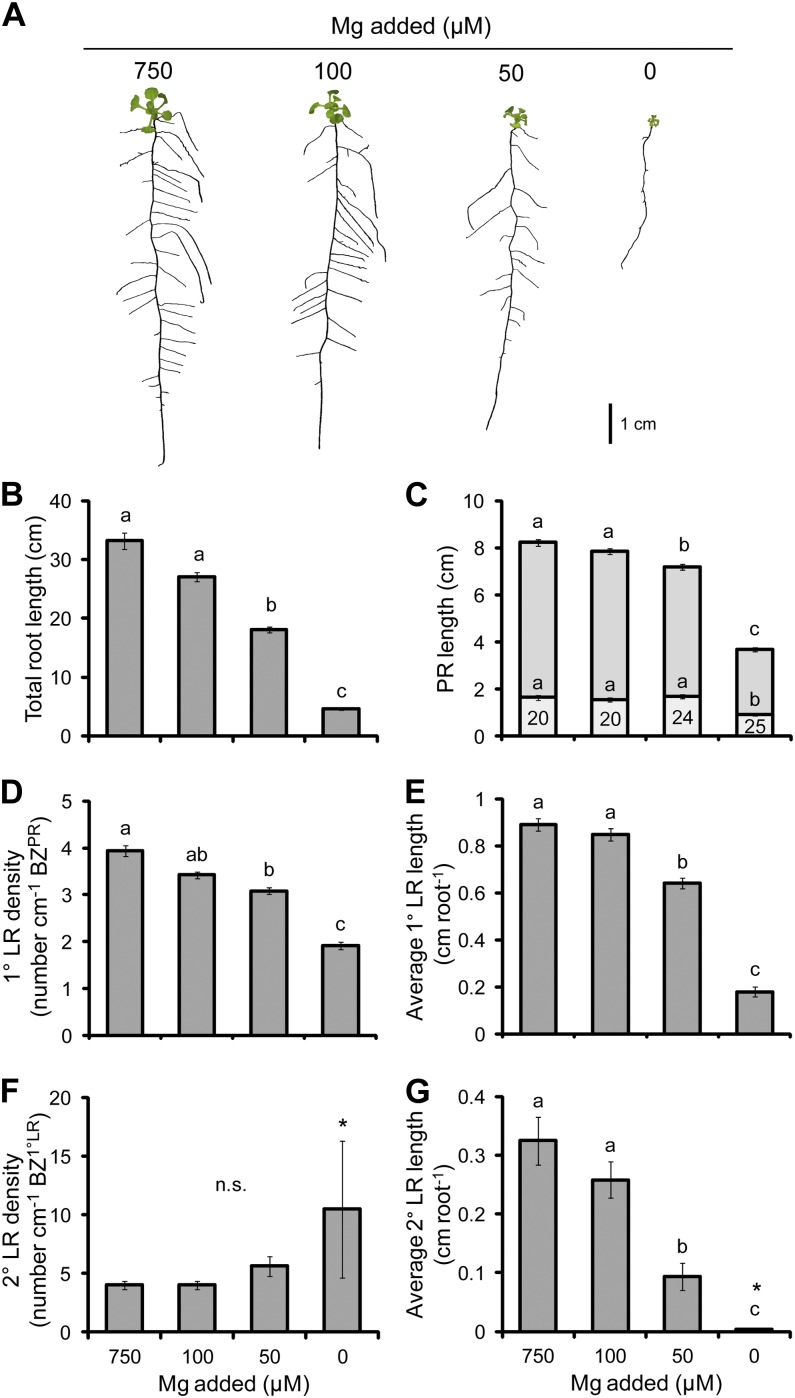
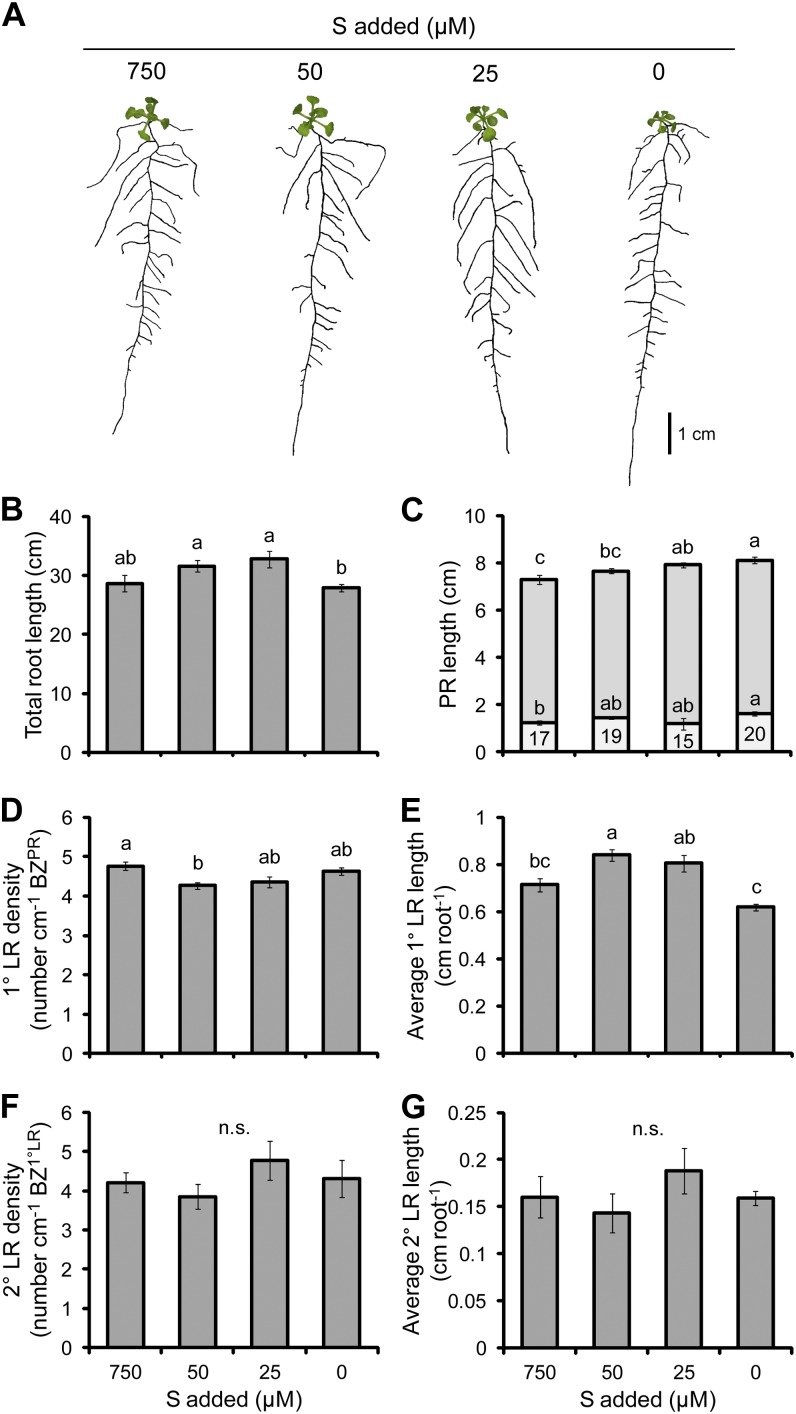
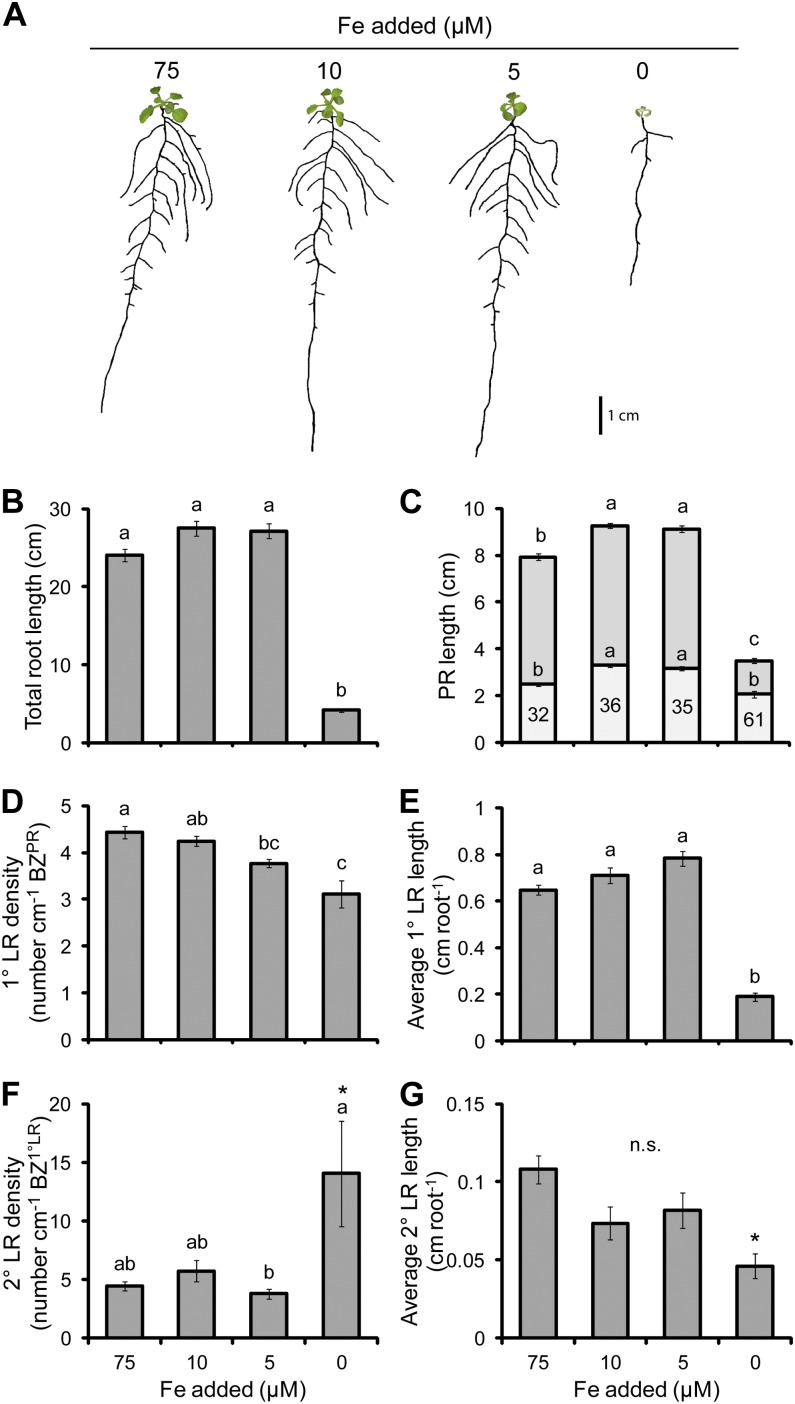
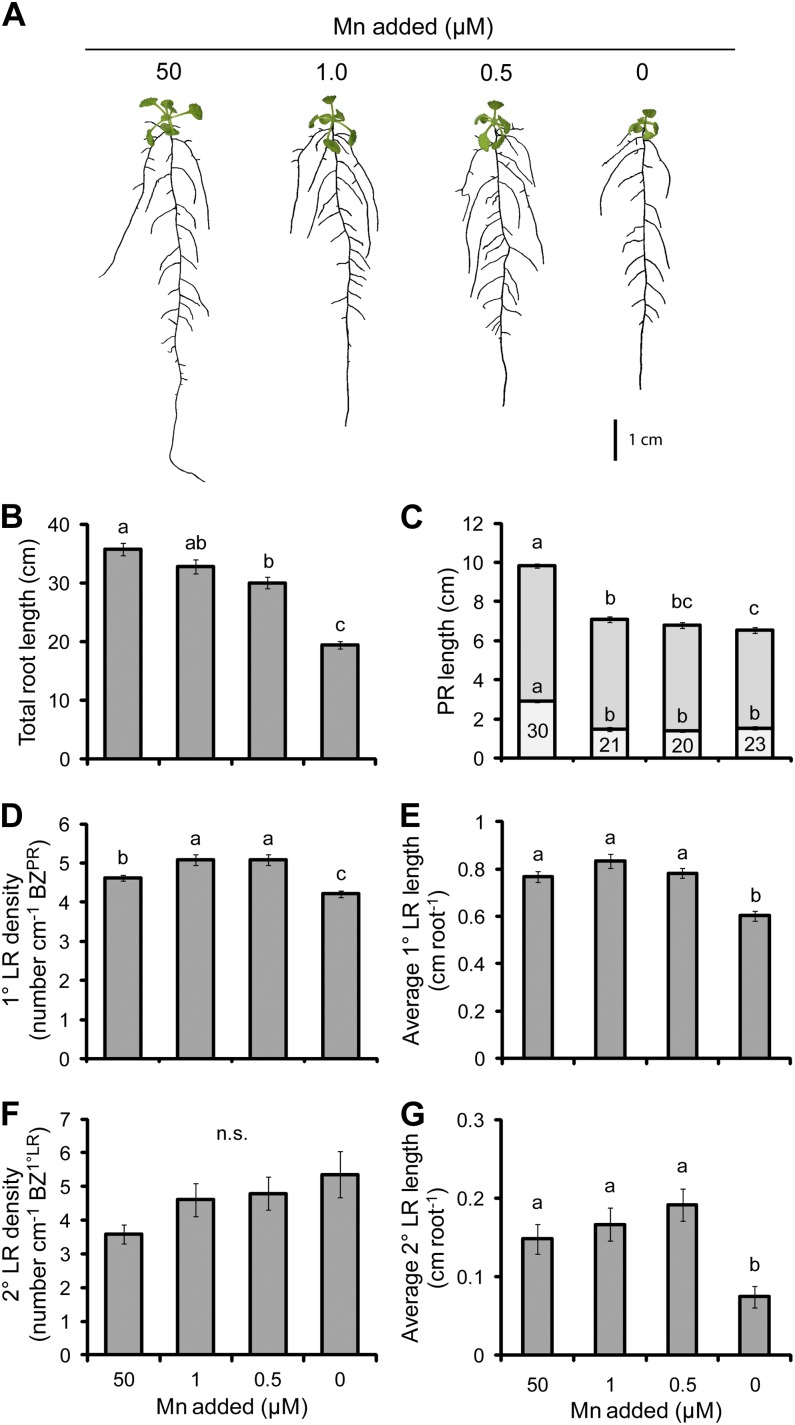
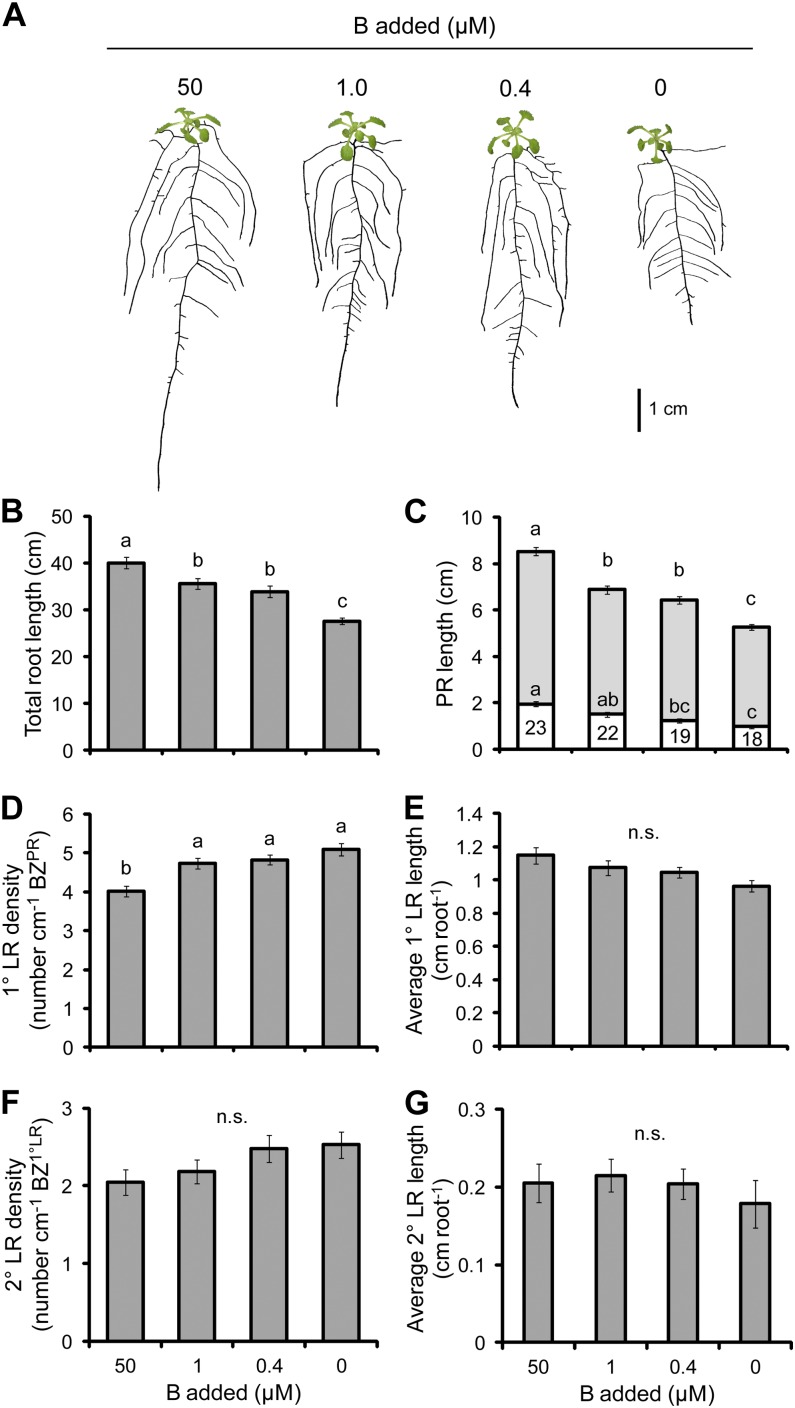
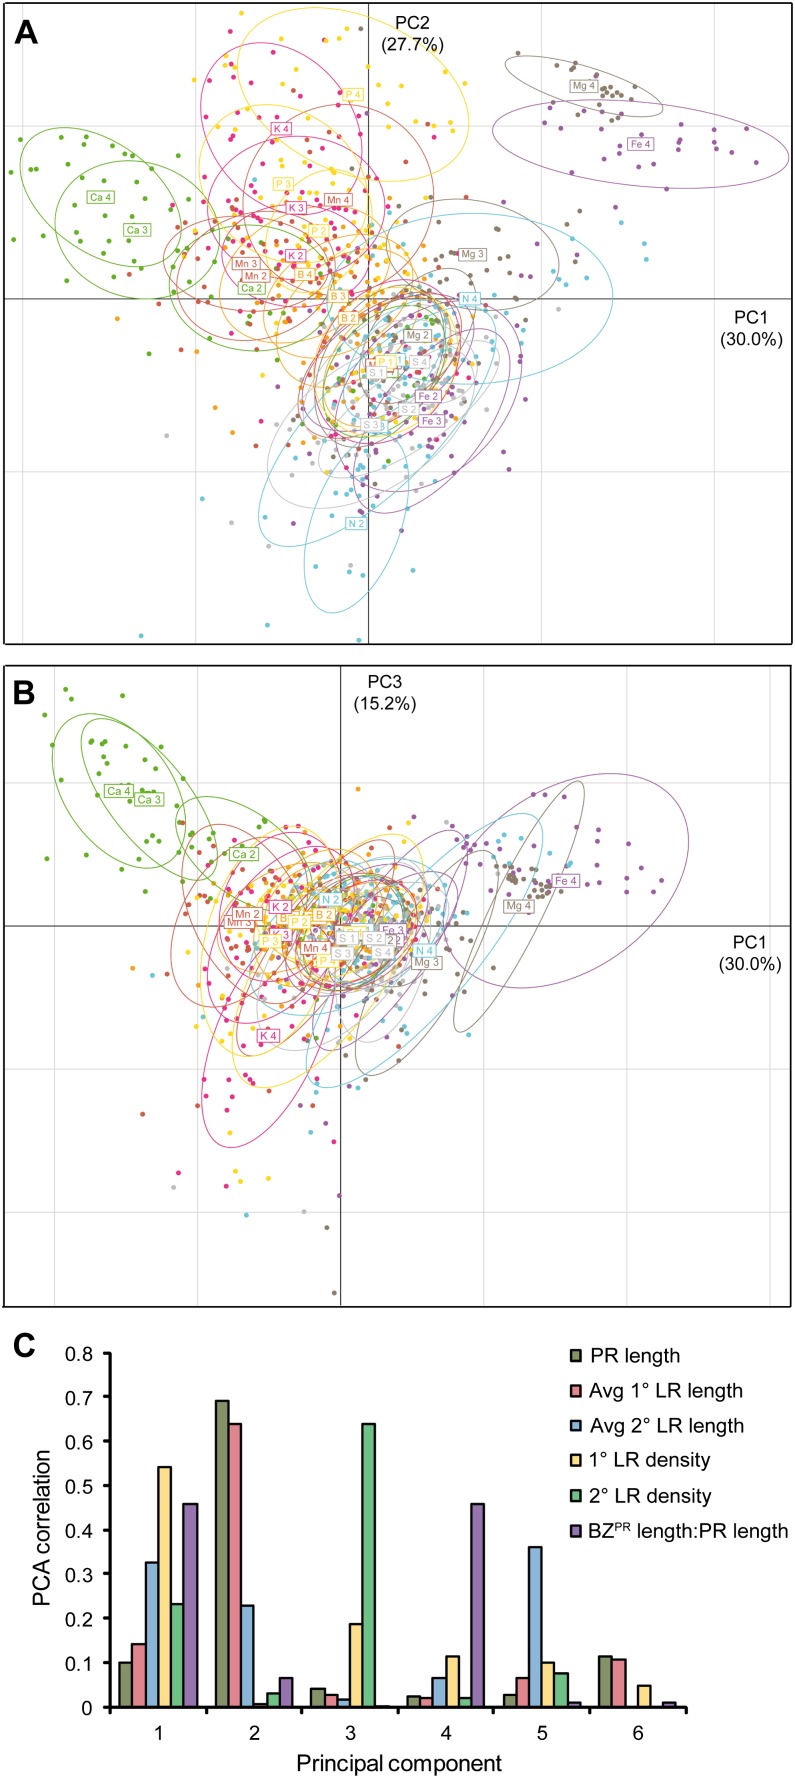
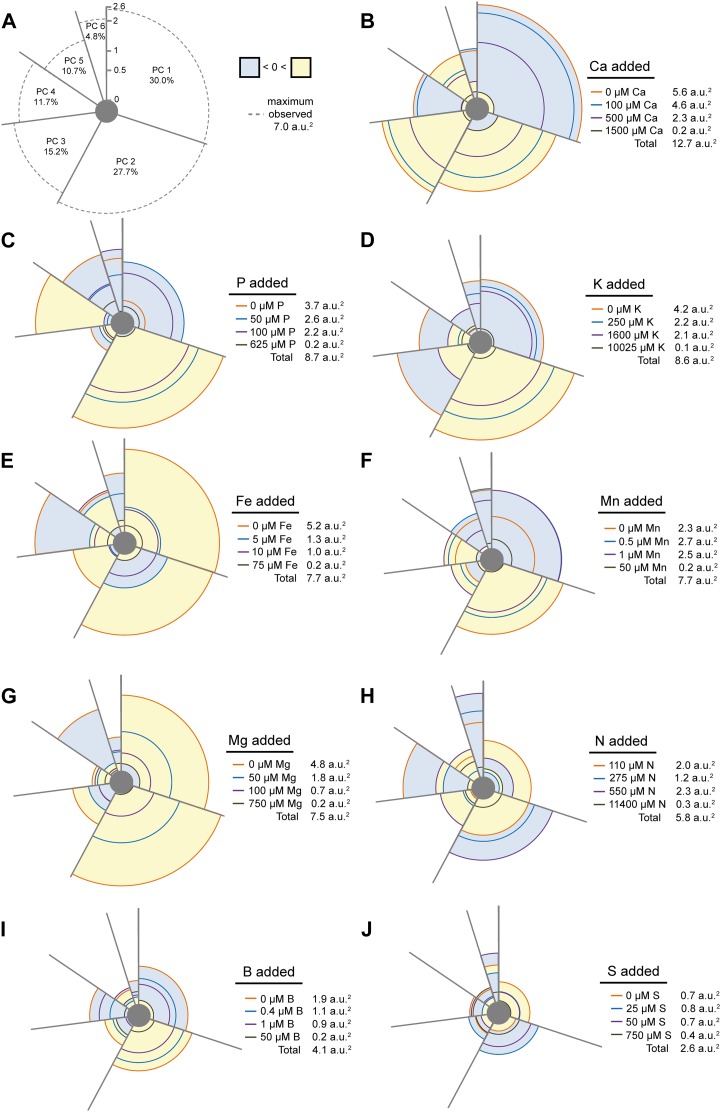
Plant roots show a particularly high variation in their morphological response to different nutrient deficiencies. Although such changes often determine the nutrient efficiency or stress tolerance of plants, it is surprising that a comprehensive and comparative analysis of root morphological responses to different nutrient deficiencies has not yet been conducted. Since one reason for this is an inherent difficulty in obtaining nutrient-deficient conditions in agar culture, we first identified conditions appropriate for producing nutrient-deficient plants on agar plates. Based on a careful selection of agar specifically for each nutrient being considered, we grew Arabidopsis (Arabidopsis thaliana) plants at four levels of deficiency for 12 nutrients and quantified seven root traits. In combination with measurements of biomass and elemental concentrations, we observed that the nutritional status and type of nutrient determined the extent and type of changes in root system architecture (RSA). The independent regulation of individual root traits further pointed to a differential sensitivity of root tissues to nutrient limitations. To capture the variation in RSA under different nutrient supplies, we used principal component analysis and developed a root plasticity chart representing the overall modulations in RSA under a given treatment. This systematic comparison of RSA responses to nutrient deficiencies provides a comprehensive view of the overall changes in root plasticity induced by the deficiency of single nutrients and provides a solid basis for the identification of nutrient-sensitive steps in the root developmental program.


Figures

Figure 1.
Figure 1.
The effect of P deficiency on root morphology. A, Seedlings subjected to differing P supplies. B, Total root length. C, PR length consisting of the BZPR (darker gray) and LR FZPR (lighter gray). D, 1° LR density. E, Average 1° LR length. F, 2° LR density. G, Average 2° LR length. The numbers within the LR FZPR bar of C indicate the length of the LR FZPR as a percentage of the total PR length. Seedlings were cultivated for 5 d with no P added and then grown on the P treatments indicated for a further 13 d. Bars show means ± se (n = 21–29). [See online article for color version of this figure.]
Figure 2.
Figure 2.
The effect of N deficiency on root morphology. A, Seedlings subjected to differing N supplies. B, Total root length. C, PR length consisting of the BZPR (darker gray) and LR FZPR (lighter gray). D, 1° LR density. E, Average 1° LR length. F, 2° LR density. G, Average 2° LR length. The numbers within the LR FZPR bar of C indicate the length of the LR FZPR as a percentage of the total PR length. Seedlings were cultivated for 4 d on 165 µm added N and then grown on the N treatments indicated for a further 14 d. Bars show means ± se (n.s. denotes not significant; n = 17–30). [See online article for color version of this figure.]
Figure 3.
Figure 3.
The effect of Ca deficiency on root morphology. A, Seedlings subjected to differing Ca supplies. B, Total root length. C, PR length consisting of the BZPR (darker gray) and LR FZPR (lighter gray). D, 1° LR density. E, Average 1° LR length. F, 2° LR density. G, Average 2° LR length. The numbers within the LR FZPR bar of C indicate the length of the LR FZPR as a percentage of the total PR length. Seedlings were cultivated for 7 d with no Ca added and then grown on the Ca treatments indicated for a further 10 d. Bars show means ± se (n.s. denotes not significant; n = 14–24). [See online article for color version of this figure.]
Figure 4.
Figure 4.
The effect of K deficiency on root morphology. A, Seedlings subjected to differing K supplies. B, Total root length. C, PR length consisting of the BZPR (darker gray) and LR FZPR (lighter gray). D, 1° LR density. E, Average 1° LR length. F, 2° LR density. G, Average 2° LR length. The numbers within the LR FZPR bar of C indicate the length of the LR FZPR as a percentage of the total PR length. Seedlings were cultivated for 7 d on 60 µm added K and then grown on the K treatments indicated for a further 12 d. Bars show means ± se (n.s. denotes not significant; n = 25–30). [See online article for color version of this figure.]
Figure 5.
Figure 5.
The effect of Mg deficiency on root morphology. A, Seedlings subjected to differing Mg supplies. B, Total root length. C, PR length consisting of the BZPR (darker gray) and LR FZPR (lighter gray). D, 1° LR density. E, Average 1° LR length. F, 2° LR density. G, Average 2° LR length. The numbers within the LR FZPR bar of C indicate the length of the LR FZPR as a percentage of the total PR length. Seedlings were cultivated for 4 d on 50 µm added Mg and then grown on the Mg treatments indicated for a further 14 d. Bars show means ± se (n.s. denotes not significant; n = 24–27, except that the bars marked with asterisks had only three 2° LRs). [See online article for color version of this figure.]
Figure 6.
Figure 6.
The effect of S deficiency on root morphology. A, Seedlings subjected to differing S supplies. B, Total root length. C, PR length consisting of the BZPR (darker gray) and LR FZPR (lighter gray). D, 1° LR density. E, Average 1° LR length. F, 2° LR density. G, Average 2° LR length. The numbers within the LR FZPR bar of C indicate the length of the LR FZPR as a percentage of the total PR length. Seedlings were cultivated for 6 d with no S added and then grown on the S treatments indicated for a further 11 d. Bars show means ± se (n.s. denotes not significant; n = 19–26). [See online article for color version of this figure.]
Figure 7.
Figure 7.
The effect of Fe deficiency on root morphology. A, Seedlings subjected to differing Fe supplies. B, Total root length. C, PR length consisting of the BZPR (darker gray) and LR FZPR (lighter gray). D, 1° LR density. E, Average 1° LR length. F, 2° LR density. G, Average 2° LR length. The numbers within the LR FZPR bar of C indicate the length of the LR FZPR as a percentage of the total PR length. Seedlings were cultivated for 4 d with no Fe added and then grown on the Fe treatments indicated for a further 12 d. Bars show means ± se (n.s. denotes not significant; n = 19–30, except that the bars indicated with asterisks had only two 2° LRs). [See online article for color version of this figure.]
Figure 8.
Figure 8.
The effect of Mn deficiency on root morphology. A, Seedlings subjected to differing Mn supplies. B, Total root length. C, PR length consisting of the BZPR (darker gray) and LR FZPR (lighter gray). D, 1° LR density. E, Average 1° LR length. F, 2° LR density. G, Average 2° LR length. The numbers within the LR FZPR bar of C indicate the length of the LR FZPR as a percentage of the total PR length. Seedlings were cultivated for 4 d with no Mn added and then grown on the Mn treatments indicated for a further 13 d. Bars show means ± se (n.s. denotes not significant; n = 16–28). [See online article for color version of this figure.]
Figure 9.
Figure 9.
The effect of B deficiency on root morphology. A, Seedlings subjected to differing B supplies. B, Total root length. C, PR length consisting of the BZPR (darker gray) and LR FZPR (lighter gray). D, 1° LR density. E, Average 1° LR length. F, 2° LR density. G, Average 2° LR length. The numbers within the LR FZPR bar of C indicate the length of the LR FZPR as a percentage of the total PR length. Seedlings were cultivated for 7 d with no B added and then grown on the B treatments indicated for a further 12 d. Bars show means ± se (n.s. denotes not significant; n = 23–26). [See online article for color version of this figure.]
Figure 10.
Figure 10.
PCA of the modifications in RSA in response to nutrient deficiencies. PCA was based on PR length, average 1° LR length, 1° LR density, average 2° LR length, 2° LR density, and the ratio between BZPR and PR length under the supply of different concentrations of P, N, Ca, K, Mg, S, Fe, Mn, and B. A, PC1 versus PC2. B, PC2 versus PC3. C, Correlation coefficients (r2) obtained for correlations between the variation within individual root traits and the variation within each principal component.
Figure 11.
Figure 11.
The plasticity of the RSA to nutrient deficiencies. A PCA was undertaken on independent root traits, and the mean component scores for each of the treatments in all six principal components are represented. A, The eigenvalues for each principal component are indicated within each portion of the pie, as is the maximum observable component score for each principal component (represented by the dashed line). The pie chart is divided such that the radial magnitude of each portion is proportional to the experimental variation explained in that principal component (i.e. the eigenvalue). The mean component score for each treatment is graphed along the axis of the chart, with positive scores shaded yellow, negative scores shaded blue, and the zero point representing the mean component score of the 1/2 MS control treatments from all experiments. B to J, Plasticity charts are shown for Ca (B), P (C), K (D), Fe (E), Mn (F), Mg (G), N (H), B (I), and S (J). The area enclosed by each treatment represents the total RSA change relative to the mean of the controls and is expressed as a value adjacent to the legend in each panel in arbitrary units (a.u.2).

References

    1. Alhendawi RA, Kirkby EA, Pilbeam DJ. (2005) Evidence that sulfur deficiency enhances molybdenum transport in xylem sap of tomato plants. J Plant Nutr 28: 1347–1353
    1. Assunção AGL, Herrero E, Lin YF, Huettel B, Talukdar S, Smaczniak C, Immink RGH, van Eldik M, Fiers M, Schat H, et al. (2010) Arabidopsis thaliana transcription factors bZIP19 and bZIP23 regulate the adaptation to zinc deficiency. Proc Natl Acad Sci USA 107: 10296–10301 - PMC - PubMed
    1. Bell PF, Chaney RL, Angle JS. (1991) Determination of the copper2+ activity required by maize using chelator-buffered nutrient solutions. Soil Sci Soc Am J 55: 1366–1374
    1. Bergmann W 1992. Nutritional Disorders in Plants: Development, Visual and Analytical Diagnosis. Gustav Fisher, Jena, Germany
    1. Brown PH, Bellaloui N, Wimmer MA, Bassil ES, Ruiz J, Hu H, Pfeffer H, Dannel F, Romheld V. (2002) Boron in plant biology. Plant Biol 4: 205–223

Publication types