. 2013 Jul 30;110(31):12526-34.
doi: 10.1073/pnas.1302455110. Epub 2013 Jul 12.

Feature Article: mTOR complex 2-Akt signaling at mitochondria-associated endoplasmic reticulum membranes (MAM) regulates mitochondrial physiology

Affiliations

Feature Article: mTOR complex 2-Akt signaling at mitochondria-associated endoplasmic reticulum membranes (MAM) regulates mitochondrial physiology

Charles Betz et al. Proc Natl Acad Sci U S A. .

Abstract

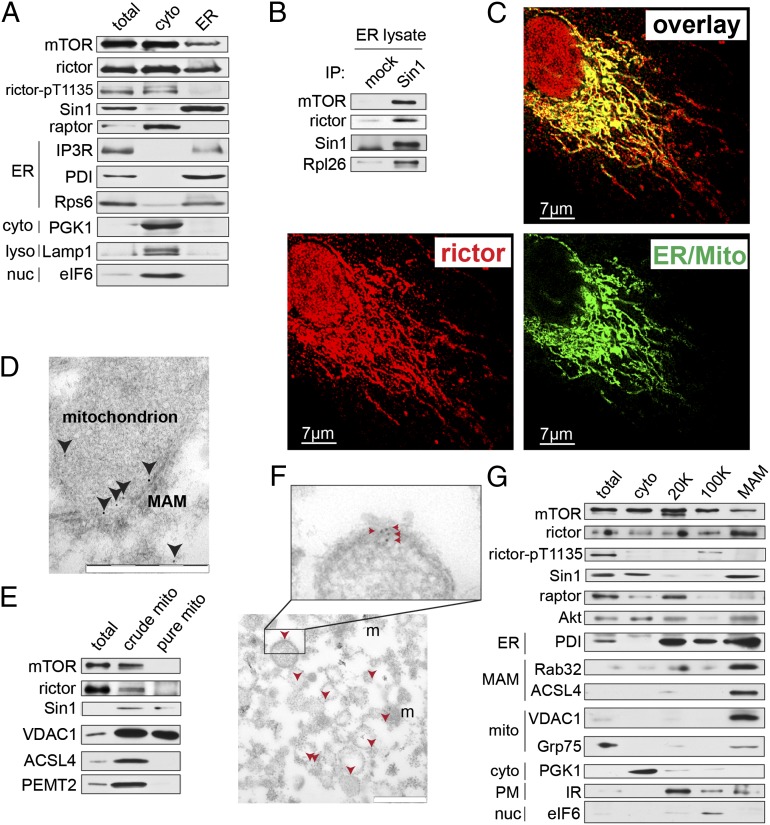
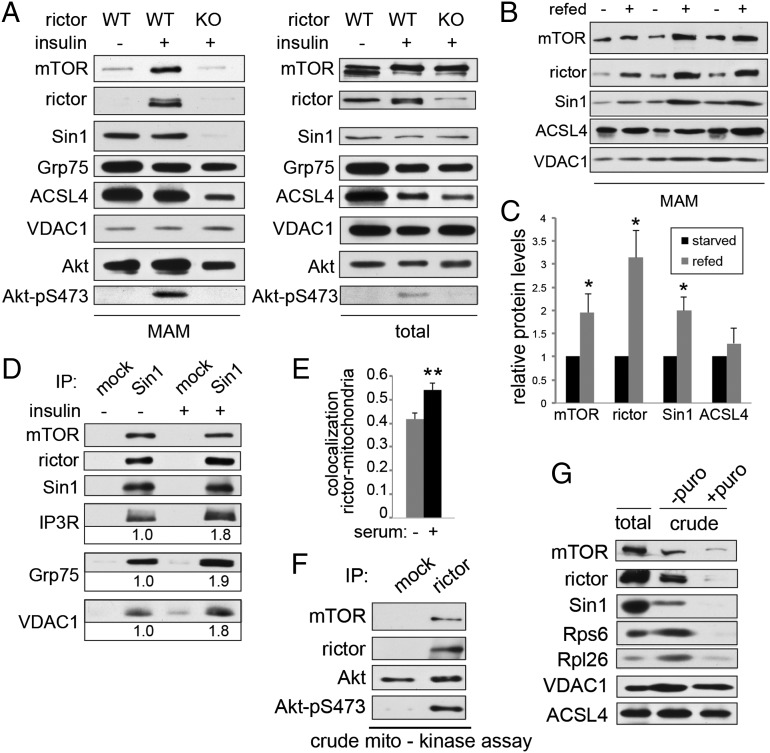
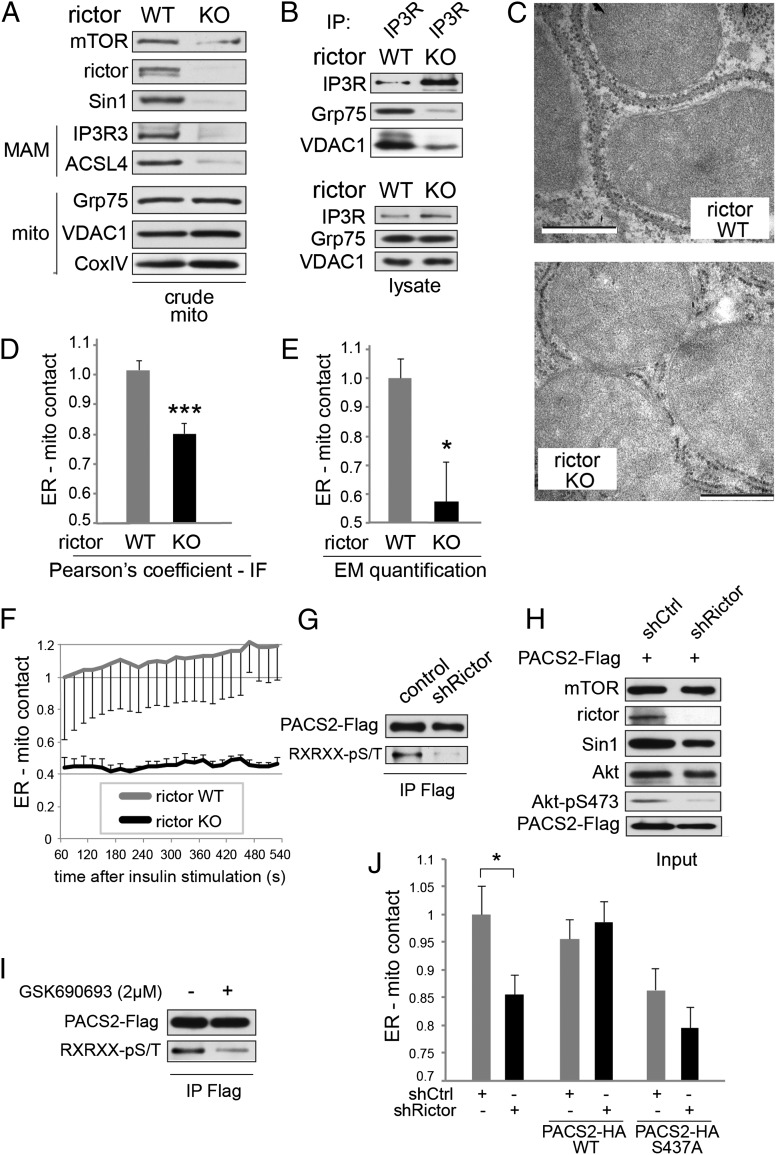
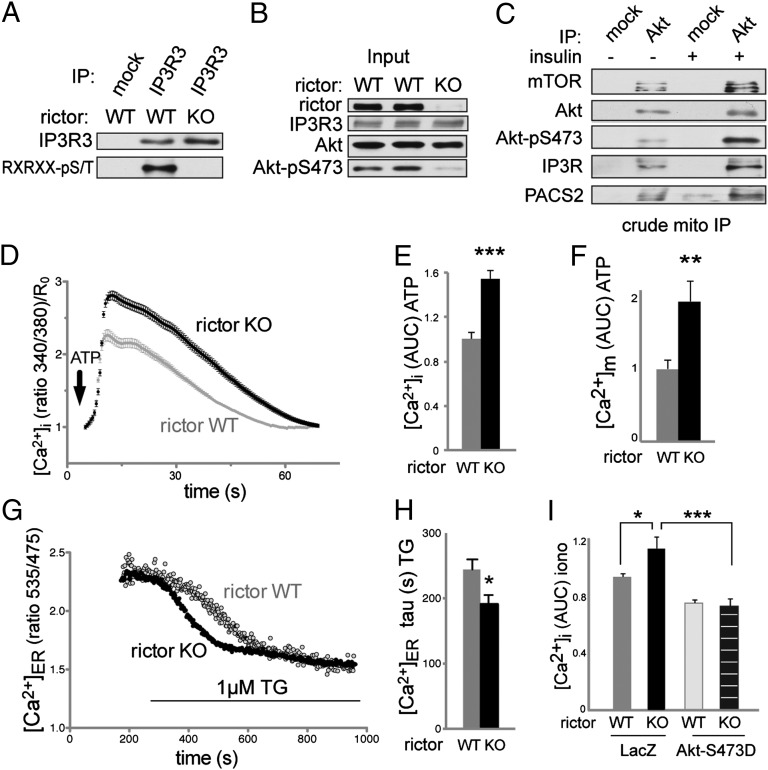
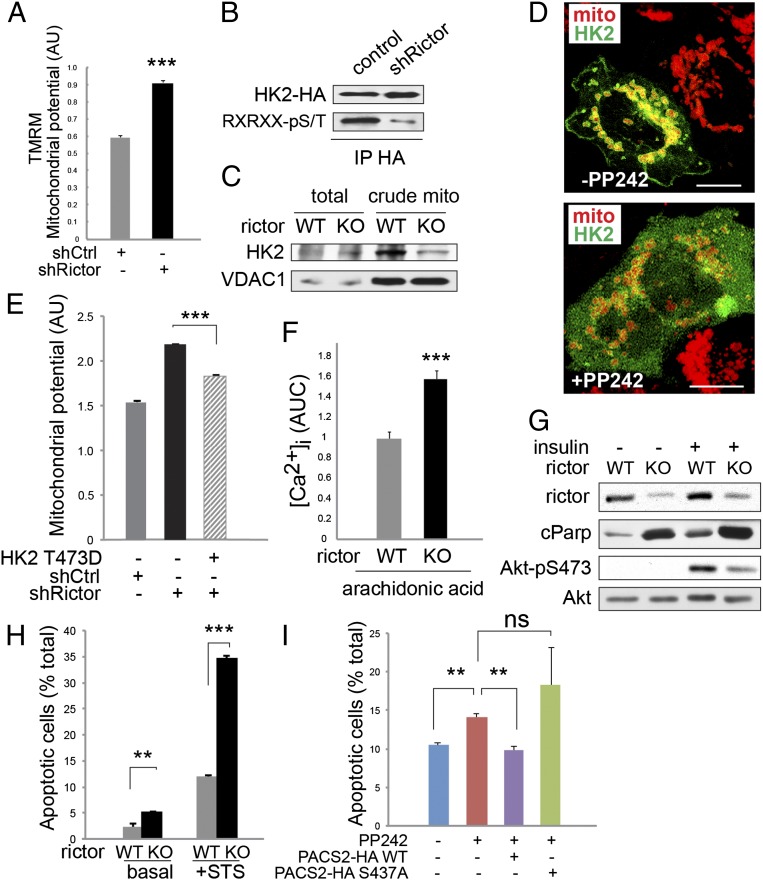
The target of rapamycin (TOR) is a highly conserved protein kinase and a central controller of growth. Mammalian TOR complex 2 (mTORC2) regulates AGC kinase family members and is implicated in various disorders, including cancer and diabetes. Here we report that mTORC2 is localized to the endoplasmic reticulum (ER) subcompartment termed mitochondria-associated ER membrane (MAM). mTORC2 localization to MAM was growth factor-stimulated, and mTORC2 at MAM interacted with the IP3 receptor (IP3R)-Grp75-voltage-dependent anion-selective channel 1 ER-mitochondrial tethering complex. mTORC2 deficiency disrupted MAM, causing mitochondrial defects including increases in mitochondrial membrane potential, ATP production, and calcium uptake. mTORC2 controlled MAM integrity and mitochondrial function via Akt mediated phosphorylation of the MAM associated proteins IP3R, Hexokinase 2, and phosphofurin acidic cluster sorting protein 2. Thus, mTORC2 is at the core of a MAM signaling hub that controls growth and metabolism.


Conflict of interest statement

The authors declare no conflict of interest.

Figures

Fig. 1.
Fig. 1.
mTORC2 is localized to MAMs. (A) mTORC2 components are present in the ER fraction of mouse livers. Total, whole cell lysate; cyto, cytoplasmic extract; ER, heavy membrane fraction from isopycnic flotation. Lysates were pooled from three different mouse livers. Mice were fed a standard chow diet and killed in the morning. Equal total protein levels were loaded in each lane. (B) mTORC2 in mouse liver ER extracts is intact and ribosome-associated. ER fraction was prepared as in A, suspended in CHAPS IP buffer and mTORC2 components were coimmunoprecipitated with Sin1. (C) ER/mito staining, reflecting colocalized ER (ER-GFP) and mitochondria (Mito-RFP), overlaps with endogenous rictor signal in U2OS cells. For individual channels, see Fig. S1A. (Scale bar, 7 µm.) Shown is maximum-intensity projection of 3D-deconvoluted, confocal image stack. Cells were grown on coverslips in normal medium before PFA fixation. (D) Representative image showing rictor (arrowheads) localization at the rough ER (electron-dense tubular structure) adjacent to a mitochondrion in a mouse liver section as detected by immuno-EM. (Scale bar, 500 nm.) (E) mTOR and rictor can be detected in crude mitochondrial extracts from mouse liver cells but not in purified mitochondrial extracts. Lysates were pooled from three different mouse livers. Mice were fed a standard chow diet and killed in the morning. Equal total protein levels were loaded in each lane. (F) Rictor (red arrowheads) is present in a purified MAM fraction as measured by immuno-EM. Rictor signal is localized to the surface of reconstituted microsomes consisting of pure MAM membranes (56); m, mitochondrion, copurified with MAM. (Scale bar, 500 nM.) (G) Purified MAM fraction from mouse liver extracts contains mTORC2 components but not mTORC1 component raptor. MAM markers include Rab32 and ACSL4, cytosolic marker is PGK1 mitochondrial markers are VDAC1 and Grp75, ER marker is PDI, plasma membrane marker is the insulin receptor (IR), and nuclear marker is eIF6. Lysates are pooled from three different mouse livers. 20 K and 100 K indicate fractions as described in ref. . Mice were fed a standard chow diet and killed in the morning. Equal total protein levels were loaded in each lane.
Fig. 2.
Fig. 2.
mTORC2 localization to MAM is stimulated by growth factors. (A) mTORC2 localization to MAM is increased in insulin-stimulated control MEFs but not in MEFs in which rictor KO had been induced by addition of tamoxifen before the experiment. MEFs were starved for 6 h before the experiment and stimulated for 30 min using 100 nM insulin. MAM was isolated as before. Five confluent 15-cm plates were used as starting material for each condition. (B) mTORC2 localization to MAM is increased in livers of refed control mice, indicating that increased mTORC2 localization to MAM is also observed under physiological stimulation by food intake. Mice were starved for 14 h and refed standard diet for 2 h. Two mice were used for each fractionation. (C) Densitometric quantification of B. Protein levels were normalized to VDAC1 signal. Note that ACSL4 levels are unchanged between starved and refed status as a result of loading of equal amount of MAM. (D) mTORC2 interaction with IP3R-Grp75-VDAC1 is increased after insulin stimulation in total liver extracts from insulin-stimulated control mice. Proteins were quantified relative to starved state. Mice were starved for 14 h and injected intraperitoneally with 4.5 mg/kg insulin or saline 30 min before being killed. Liver tissue was homogenized in CHAPS IP buffer. (E) Rictor colocalization (Pearson’s coefficient) with mitochondria is increased in presence of serum in U2OS cells. Quantification of Fig. S2F (n = 12). (F) mTORC2, immunoprecipitated from a crude mitochondrial fraction purified from mouse liver lysates as previously, is active toward recombinant, kinase-dead Akt in an mTORC2 kinase assay. Lysates from two mice were combined for subcellular fractionation. Mice were starved for 14 h before being killed and injected intraperitoneally with 4.5 mg/kg insulin 15 min before being killed. (G) Stripping off ribosomes from crude mitochondrial extracts leads to a decrease of copurifying mTORC2 components, indicating that localization of mTORC2 to MAM depends on the presence of ribosomes. Crude mitochondrial extracts (including MAM) from HeLa cells were treated with 1 mM puromycin for 1 h and repurified. Note the decrease in the amount of ribosomes and mTORC2 but not in the mitochondrial marker VDAC1 or the MAM marker ACSL4. HeLa cells were growing in normal medium before the extraction. Results are shown as mean ± SEM and normalized to control cells. *P < 0.05, **P < 0.01.
Fig. 3.
Fig. 3.
mTORC2 mediates MAM integrity. (A) Inducible rictor KO MEFs show reduced amount of MAM markers IP3R3 and ACSL4 in crude mitochondrial extracts, indicating a reduction in MAM integrity. Rictor KO in MEFs was induced by a 4-d tamoxifen treatment of Rictor fl/fl CreERT2 MEFs (72) in this panel and in subsequent experiments. Cells were grown in normal medium before harvest. Equal total proteins were loaded in each lane, thus allowing us to judge the dynamic amount of MAM relative to the static amount of mitochondria in the crude mitochondrial fraction. Corresponding total protein lysates are shown in Fig. S3A. (B) Immunoprecipitation of IP3R from total liver extracts of rictor KO mice show reduced interaction of IP3R with VDAC1 and Grp75, indicating MAM disruption. Mice were fed a standard chow diet and killed in the morning. Input is shown in the lower panel. Immunoprecipitation was performed in CHAPS IP buffer as before. (C) High-magnification electron micrographs of liver mitochondria and surrounding MAM from liver-specific rictor KO mice and control littermates. (Scale bar, 500 nm.) Mice were fed a standard chow diet and killed in the morning. (D) Pearson's correlation coefficient quantifying 3D ER-mitochondrial contact of deconvoluted confocal image stacks of rictor KO relative to control (WT) MEFs. Cells expressed GFP-ER and mRFP-mito (BACMAM 2; Invitrogen). Quantification of Fig. S3C. n = 9. Cells were grown on coverslips in normal medium before PFA fixation. (E) Quantification of ER-mitochondrial contact of EM pictures from livers of liver-specific rictor KO mice and control littermates, n = 6. Mice were fed a standard chow diet and killed in the morning. (F) Life cell quantification of ER-mitochondrial contact of MEFs after stimulation with insulin, quantified by confocal microscopy as done previously (n = 8). Cells were grown on chambered coverglass (Lab-Tek) in normal medium, serum-starved for 6 h, and insulin-stimulated (100 nM) at t = 0. (G) Rictor knockdown HeLa cells show reduced phosphorylation of PACS2 at Akt target site. PACS2-Flag was immunoprecipitated and probed with a Flag-tag or an Akt substrate motif antibody. For input, see H. Thirty-four hours after PACS2 transfection, cells were serum-starved for 14 h, stimulated with insulin (100 nM) for 15 min, and lysed in RIPA buffer. (H) Input of G. (I) GSK690693 (an Akt ATP-competitive kinase inhibitor) treatment of HeLa cells inhibits phosphorylation of PACS2 at Akt target site. PACS2-Flag was immunoprecipitated and probed with a Flag-tag or an Akt substrate motif antibody. Thirty-four hours after PACS2 transfection, cells were serum-starved for 14 h, pretreated with the inhibitor or DMSO for 20 min, and stimulated with insulin (100 nM) for 15 min in the presence or absence of inhibitor. Cells were lysed in RIPA buffer. For input, see Fig. S3J. (J) ER-mitochondrial contact of rictor knockown or control HeLa cells transfected either with mock, PACS2-WT, or PACS2-S473A, quantified by immunofluoresence as done previously (n = 10–16). Cells were grown on coverslips in normal medium before fixation by PFA. Results are shown as mean ± SEM and normalized to control cells. *P < 0.05, ***P < 0.001.
Fig. 4.
Fig. 4.
Calcium flux is defective in mTORC2 deficient cells. All calcium measurements were performed in the absence of extracellular calcium. (A) Phosphorylation of endogenous IP3R3 is reduced in rictor KO MEFs. For input, see B. Cells were serum-starved for 14 h and stimulated with 100 nM insulin for 30 min before harvest in CHAPS IP buffer. (B) Input of A. (C) Immunoprecipitation of Akt from a crude mitochondrial fraction of mouse liver extracts. Mice were starved for 14 h and injected intraperitoneally with 4.5 mg/kg insulin or saline 15 min before being killed. Lysates from three mice were pooled for subcellular fractionation. IP was performed in CHAPS IP buffer. Note the increased interaction at MAM of Akt with its kinase mTORC2 and with its substrates IP3R and PACS2, suggesting that mTORC2 controls PACS2 and IP3R at MAM via Akt. Input in Fig. S5B. (D) Intracellular calcium release in MEFs after stimulation with 200 µM ATP, quantified by the emission ratio 340/380 nm after labeling with Fura2-AM. Data are normalized to the time point 0. n = 104. Cells were grown and labeled in normal medium before switching to calcium-free HBSS for the measurements. (E) Area under the curve (AUC) of D. (F) AUC of mitochondrial calcium uptake after stimulation with ATP. The cells were transiently transfected with the mitochondria-targeted Cameleon probe 4mtD3cpv and growing in normal medium before measurements. n = 20. (G) Original recording showing the ER Ca2+ depletion following TG treatment. For quantification, see H. (H) Statistical evaluation of the kinetic of ER calcium store depletion after addition of 1 µM TG, reflecting an increased ER Ca2+ leak in rictor KO MEFs. n = 26. The cells were transiently transfected with the ER-targeted Cameleon probe D1ER. (I) AUC of intracellular calcium release after stimulation with 10 µM ionomycin in rictor KO and control MEFs, expressing LacZ or Akt S473D. Cells were labeled with Fura2-AM. Note that rictor KO MEFs have increased calcium stores. Cells were grown in normal medium before measurements. Results are shown as mean ± SEM and normalized to control cells. *P < 0.05, **P < 0.01, ***P < 0.001.
Fig. 5.
Fig. 5.
mTORC2 at MAM controls mitochondrial function. (A) Mitochondrial potential of HeLa cells after rictor knockdown (shRictor), measured by TMRM intensity by FACS. Arbitrary units, n = 3. Cells were grown in normal medium before measurements. (B) Phosphorylation of HK2 by Akt is reduced in rictor knockdown cells. HK2-HA was immunoprecipitated and probed with a HA-tag or an Akt substrate motif antibody. Thirty-four hours after HK2 transfection, cells were serum-starved for 14 h, stimulated with insulin (100 nM) for 15 min, and lysed in RIPA buffer. (C) Crude mitochondrial HK2 levels are reduced in rictor KO MEFs. Cells were grown in normal medium before harvest. (D) Representative immunofluoresence picture of HeLa cells expressing mRFP-mito and GFP-HK2, showing cytoplasmic HK2 in presence of 500 nM mTOR inhibitor PP242. (Scale bar, 10 µm.) Cells were grown on slides and starved for 14 h, pretreated with 500 nM PP242 or DMSO for 20 min and stimulated with 100 nM insulin for 15 min before fixation by PFA. (E) Mitochondrial potential (arbitrary units) as measured by TMRM of HeLa cells transfected with a plasmid overexpressing HK2 T473D, a phosphomimetic mutant of the Akt substrate site (n = 3). Cells were grown in normal medium. HK2 was transfected 48 h before measurement. (F) AUC of intracellular calcium release of MEFs after apoptotic stimulation with 80 µM arachidonic acid (n = 67–70). Cells were grown in normal medium. (G) Total protein lysates from MEFs after insulin stimulation, showing increased levels of cleaved Parp (cParp) in rictor KO MEFs. Cells were serum starved for 6 h and insulin-stimulated for 15 min before collection. (H) Apoptotic MEFs as determined by positive Annexin V staining, analyzed by FACS (n = 3). Cells were grown in normal medium and treated with staurosporine (0.5 µM, 30 min) where indicated. (I) Apoptotic HeLa (Annexin V+) treated with 500 nm PP242 for 6 h (n = 3). Cells were transfected with plasmids expressing PACS2-WT or PACS2-S437A 48 h before experiment and grown in normal medium. Results are shown as mean ± SEM and normalized to control cells. **P < 0.01, ***P < 0.001; ns, not significant.

References

    1. Csordás G, Thomas A, Hajnóczky G. Quasi-synaptic calcium signal transmission between endoplasmic reticulum and mitochondria. EMBO J. 1999;18(1):96–108. - PMC - PubMed
    1. Rizzuto R, et al. Close contacts with the endoplasmic reticulum as determinants of mitochondrial Ca2+ responses. Science. 1998;280(5370):1763–1766. - PubMed
    1. Stone SJ, et al. The endoplasmic reticulum enzyme DGAT2 is found in mitochondria-associated membranes and has a mitochondrial targeting signal that promotes its association with mitochondria. J Biol Chem. 2009;284(8):5352–5361. - PMC - PubMed
    1. Ardail D, et al. The mitochondria-associated endoplasmic-reticulum subcompartment (MAM fraction) of rat liver contains highly active sphingolipid-specific glycosyltransferases. Biochem J. 2003;371(Pt 3):1013–1019. - PMC - PubMed
    1. Bionda C, Portoukalian J, Schmitt D, Rodriguez-Lafrasse C, Ardail D. Subcellular compartmentalization of ceramide metabolism: MAM (mitochondria-associated membrane) and/or mitochondria? Biochem J. 2004;382(Pt 2):527–533. - PMC - PubMed

Publication types

MeSH terms

Substances