Comparative Study
. 2013;9(7):e1003419.
doi: 10.1371/journal.ppat.1003419. Epub 2013 Jul 4.

DNA methylation impacts gene expression and ensures hypoxic survival of Mycobacterium tuberculosis

Affiliations
Comparative Study

DNA methylation impacts gene expression and ensures hypoxic survival of Mycobacterium tuberculosis

Scarlet S Shell et al. PLoS Pathog. 2013.

Abstract

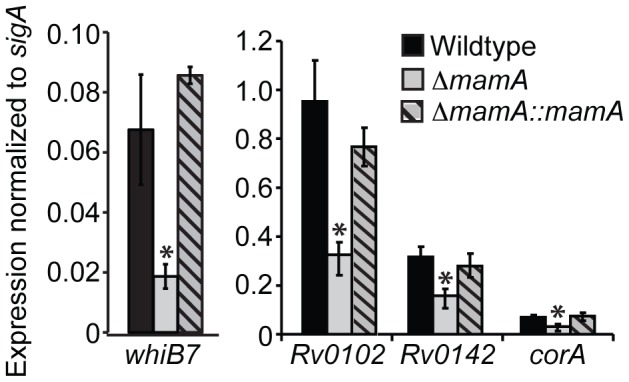
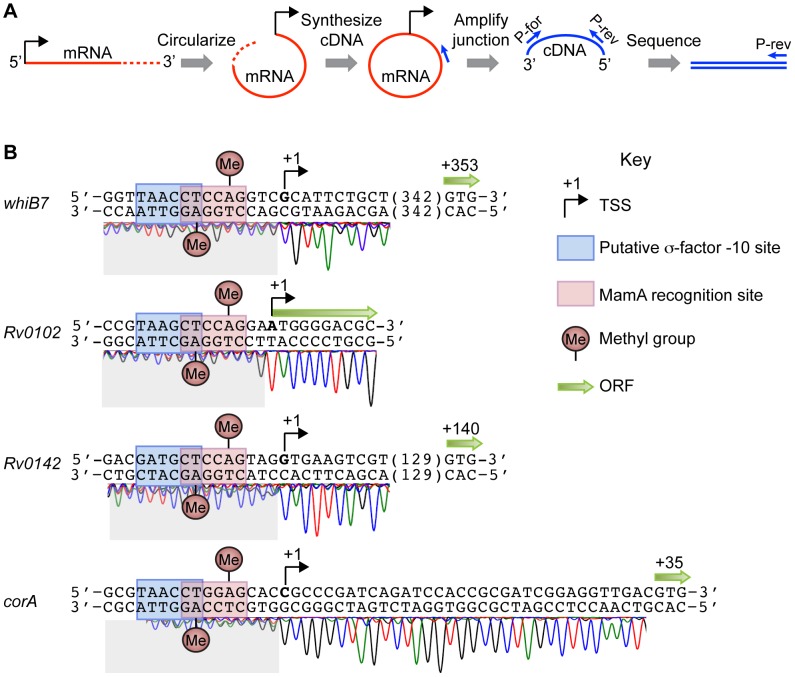
DNA methylation regulates gene expression in many organisms. In eukaryotes, DNA methylation is associated with gene repression, while it exerts both activating and repressive effects in the Proteobacteria through largely locus-specific mechanisms. Here, we identify a critical DNA methyltransferase in M. tuberculosis, which we term MamA. MamA creates N⁶-methyladenine in a six base pair recognition sequence present in approximately 2,000 copies on each strand of the genome. Loss of MamA reduces the expression of a number of genes. Each has a MamA site located at a conserved position relative to the sigma factor -10 binding site and transcriptional start site, suggesting that MamA modulates their expression through a shared, not locus-specific, mechanism. While strains lacking MamA grow normally in vitro, they are attenuated in hypoxic conditions, suggesting that methylation promotes survival in discrete host microenvironments. Interestingly, we demonstrate strikingly different patterns of DNA methyltransferase activity in different lineages of M. tuberculosis, which have been associated with preferences for distinct host environments and different disease courses in humans. Thus, MamA is the major functional adenine methyltransferase in M. tuberculosis strains of the Euro-American lineage while strains of the Beijing lineage harbor a point mutation that largely inactivates MamA but possess a second functional DNA methyltransferase. Our results indicate that MamA influences gene expression in M. tuberculosis and plays an important but strain-specific role in fitness during hypoxia.


Conflict of interest statement

The authors have declared that no competing interests exist.

Figures

Figure 1
Figure 1. MamA is a DNA methyltransferase that protects lppC from endonucleolytic cleavage.
(A) Southern blotting strategy to assess the status of a PvuII site near the 3′ end of lppC. Genomic DNA was digested with PvuII and analyzed by Southern blot with a probe hybridizing as shown. Fully cleaved DNA generates a 1.8 kb product, while protected DNA produces a 2.1 kb product. (B) DNA from the vaccine strain M. bovis BCG and from M. tuberculosis strains of the Euro-American lineage (Erdmann and CDC1551) is partially protected from PvuII cleavage while DNA from a Beijing lineage strain (HN878) is not. (C) Genetic deletion of mamA abrogates protection of lppC, while deletion of hsdM does not affect protection. (D) Protection is restored by complementation of a ΔmamA strain with an ectopic copy of mamA, but not by empty vector or mamAE270A. (E) Sequence context of the assayed PvuII site. Underlined bases are predicted to block PvuII if methylated.
Figure 2
Figure 2. Sequence trace comparison identifies the target base and minimal recognition sequence of MamA.
Plasmids containing putative MamA-recognition motifs were propagated in the indicated bacterial strains, isolated and sequenced. Sequence traces shown are representative of at least 2–3 biological replicates. (A) The 10 base pair sequence shown in Figure 1E supports methylation of one adenine on each strand in wildtype H37Rv, as evidenced by increased thymine peak areas relative to the identical sequence context in E. coli and methylation-deficient strains of M. tuberculosis. See Figure S2 for quantification of peak areas. (B) Schematic depiction of the positions of N6-methyladenine residues. (C) A six base pair core sequence is sufficient to direct MamA-mediated methylation (bold in panel B). See Table S1 for a complete list of tested sequences. (D) Positions of MamA recognition sequences are shown schematically on the 4.4 Mb M. tuberculosis genome.
Figure 3
Figure 3. Quantitation of total N6-MdA content in M. tuberculosis.
Genomic DNA from the indicated strains was digested to individual nucleosides and methylation content determined by liquid chromatography-coupled tandem mass spectrometry. Results are expressed as the amount of N6-MdA per nucleotide (left axis) and percentage of adenines that are methylated in each genome (right axis). Each represents at least three biological replicates. Outliers were removed using Grubbs criteria and error bars represent ± standard deviation. (A) Analysis of the contribution of wildtype and mutant forms of MamA to total adenine methylation levels in strain H37Rv. (B) Analysis of the contributions of MamA and HsdM to total adenine methylation levels in Euro-American (H37Rv) and Beijing (HN878) strain backgrounds.
Figure 4
Figure 4. Several genes have lower expression levels in a ΔmamA strain.
Expression of each gene was determined by quantitative PCR in the indicated H37Rv-derived strains and is displayed as a relative value compared to expression of the housekeeping gene sigA in the same strain. Values shown are the mean of three technical replicates. Error bars denote standard deviation. (*) denotes P<0.05 compared to the wildtype and complemented strains (ANOVA with Tukey's post test). The wildtype and complemented strains were not significantly different from each other for any of the genes tested. The experiment was performed using RNA from different cultures than those used to prepare RNA for microarrays.
Figure 5
Figure 5. Transcriptional start site (TSS)-mapping reveals a consistent spatial relationship between MamA sites and TSSs of methylation-affected genes.
TSSs in strain H37Rv were mapped by the strategy outlined in (A). mRNA was circularized before random-primed synthesis of cDNA. Dashes indicate the variable 3′ end of an mRNA. Gene-specific primers were then used to amplify and sequence 5′-3′ junctions. Junctions appear as transitions from clean to messy sequence due to the variable 3′ ends. (B) TSS-mapping sequence traces are shown for the four genes whose expression is reproducibly affected by MamA. MamA sites, putative sigma factor −10 binding sites, TSSs and ORFs are shown as indicated in the key.
Figure 6
Figure 6. Deletion of mamA does not grossly affect growth rate or fitness of M. tuberculosis during mouse infection.
(A) The indicated H37Rv-derived strains were normalized at a calculated optical density of 0.01 in Sauton's media and monitored by optical density on the days indicated. Points indicate the mean of triplicate cultures and error bars denote standard deviation. Similar results were obtained in 7H9 medium and by plating for CFU. (B) Mice were infected by the aerosol route with approximately 10,000 CFU of a mixture of unmarked wildtype H37Rv and one of three isogenic mamA mutants marked with kanamycin resistance. Groups of four mice per condition were sacrificed at the indicated time points and the lung burden of total and marked bacilli was determined. The mean proportion of marked bacteria is indicated. Error bars denote standard deviation.
Figure 7
Figure 7. MamA affects viability in hypoxic conditions.
The indicated strains of H37Rv were normalized to a calculated density of 3×10⁶ CFU/ml and sealed in bottles containing equal volumes of culture and headspace. (A) Two bottles per strain were opened at the indicated timepoints and CFU/ml determined by plating. Error bars denote standard deviation. The negative slopes of the time points between day 14 and day 35 differ significantly between ΔmamA and the other two strains (P<0.05, linear regression of log10-transformed values according to the method in [96]). (B) After 28 days, samples of culture were treated with fluorescein diacetate and visualized by microscopy. Only live cells containing active intracellular esterases cleave fluorescein diacetate to produce fluorescent fluorescein. Scale bar = 10 µm. (C) Quantification of percent fluorescent bacteria in three-four fields at day 28. Error bars denote 95% confidence intervals. P<0.05 for all inter-strain comparisons (Fisher's exact test).

References

    1. World Health Organization (2011) Global Tuberculosis Control 2011. World Health Organization.
    1. Militello KT, Simon RD, Qureshi M, Maines R, VanHorne ML, et al. (2012) Conservation of Dcm-mediated cytosine DNA methylation in Escherichia coli. FEMS Microbiology Letters 328: 78–85 doi:10.1111/j.1574-6968.2011.02482.x - DOI - PMC - PubMed
    1. Kahramanoglou C, Prieto AI, Khedkar S, Haase B, Gupta A, et al. (2012) Genomics of DNA cytosine methylation in Escherichia coli reveals its role in stationary phase transcription. Nat Commun 3: 886 doi:10.1038/ncomms1878 - DOI - PubMed
    1. Suzuki MM, Bird A (2008) DNA methylation landscapes: provocative insights from epigenomics. Nature Reviews Genetics 9: 465–476 doi:10.1038/nrg2341 - DOI - PubMed
    1. Casadesus J, Low D (2006) Epigenetic Gene Regulation in the Bacterial World. Microbiology and Molecular Biology Reviews 70: 830–856 doi:10.1128/MMBR.00016-06 - DOI - PMC - PubMed

Publication types

MeSH terms