

Quantification of bone changes in a collagen-induced arthritis mouse model by reconstructed three dimensional micro-CT
- PMID: 23855709
- PMCID: PMC3723793
- DOI: 10.1186/1480-9222-15-8
Quantification of bone changes in a collagen-induced arthritis mouse model by reconstructed three dimensional micro-CT
Abstract
Background: Inflammatory arthritis is a chronic disease, resulting in synovitis and subchondral and bone area destruction, which can severely affect a patient's quality of life. The most common form of inflammatory arthritis is rheumatoid arthritis (RA) in which many of the disease mechanisms are not well understood. The collagen-induced arthritis (CIA) mouse model is similar to RA as it exhibits joint space narrowing and bone erosion as well as involves inflammatory factors and cellular players that have been implicated in RA pathogenesis. Quantitative data for disease progression in RA models is difficult to obtain as serum blood markers may not always reflect disease state and physical disease indexes are subjective. Thus, it is important to develop tools to objectively assess disease progression in CIA.
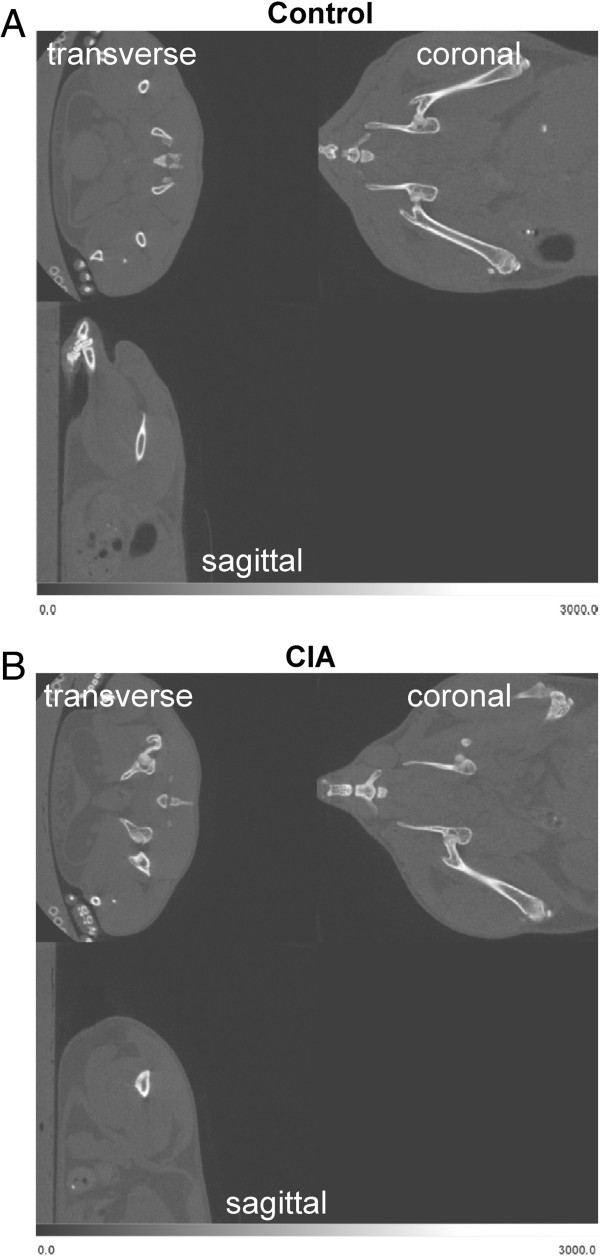
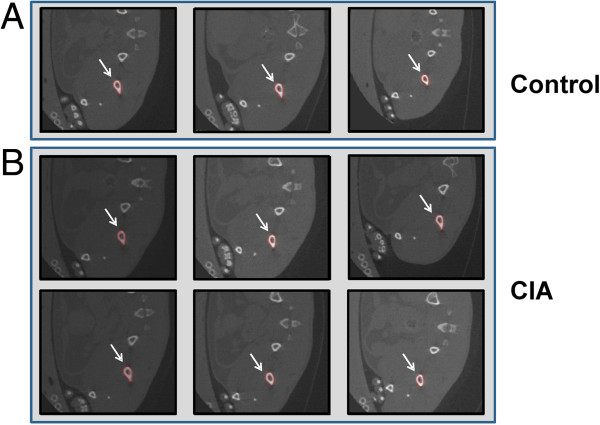
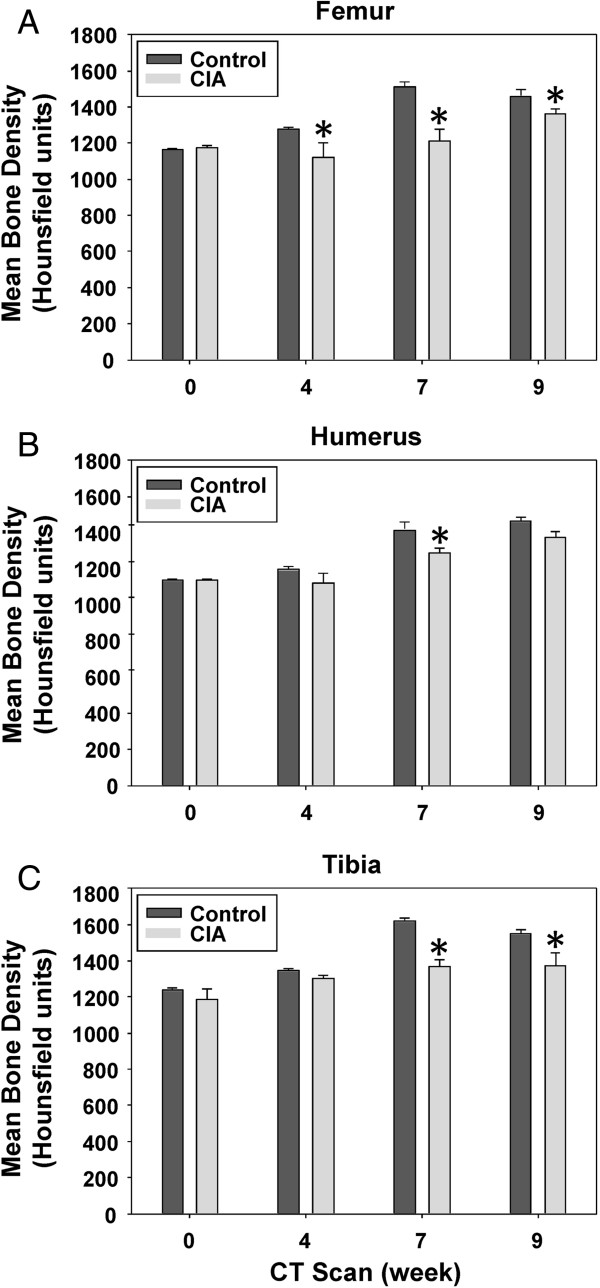
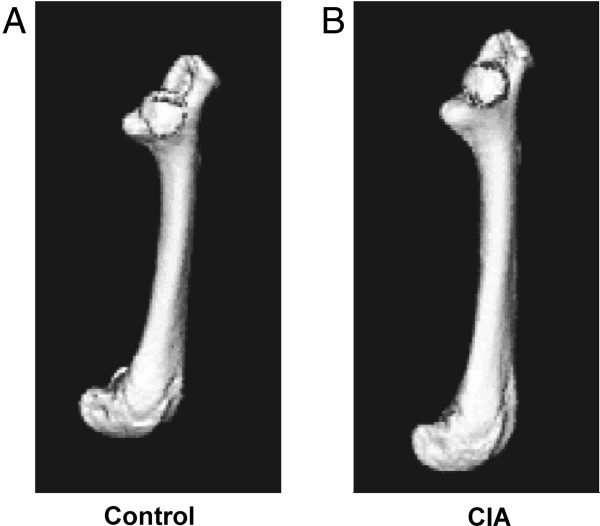
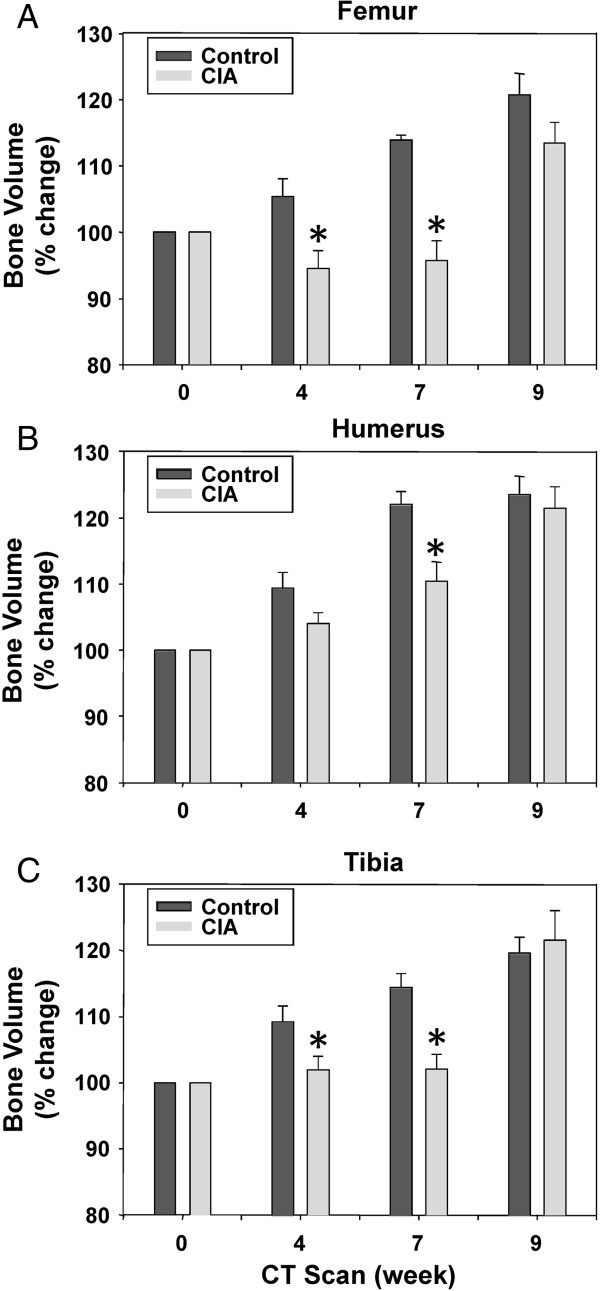
Results: Micro-CT (Computed Tomography) is a relatively mature technology that has been used to track a variety of anatomical changes in small animals. In this study, micro-CT scans of several joints of control and CIA mice were acquired at 0, 4, 7, and 9 weeks after the immunization with collagen type II. Each micro-CT scan was analyzed by applying a segmentation algorithm to individual slices in each image set to provide 3-dimensional representations of specific bones including the humerus, femur, and tibia. From these representations, the volume and mean density of these bones were measured and compared. This analysis showed that both the volume and the density of each measured bone of the CIA mice were significantly smaller than those of the controls at week 7.
Conclusions: This study demonstrates that micro-CT can be used to quantify bone changes in the CIA mouse model as an alternative to disease index assessments. In conclusion, micro-CT could be useful as a non-invasive method to monitor the efficacy of new treatments for RA tested in small animals.
Keywords: Bone density; Bone volume; Collagen induced arthritis; Computed tomography; Disease index; Imaging; Micro-CT; Rheumatoid arthritis.
Figures
References
-
- Moller Dohn U, Boonen A, Hetland ML, Hansen MS, Knudsen LS, Hansen A, Madsen OR, Hasselquist M, Moller JM, Ostergaard M. Erosive progression is minimal, but erosion healing rare, in patients with rheumatoid arthritis treated with adalimumab. A 1 year investigator-initiated follow-up study using high-resolution computed tomography as the primary outcome measure. Ann Rheum Dis. 2009;68:1585–1590. - PubMed
-
- Alamanos Y, Voulgari PV, Drosos AA. Incidence and prevalence of psoriatic arthritis: a systematic review. J Rheumatol. 2008;35:1354–1358. - PubMed
-
- Forney MC, Winalski CS, Schils JP. Magnetic resonance imaging of inflammatory arthropathies of peripheral joints. Top Magn Reson Imaging. 2011;22:45–59. - PubMed
-
- Goldring SR, Purdue PE, Crotti TN, Shen Z, Flannery MR, Binder NB, Ross FP, McHugh KP. Bone remodelling in inflammatory arthritis. Ann Rheum Dis. 2013;72:ii52–ii55. - PubMed
-
- Scott DL, Wolfe F, Huizinga TW. Rheumatoid arthritis. Lancet. 2010;376:1094–1108. - PubMed
LinkOut - more resources
Full Text Sources
Other Literature Sources
