. 2013 Nov;1828(11):2654-71.
doi: 10.1016/j.bbamem.2013.07.004. Epub 2013 Jul 13.

Topological and phylogenetic analyses of bacterial holin families and superfamilies

Affiliations

Topological and phylogenetic analyses of bacterial holin families and superfamilies

Bhaskara L Reddy et al. Biochim Biophys Acta. 2013 Nov.

Abstract

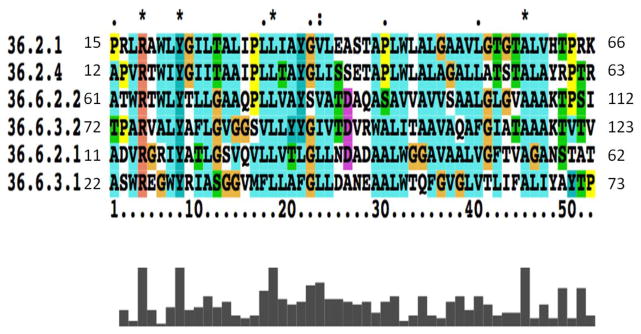
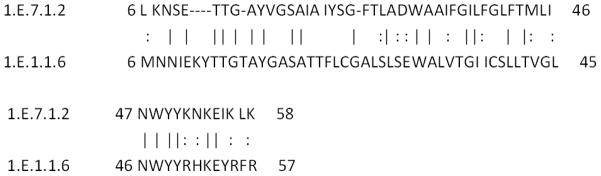
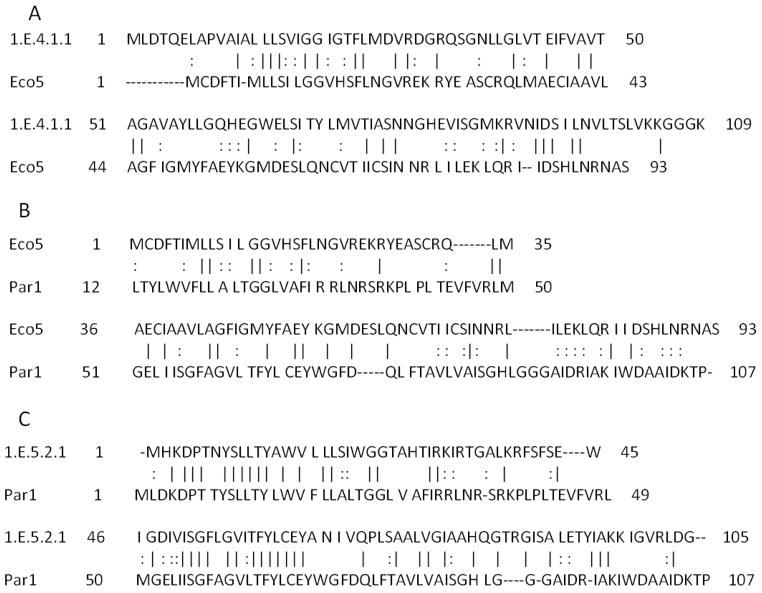
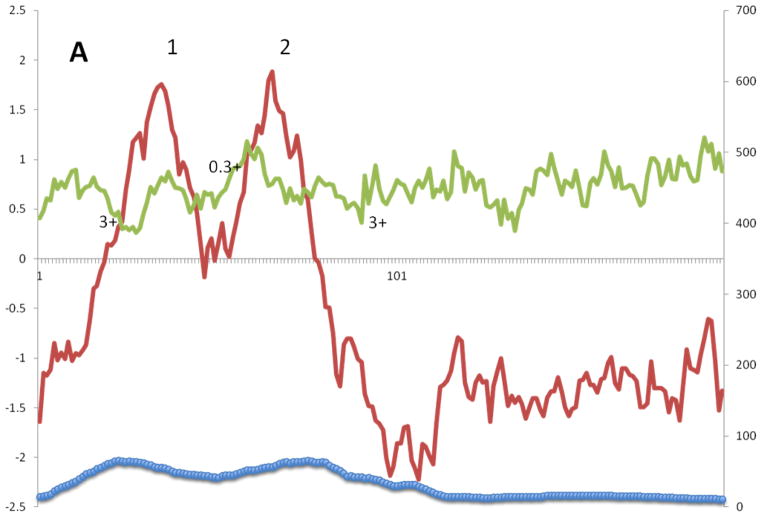
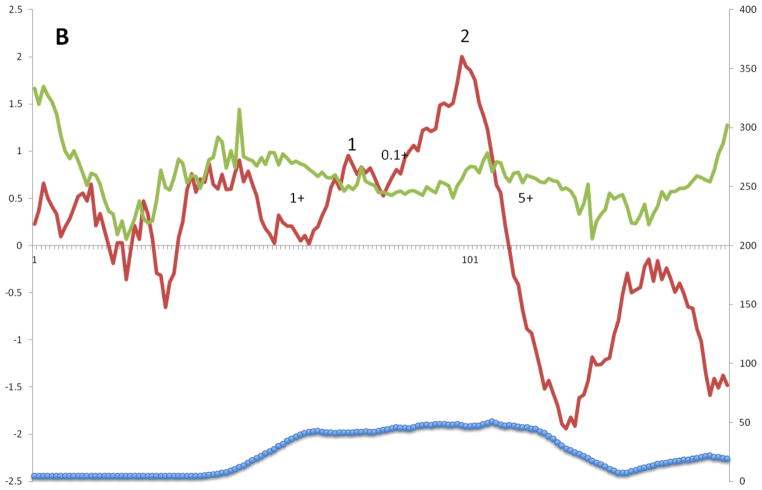
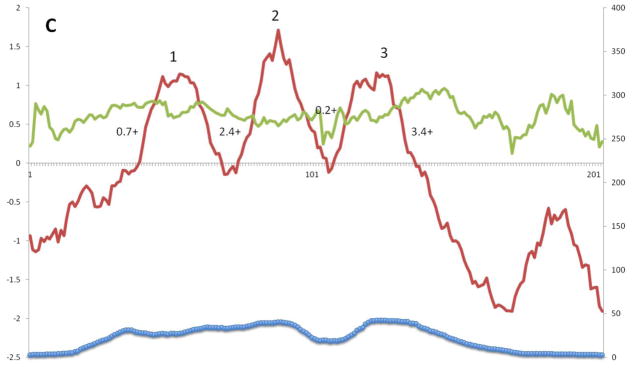
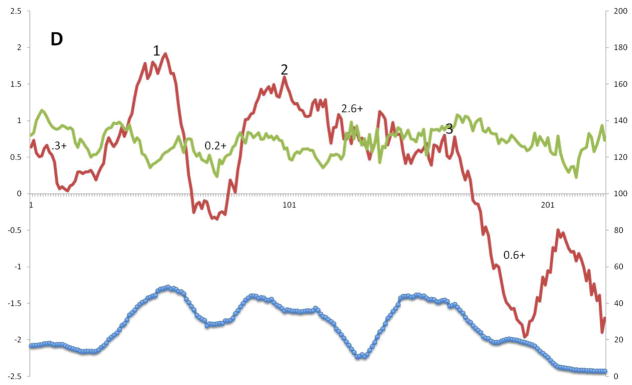
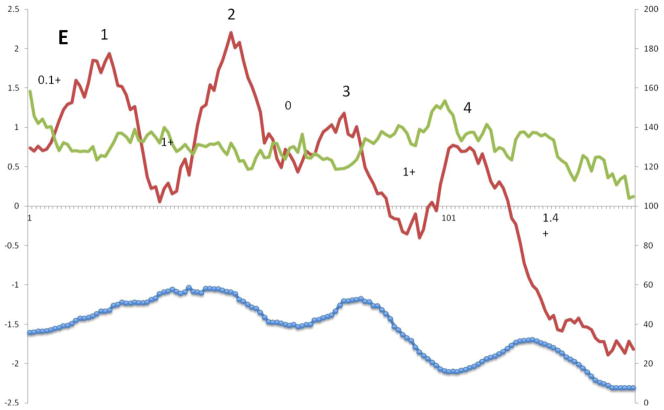
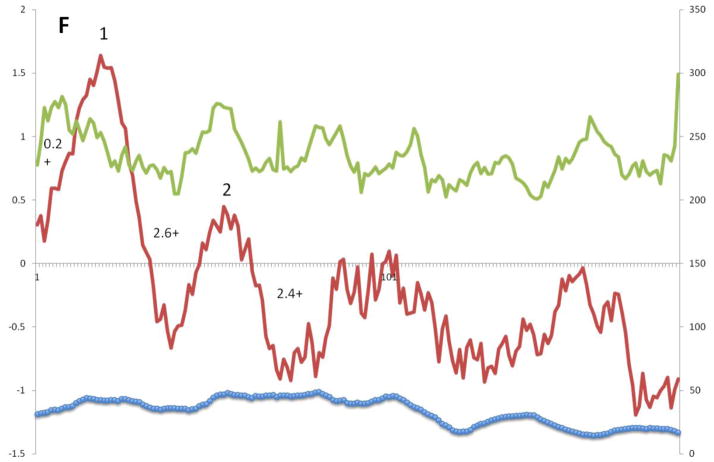
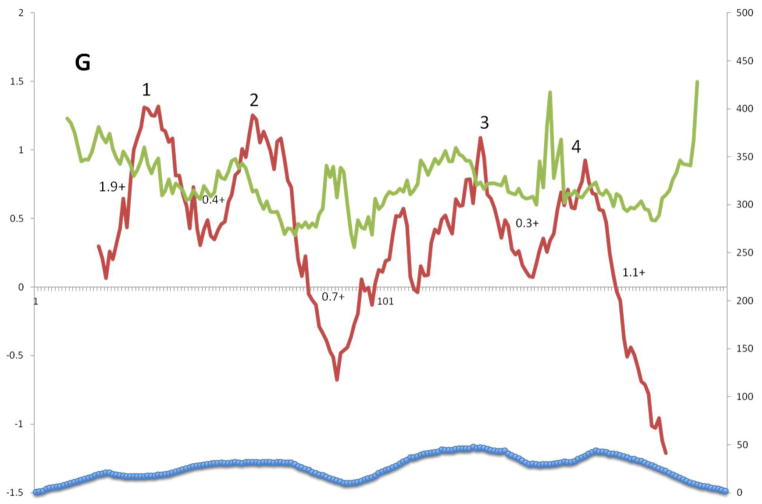
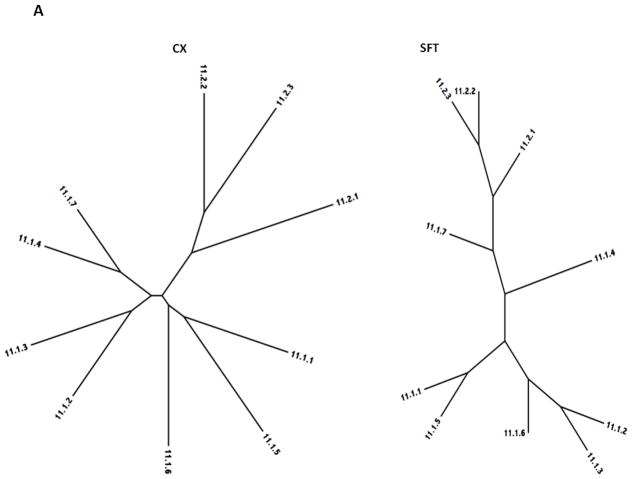
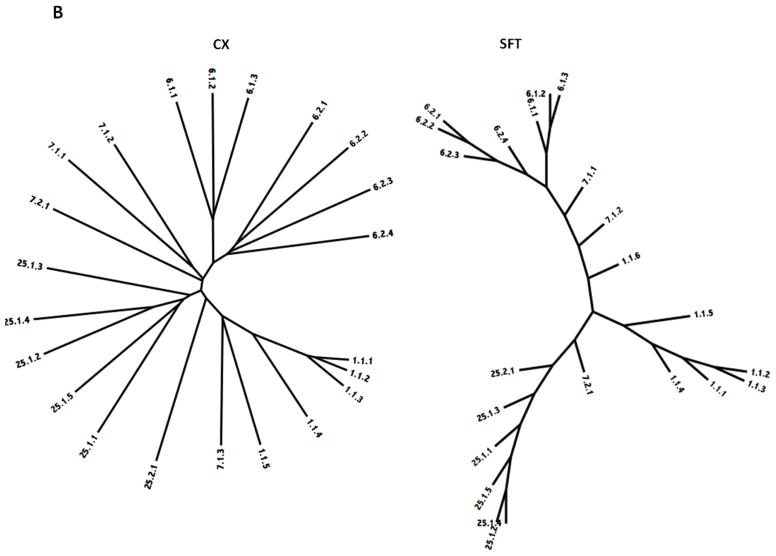
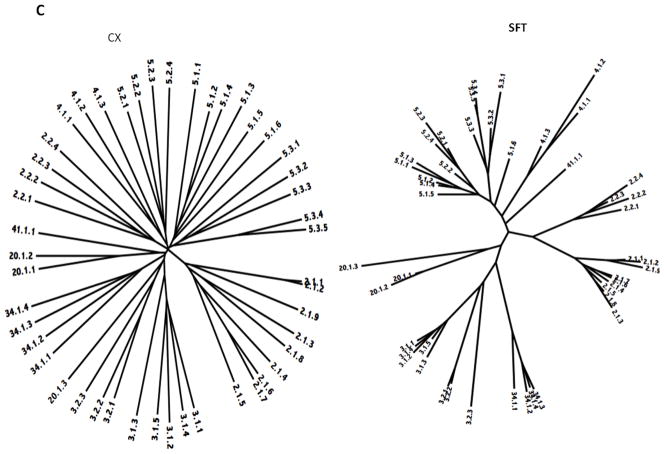
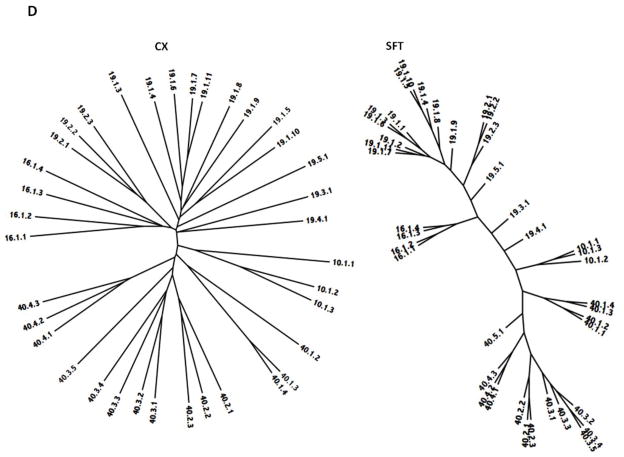
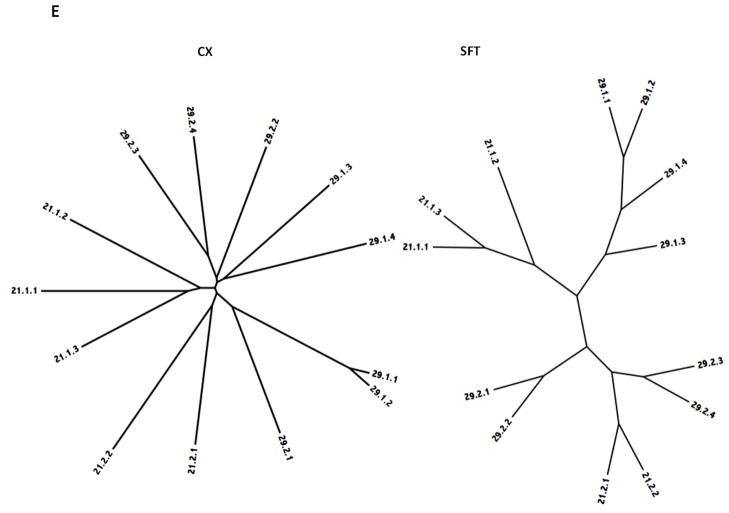
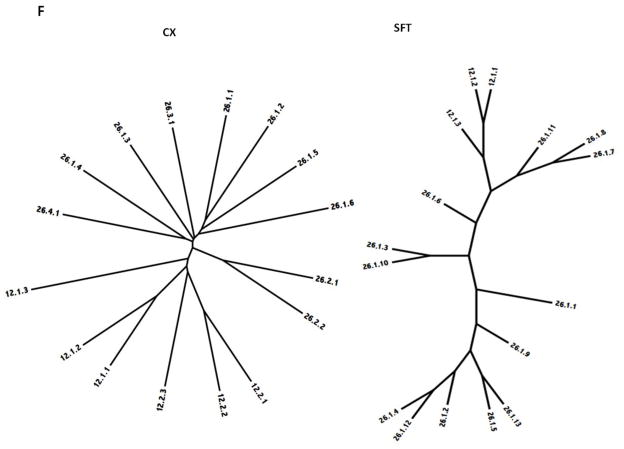
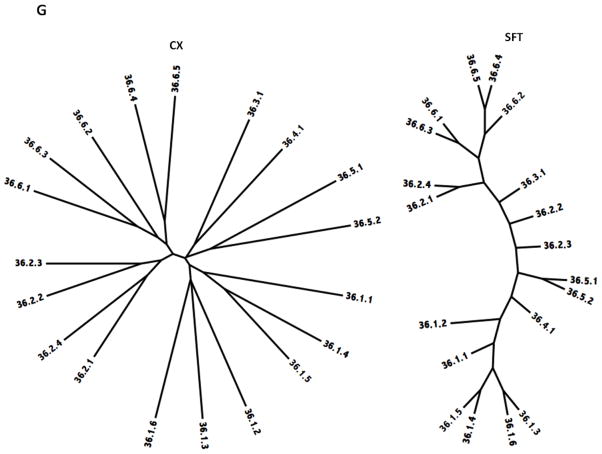
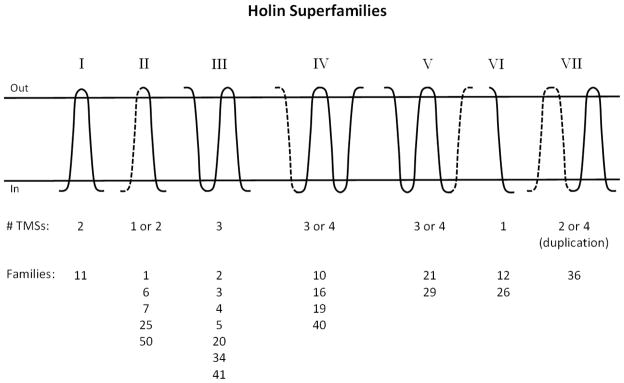
Holins are small "hole-forming" transmembrane proteins that mediate bacterial cell lysis during programmed cell death or following phage infection. We have identified fifty two families of established or putative holins and have included representative members of these proteins in the Transporter Classification Database (TCDB; www.tcdb.org). We have identified the organismal sources of members of these families, calculated their average protein sizes, estimated their topologies and determined their relative family sizes. Topological analyses suggest that these proteins can have 1, 2, 3 or 4 transmembrane α-helical segments (TMSs), and members of a single family are frequently, but not always, of a single topology. In one case, proteins of a family proved to have either 2 or 4 TMSs, and the latter arose by intragenic duplication of a primordial 2 TMS protein-encoding gene resembling the former. Using established statistical approaches, some of these families have been shown to be related by common descent. Seven superfamilies, including 21 of the 52 recognized families were identified. Conserved motif and Pfam analyses confirmed most superfamily assignments. These results serve to expand upon the scope of channel-forming bacterial holins.

Keywords: Autolysin; Holin; Phylogeny; Superfamily; Transmembrane pore; “Hole-forming”.


Figures

Figure 1
Figure 1
Alignment of the 2 TMS repeats in 4 TMS members of TC subfamily 1.E.36.6 with 2 TMS segments of 2 TMS members of TC subfamily 1.E.36.2. Residue numbers are indicated at the beginning and end of each line. The TC number without the subclass designation 1.E., is indicated followed by a one (first half) or a 2 (second half) for the two 4 TMS proteins.
Figure 2
Figure 2
Alignment of TC 1.E.7.1.2 (the HP1 Holin family) with 1.E.1.1.6 (the P21 Holin family). This alignment gave 15 SD using the GSAT program with default settings and 2000 random shuffles [33]. Numbers preceding and following each line refer to the residue numbers in each of the two proteins compared. Vertical lines = identities; colons = similarities
Figure 3
Figure 3
Alignments of the two sequences described in Table 3, 1.E.4.1.1 and 1.E.5.2.1, but compared with closer homologues. Comparison scores were: (A) 17 SD, (B) 13 SD and (C) 27 SD (Table 3). When the original two sequences were compared, a value of 2 SD was obtained (Table 3). This figure illustrates the use of the superfamily principle to establish homology between two distantly related proteins. The convention of presentation is as for Figure 2.
Figure 4
Figure 4
A – G: Average hydropathy (dark line, top), amphipathicity (light line, top) and similarity (thick line, bottom) plots (AveHAS program) for Holin superfamilies I – VII, respectively, included in TCDB as of February, 2013. Hydrophobic peaks believed to correspond to TMSs are numbered. Smaller numbers followed by a plus sign between the hydrophobic peaks, refer to the average number of strongly basic residues, Ks (Lysines) and Rs (Arginines) before, between or after the TMSs.
Figure 4
Figure 4
A – G: Average hydropathy (dark line, top), amphipathicity (light line, top) and similarity (thick line, bottom) plots (AveHAS program) for Holin superfamilies I – VII, respectively, included in TCDB as of February, 2013. Hydrophobic peaks believed to correspond to TMSs are numbered. Smaller numbers followed by a plus sign between the hydrophobic peaks, refer to the average number of strongly basic residues, Ks (Lysines) and Rs (Arginines) before, between or after the TMSs.
Figure 5
Figure 5
Phylogenetic trees of holin superfamilies derived using the ClustaX (CX) program (A) and the Superfamily Tree (SFT) program (B) for Superfamilies I – VII (A – G respectively).
Figure 5
Figure 5
Phylogenetic trees of holin superfamilies derived using the ClustaX (CX) program (A) and the Superfamily Tree (SFT) program (B) for Superfamilies I – VII (A – G respectively).
Figure 5
Figure 5
Phylogenetic trees of holin superfamilies derived using the ClustaX (CX) program (A) and the Superfamily Tree (SFT) program (B) for Superfamilies I – VII (A – G respectively).
Figure 5
Figure 5
Phylogenetic trees of holin superfamilies derived using the ClustaX (CX) program (A) and the Superfamily Tree (SFT) program (B) for Superfamilies I – VII (A – G respectively).
Figure 5
Figure 5
Phylogenetic trees of holin superfamilies derived using the ClustaX (CX) program (A) and the Superfamily Tree (SFT) program (B) for Superfamilies I – VII (A – G respectively).
Figure 5
Figure 5
Phylogenetic trees of holin superfamilies derived using the ClustaX (CX) program (A) and the Superfamily Tree (SFT) program (B) for Superfamilies I – VII (A – G respectively).
Figure 5
Figure 5
Phylogenetic trees of holin superfamilies derived using the ClustaX (CX) program (A) and the Superfamily Tree (SFT) program (B) for Superfamilies I – VII (A – G respectively).
Figure 6
Figure 6
Schematic view of the topologies of members of the seven holin superfamilies (I–VII). Solid lines: TMSs that are present in all known members of the superfamily. Dashed lines represent TMSs present in some but not all members. # TMSs: The number of transmembrane α-helical segments (TMSs) predicted for the proteins of a superfamily. Families: TC holin family, indicated by family numbers, within the 1.E subclass of the Transporter Classification (TC) system as revealed in the TC database (TCDB; www.tcdb.org).

References

    1. Young R, Blasi U. Holins: form and function in bacteriophage lysis. FEMS Microbiol Rev. 1995;17:191–205. - PubMed
    1. Saier MH, Ma CH, Rodgers L, Tamang DG, Yen MR. Protein secretion and membrane insertion systems in bacteria and eukaryotic organelles. Adv Appl Microbiol. 2008;65:141–197. - PubMed
    1. Wang IN, Smith DL, Young R. Holins: the protein clocks of bacteriophage infections. Annu Rev Microbiol. 2000;54:799–825. - PubMed
    1. Desvaux M, Hebraud M, Talon R, Henderson IR. Secretion and subcellular localizations of bacterial proteins: a semantic awareness issue. Trends Microbiol. 2009;17:139–145. - PubMed
    1. Young R. Bacteriophage lysis: mechanism and regulation. Microbiol Rev. 1992;56:430–481. - PMC - PubMed

Publication types

MeSH terms