. 2013 Sep 1;73(17):5426-37.
doi: 10.1158/0008-5472.CAN-13-0443. Epub 2013 Jul 15.

PTK6 activation at the membrane regulates epithelial-mesenchymal transition in prostate cancer

Affiliations

PTK6 activation at the membrane regulates epithelial-mesenchymal transition in prostate cancer

Yu Zheng et al. Cancer Res. .

Erratum in

  • Cancer Res. 2013 Oct 1;73(19):6096

Abstract

The intracellular tyrosine kinase protein tyrosine kinase 6 (PTK6) lacks a membrane-targeting SH4 domain and localizes to the nuclei of normal prostate epithelial cells. However, PTK6 translocates from the nucleus to the cytoplasm in human prostate tumor cells. Here, we show that while PTK6 is located primarily within the cytoplasm, the pool of active PTK6 in prostate cancer cells localizes to membranes. Ectopic expression of membrane-targeted active PTK6 promoted epithelial-mesenchymal transition in part by enhancing activation of AKT, thereby stimulating cancer cell migration and metastases in xenograft models of prostate cancer. Conversely, siRNA-mediated silencing of endogenous PTK6 promoted an epithelial phenotype and impaired tumor xenograft growth. In mice, PTEN deficiency caused endogenous active PTK6 to localize at membranes in association with decreased E-cadherin expression. Active PTK6 was detected at membranes in some high-grade human prostate tumors, and PTK6 and E-cadherin expression levels were inversely correlated in human prostate cancers. In addition, high levels of PTK6 expression predicted poor prognosis in patients with prostate cancer. Our findings reveal novel functions for PTK6 in the pathophysiology of prostate cancer, and they define this kinase as a candidate therapeutic target. Cancer Res; 73(17); 5426-37. ©2013 AACR.


Figures
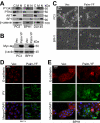
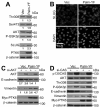
Figure 1
Figure 1. Expression of Palm-PTK6-YF induced cell-scattering phenotype in BPH1 and PC3 cells
A) The membrane pool of PTK6 is the active pool. PC3, DU145 and BPH1 cells were fractionated into three cellular compartments including cytoplasm, membrane/organelle and nucleus. Immunoblot analysis was performed with anti-P-PTK6 (PY342), PTK6, AKT, SP1 and β-catenin antibodies. AKT, SP1 and β-catenin localization were examined as controls for fractionation. While the majority of total PTK6 protein is cytoplasmic, the active pool (PY342) is membrane associated. B) Palm-PTK6-YF was stably expressed in PC3 and BPH1 cells. Immunoblot analysis was performed using anti-Myc-tag and β-actin antibodies. C) Cells expressing Palm-PTK6-YF (Fig. 1B) show the cell-scattering phenotype. Phase contrast images of PC3 and BPH1 cells stably expressing Palm-PTK6-YF or vector are shown. Size bar denotes 50 μm. D) Loss of E-cadherin at the membrane in PC3 cells stably expressing Palm-PTK6-YF. Cells were co-stained with anti-E-cadherin and phospho-tyrosine antibodies, and counterstained with DAPI (blue). Size bar denotes 20 μm. E) BPH1 cells that form peripheral adhesion complexes show deregulated E-cadherin at the cell membrane. Cells were co-stained with anti-E-cadherin and phospho-tyrosine antibodies and counterstained with DAPI (blue). Size bar denotes 20 μm.
Figure 2
Figure 2. Active PTK6 at the plasma membrane promotes EMT in prostate tumor cells
A) Immunoblot analysis of total cell lysates of PC3 cells stably expressing Palm-PTK6-YF or vector was performed using anti-E-cadherin, vimentin, ZEB1, Myc-tag and β-catenin antibodies. Expression of β-catenin does not change in cells expressing PTK6-Palm-YF (4) and it was used as a loading control. B) A subcellular fractionation assay was performed using PC3 cells expressing Palm-PTK6-YF or vector, and immunoblot analysis was performed using anti-E-cadherin, vimentin, ZEB1, P-PTK6 (PY342) and PTK6 antibodies. Both short and long exposures of PTK6 immunoblot are shown. C) An uncropped blot is presented to show specificity of the PY342 antibody. An arrowhead points to endogenous active PTK6 localized at the membrane in PC3 cells (Vector). Ectopic Palm-PTK6-YF runs slightly above the endogenous band in transfected cells (Paml-YF). D) mRNA levels of EMT markers are deregulated in Palm-PTK6-YF expressing PC3 cells. Quantitative RT-PCR was performed, and E-cadherin, vimentin, SLUG, Twist and ZEB1 mRNA levels were normalized to cyclophilin mRNA levels. *, P<0.05; **, P<0.01; ***, P<0.001. E) Semi-quantitative PCR was performed to monitor the change of mRNA levels of EMT markers including E-cadherin, vimentin, ZEB1 and SLUG. Cyclophilin served as a loading control.
Figure 3
Figure 3. PTK6 mediated EMT occurs partially through increased AKT activity
A) Increased AKT signaling in PC3 cells expressing Palm-PTK6-YF. Immunoblot analysis of total cell lysates of PC3 cells stably expressing Palm-PTK6-YF or vector was performed using anti-AKT, P-AKT (Thr308), P-AKT (Ser473), P-GSK3β (Ser9), SLUG PTK6 and β-catenin antibodies. Relative levels of P-AKT, P-GSK3β and SLUG normalized are indicated below the blots. B) Increased nuclear localization of SLUG in PC3 cells stably expressing Palm-PTK6-YF. Cells were stained with anti-SLUG antibody and counterstained with DAPI (blue). Size bar denotes 50 μm. C) Knockdown of AKT partially rescues Palm-PTK6-YF-induced EMT. PC3 cells expressing Palm-PTK6-YF or vector were transfected with AKT siRNAs or control siRNAs for 3 days. Immunoblotting was performed with anti-AKT, E-cadherin, vimentin, PTK6 and β-catenin antibodies. Relative levels of E-cadherin and vimentin normalized to the β-catenin loading control are indicated below the blots. D) Knockdown of p130CAS partially rescues Palm-PTK6-YF-induced EMT. PC3 cells expressing Palm-PTK6-YF or vector were transfected with p130CAS siRNAs or control siRNAs for 3 days. Immunoblotting was performed with anti-p130CAS, AKT, P-AKT (Thr308), P-GSK3β (Ser9), E-cadherin, vimentin, Myc-tag and β-catenin antibodies.
Figure 4
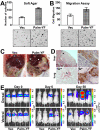
Figure 4. PC3 cells expressing Palm-PTK6-YF are more tumorigenic and invasive
A) Palm-PTK6-YF expressing cells form increased number of colonies in soft agar. Representative images are shown. B) Palm-PTK6-YF expression promotes cell migration in Transwell chamber assays. Representative images are shown. C) Intracardiac injection of PC3 cells expressing Palm-PTK6-YF results in increased metastases to internal organs of immunodeficient SCID mice after 10 weeks. White arrows point at tumors in liver and pancreas. D) H&E staining was performed with lung and liver tumor sections. Black arrows point at tumors. Size bar denotes 100 μm. Immunohistochemistry using anti-PTK6 antibody shows that tumor cells in lung and liver exhibit membrane staining of PTK6 (Palm-PTK6-YF). Size bar denotes 20 μm. E) Intravenous injection of PC3 cells expressing Palm-PTK6-YF showed increased metastases in SCID mice. Both control and Palm-PTK6-YF expressing cells stably express luciferase. One million cells were injected intravenously at day 0. Mice were monitored under IVIS spectrum imaging system every week until day 50.
Figure 5
Figure 5. PC3 cells are less tumorigenic and invasive after knockdown of PTK6
A) E-cadherin is increased upon knockdown of PTK6 in PC3 cells. PC3 cells were transfected with PTK6 siRNAs or control siRNAs for 2, 4 or 6 days. Total cell lysates were analyzed by immunoblotting with anti-E-cadherin, ZEB1, PTK6 and β-actin antibodies. Relative levels of E-cadherin, vimentin, and ZEB1 expression normalized to actin levels are indicated below the blots. B) A growth curve of PC3 cells transfected with PTK6 siRNAs or control siRNAs shows decreased proliferation from day 1 to day 7 after PTK6 knockdown. Relative Light Units (RLU) were measured by CellTiter-Glo Luminescent Cell Viability Assay. C) The number of colonies that form on plates 2 weeks post-plating is decreased upon PTK6 knockdown. Corresponding images are shown below the graph. D) The number of colonies that form in soft agar 3 weeks post-plating is decreased upon PTK6 knockdown. Representative images are shown. E) Cell invasion is impaired upon PTK6 knockdown in Matrigel invasion chamber assays. F) Knockdown of PTK6 in PC3 cells largely reduces metastases in SCID mice. PC3 cells stably expressing luciferase were transfected with PTK6 siRNA or control siRNA twice before injection. Mice were monitored under IVIS spectrum imaging system every week.
Figure 6
Figure 6. Aberrant activation of PTK6 is accompanied by deregulated E-cadherin at the plasma membrane in prostate tumor cells of PB-Cre4, Ptenflox/flox mice
A) An enlarged anterior prostate was observed in PB-Cre4, Ptenflox/flox mice at the age of 6 months. B) Endogenous PTK6 is activated at the membrane in prostate tumor cells in a murine model (PB-Cre4, Ptenflox/flox). Immunohistochemistry was performed with anti-PTEN, P-AKT (Ser473), PTK6 and P-PTK6 (Tyr342) antibodies, and samples were counterstained with DAPI (blue). The size bar denotes 20 μm. C) Prostate tumor cells with highly activated PTK6 at the plasma membrane undergo EMT. Immunohistochemistry was performed with anti-PY, P-PTK6 (PY342), CK5, CK8, p63, BrdU, Ki67, E-cadherin and vimentin antibodies, and samples were counterstained with DAPI (blue). The size bar denotes 50 μm and 20 μm, respectively.
Figure 7
Figure 7. High levels of PTK6 predict poor prognosis of prostate cancer patients
A) Kaplan-Meier survival curves of patients with low, medium and high PTK6 mRNA expression levels exhibit a significant difference in survival (n = 36 for high PTK6; n=254 for medium PTK6; n=73 for low PTK6; Log-rank test p<0.005; Wilcoxon test p<0.005). B) Kaplan-Meier curves for the recurrence-free proportion of patients with low, medium and high PTK6 mRNA expression (n = 14 for high PTK6; n=88 for medium PTK6; n=38 for low PTK6; Log-rank test p<0.05; Wilcoxon test p<0.01). C) Increased levels of PTK6 mRNA and decreased E-cadherin expression are detected in metastatic prostate cancer samples by analyzing the NCBI human genome microarray dataset GDS2545. *, P<0.05; **, P<0.01; ***, P<0.001. D) PTK6 expression is inversely correlated with levels of E-cadherin expression in normal tissue and metastatic cancer samples (dataset GDS2545) in a linear regression model. E) Active PTK6 was detected at the plasma membrane of tumor cells in human prostate cancer samples (a, b: Gleason 4–5; c, d: Gleason 3). Immunohistochemistry was performed using human prostate tumor tissue with anti-P-PTK6 (PY342) antibodies, and samples were counterstained with DAPI (blue). The size bar denotes 20 μm.

References

    1. ACS . Cancer Facts & Figures 2013. American Cancer Society; Atlanta: 2013.
    1. Sato I, Obata Y, Kasahara K, Nakayama Y, Fukumoto Y, Yamasaki T, et al. Differential trafficking of Src, Lyn, Yes and Fyn is specified by the state of palmitoylation in the SH4 domain. Journal of cell science. 2009;122:965–75. - PubMed
    1. Ie Kim H, Lee ST. Oncogenic functions of PTK6 are enhanced by its targeting to plasma membrane but abolished by its targeting to nucleus. Journal of biochemistry. 2009;146:133–9. - PubMed
    1. Palka-Hamblin HL, Gierut JJ, Bie W, Brauer PM, Zheng Y, Asara JM, et al. Identification of beta-catenin as a target of the intracellular tyrosine kinase PTK6. J Cell Sci. 2010;123:236–45. - PMC - PubMed
    1. Zheng Y, Asara JM, Tyner AL. Protein-tyrosine Kinase 6 Promotes Peripheral Adhesion Complex Formation and Cell Migration by Phosphorylating p130 CRK-associated Substrate. The Journal of Biological Chemistry. 2012;287:148–58. - PMC - PubMed

Publication types

MeSH terms