

Review
doi: 10.3390/s130708928.
Dental optical coherence tomography
Affiliations
- PMID: 23857261
- PMCID: PMC3758630
- DOI: 10.3390/s130708928
Item in Clipboard
Review
Dental optical coherence tomography
Sensors (Basel).
.
Abstract
This review paper describes the applications of dental optical coherence tomography (OCT) in oral tissue images, caries, periodontal disease and oral cancer. The background of OCT, including basic theory, system setup, light sources, spatial resolution and system limitations, is provided. The comparisons between OCT and other clinical oral diagnostic methods are also discussed.
Figures
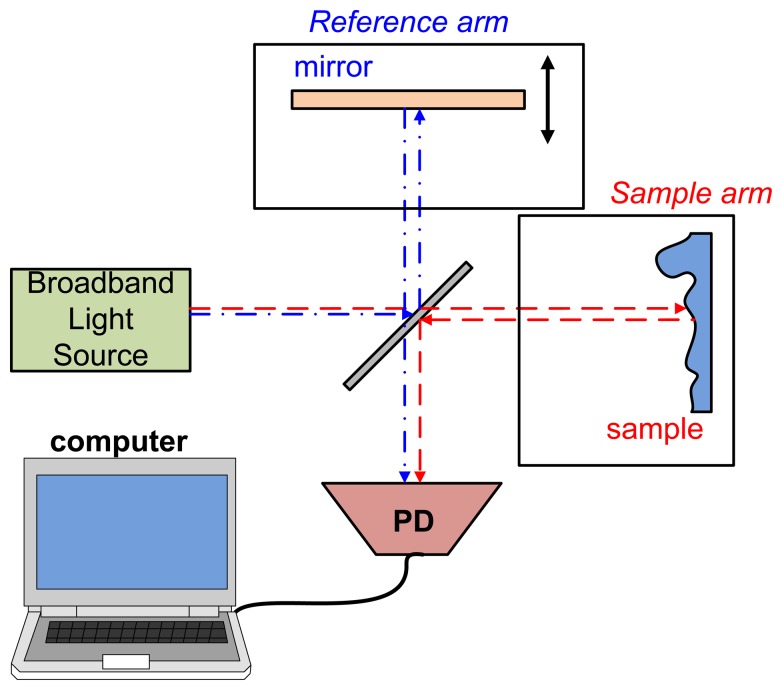
System setup of TD-OCT (PD: photodiode).
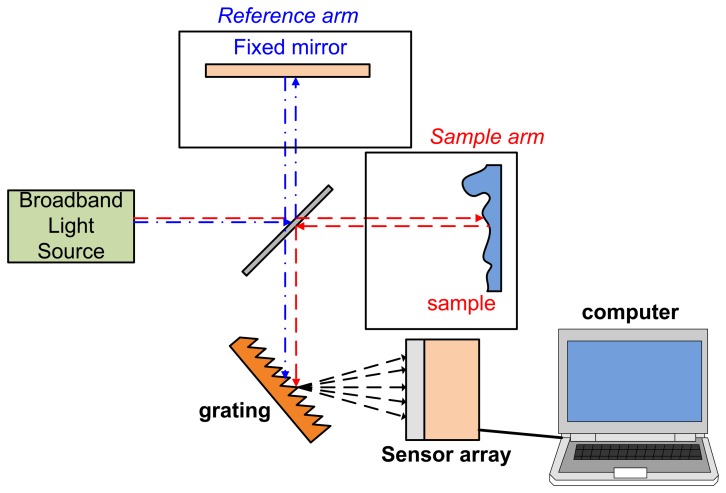
System setup of SD-OCT.
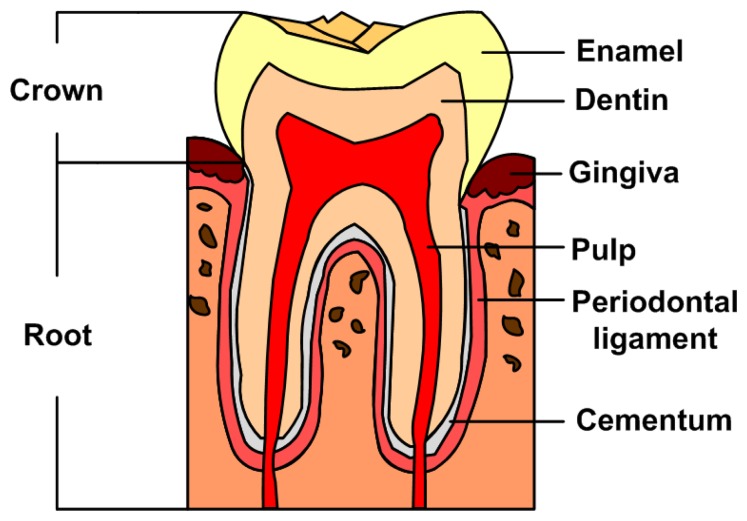
Schematic diagram of a tooth structure.
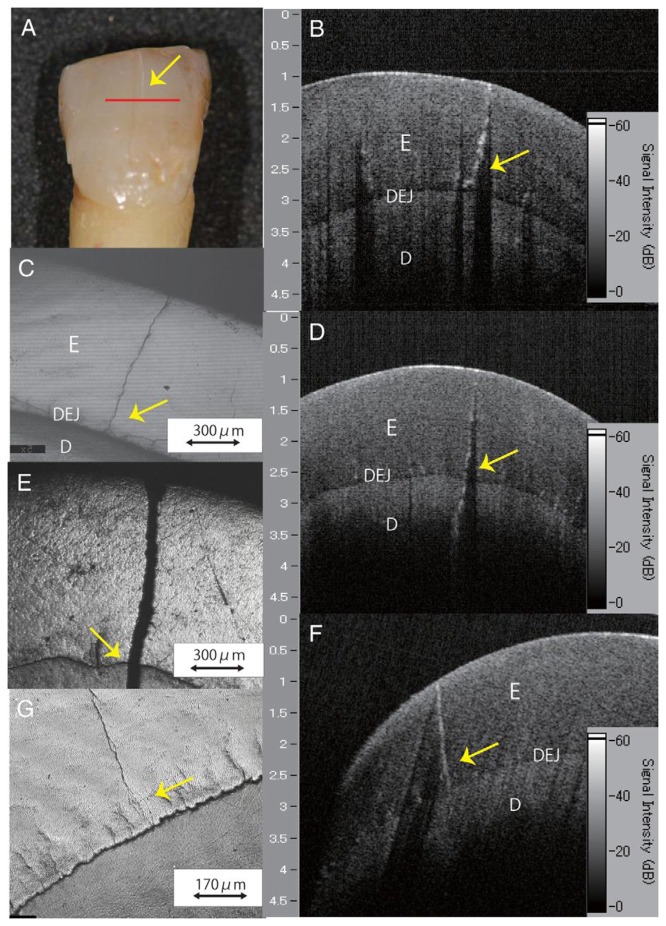
Images of a distinct enamel crack. (A) A visual examination of enamel crack. (B) A SS-OCT image along the red line in (A). The crack extended to the DEJ. (C) A CLSM image corresponding to the cross-sectioned enamel crack along the red line in (A). The crack ended up to the DEJ. (D) A SS-OCT image of a sample determined as a deep enamel crack transillumination. The crack was seen extending beyond the DEJ. (E) A CLSM image corresponding to the cross-sectioned enamel crack in (D). The crack penetrated deep into the dentin. (F) A SS-OCT image of a sample determined as a superficial enamel crack with transillumination. The crack had extended into the DEJ. (G) A CLSM image corresponding to the cross-sectioned enamel crack in (F). The crack had not extended into the DEJ (E: enamel; D: dentine; DEJ: dentin-enamel junction) (reprinted from reference [49]).
OCT images revealed microleakage between composite resin restoration and the tooth. (C: composite restoration; E: enamel; D: dentin) (reprinted from reference [52]).
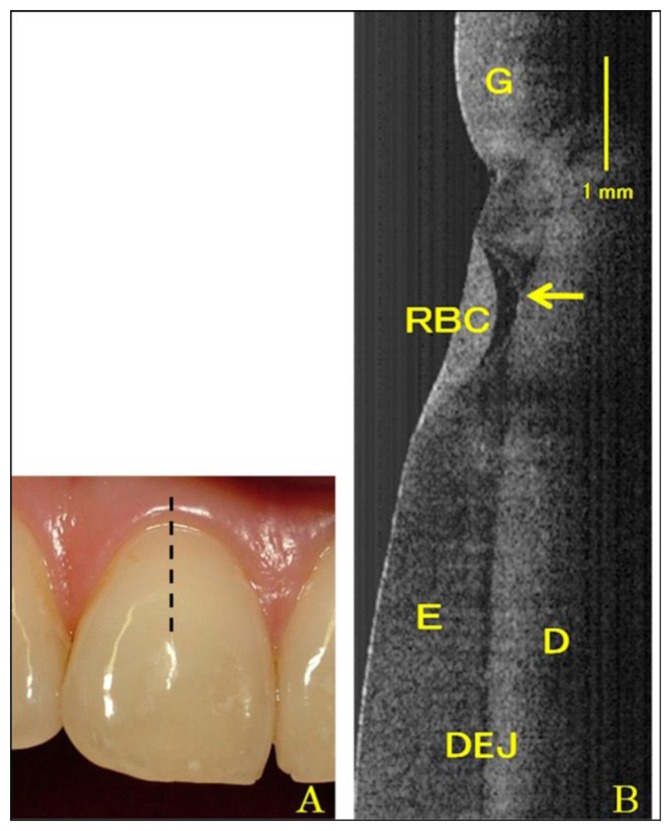
Photogragh (A) and SS-OCT image (B) of Class V restoration in the central incisor. Arrow shows microleakage formation beneath resin material (G: gingival; RBC: resin based composite; E: enamel; D: dentin; DEJ: dental enamel junction) (reprinted from reference [54]).
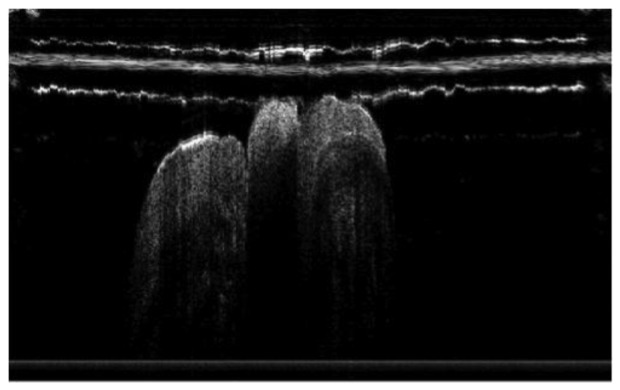
In vivo OCT image of microleakage detected by a custom-made dental optical probe (reprinted from reference [55]).
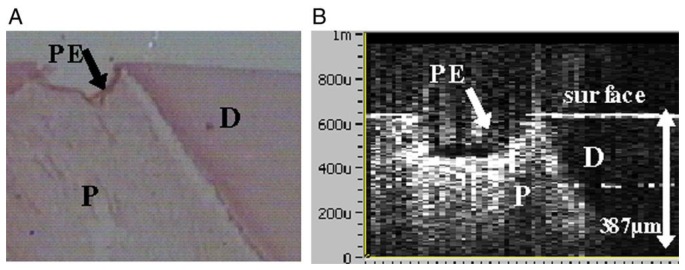
Site of pulp exposure. (A) Histologic cross-section of pulp exposure. (B) The pulp and dentin were clearly delineated in the OCT image (P: pulp; D: dentin; PE: pulp exposure) (reprinted from reference [56]).
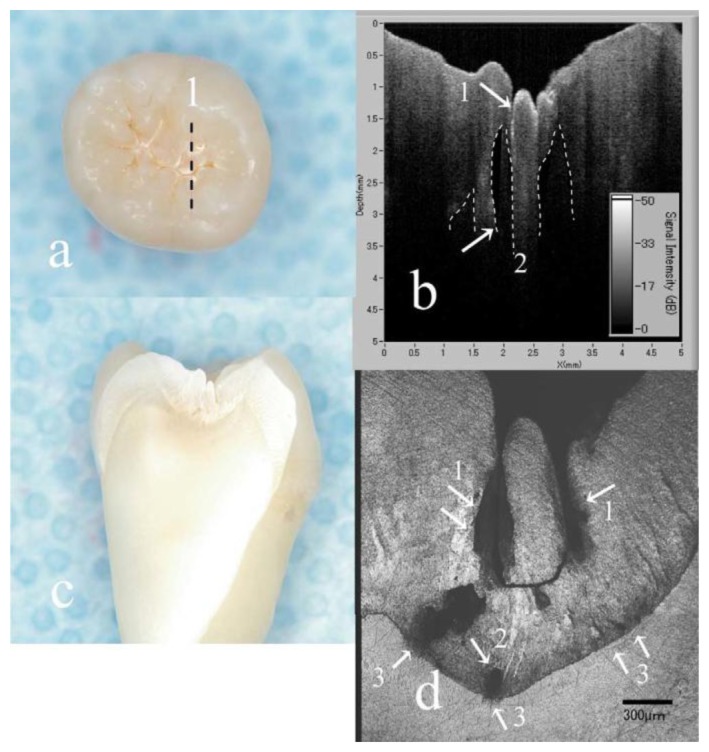
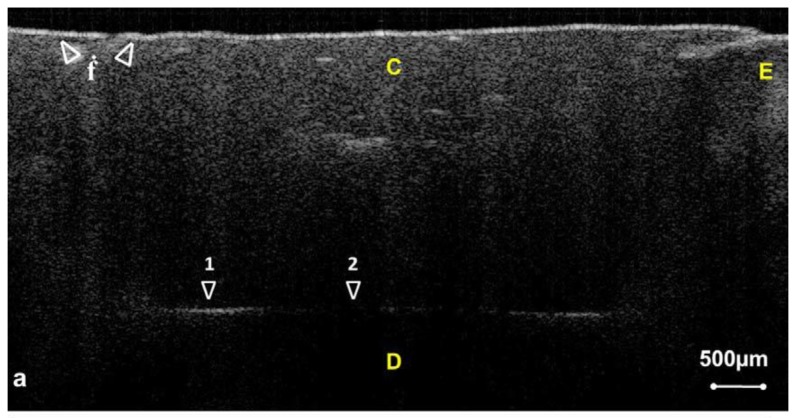
OCT images of the carious lesion and sound regions. (a) Visualization of a slightly demineralized tooth. (b) SS-OCT image obtained at line 1 in A. The presence of demineralization was determined as a strong scattering signal from the bottom of the fissure (arrow 1). Reflecting OCT signal from the enamel was in some part lacking elliptically beneath the occlusal fissure (arrow 2, dotted line). (c) Cross-sectioned view at line 1 in A. (d) CLSM image correspond to the cross-sectioned “enamel demineralization” at line 1 in A. CLSM observation clearly confirmed the presence of “hidden lesion” (arrows 1 and 2). Compared with B, the hidden lesion located at the outer enamel was detectable in SS-OCT (arrow 1); however, deeper lesions located near the EDJ could not be visualized in SS-OCT (arrow 2). Since the EDJ vicinity appeared roughened (arrow 3) some of which were reached to the dentine (reprinted from reference [65]).
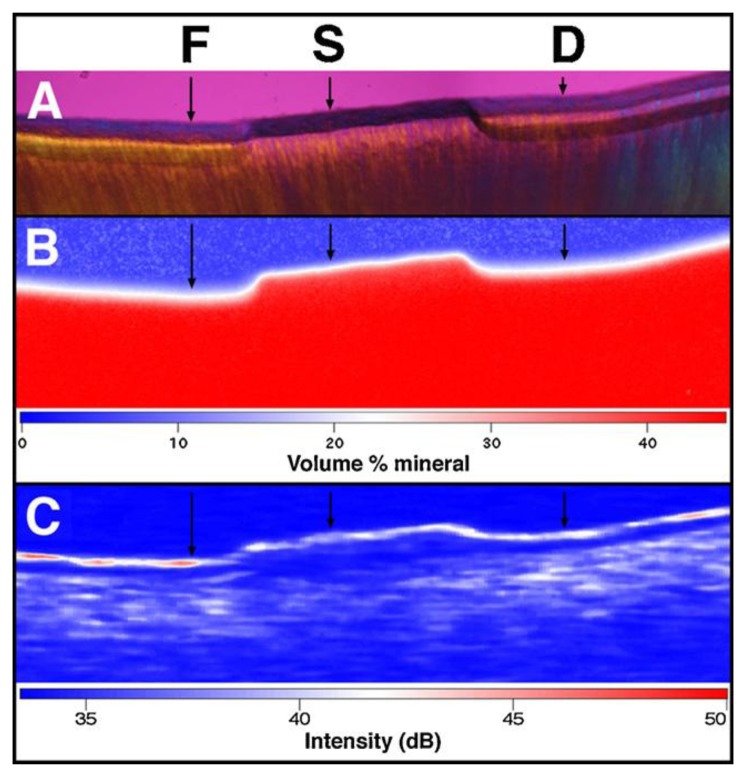
Measuring demineralization by polarized light microscopy (PLM), transverse microradiography (TMR), and PS-OCT images. The black arrows indicated topical fluride (F), protected sound dentin (S), and untreated demineralization area (D). PLM (A) shows the lesion depth on both sides (F and D) of the sound protected area. TMR (B) and PS-OCT (C) images are also shown along with the false color intensity scales. PLM and PS-OCT were superior to TMR as a tool for measuring lesion depth and cementum layer thicknesses because these measurements were much higher sensitivity to mineral loss (reprinted from reference [72]).
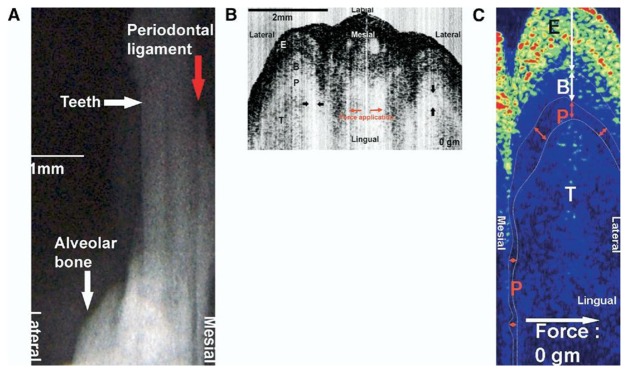
Images of a periodontal ligament. (A) Radiograph. (B) OCT. (C) Logging OCT images; the boundary of each tissue can be identified more clearly (reprinted from reference [82]).

OCT image of subgingival calculus. (A) Subgingival calculus without coverage of gingiva. (B) Subgingival calculus covered with gigniva (reprinted from reference [28]).
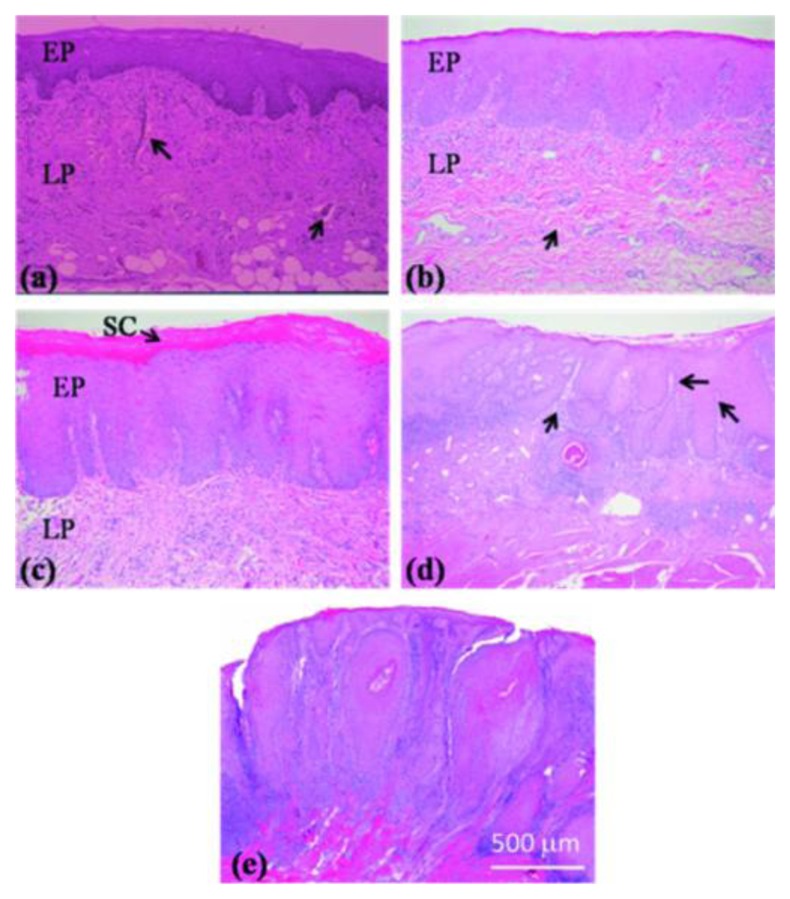
Histological images of the (a) normal, (b) MiD, (c) MoD, (d) ES-SCC, and (e) WD-SCC samples (reprinted from reference [95]).
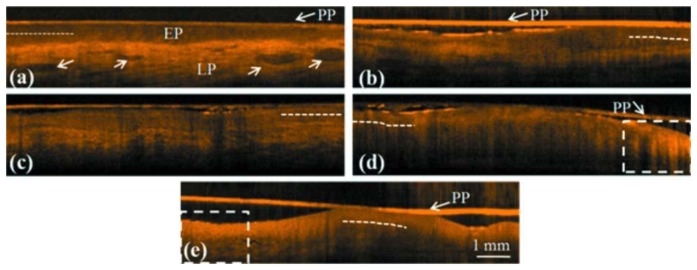
SS-OCT scanned images of the (a) normal control and biopsied oral (b) MiD, (c) MoD, (d) ES-SCC, and (e) WD-SCC lesions. Their histological images were shown in Figure 13(a–e) (reprinted from reference [95]).
References
-
- Poneros J.M., Brand S., Bouma B.E., Tearney G.J., Compton C.C., Nishioka N.S. Diagnosis of specialized intestinal metaplasia by optical coherence tomography. Gastroenterology. 2001;120:7–12. - PubMed
-
- Evans J.A., Poneros J.M., Bouma B.E., Bressner J., Halpern E.F., Shishkov M., Lauwers G.Y., Kenudson M.M., Nishioka N.S., Tearney G.J. Optical coherence tomography to identify intramucosal carcinoma and high-grade dysplasia in Barrett's esophagus. Clin. Gastroenterol. Hepatol. 2006;4:38–43. - PMC - PubMed
Publication types
MeSH terms
LinkOut - more resources
Full Text Sources
Other Literature Sources
