. 2013 Aug 23;288(34):24788-98.
doi: 10.1074/jbc.M113.496679. Epub 2013 Jul 15.

Heterogeneous nuclear ribonucleoprotein (HnRNP) K genome-wide binding survey reveals its role in regulating 3'-end RNA processing and transcription termination at the early growth response 1 (EGR1) gene through XRN2 exonuclease

Affiliations

Heterogeneous nuclear ribonucleoprotein (HnRNP) K genome-wide binding survey reveals its role in regulating 3'-end RNA processing and transcription termination at the early growth response 1 (EGR1) gene through XRN2 exonuclease

Michal Mikula et al. J Biol Chem. .

Abstract

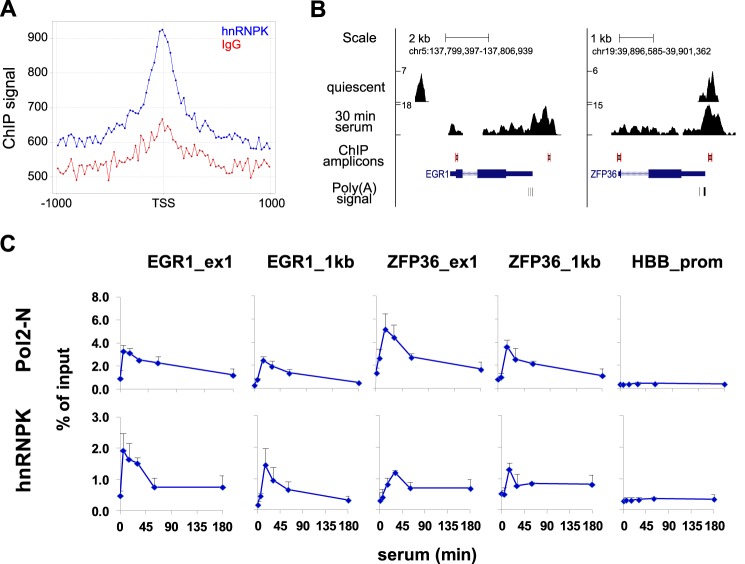
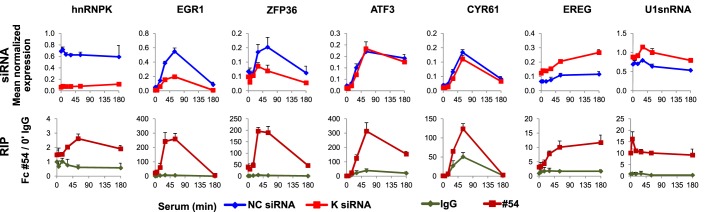
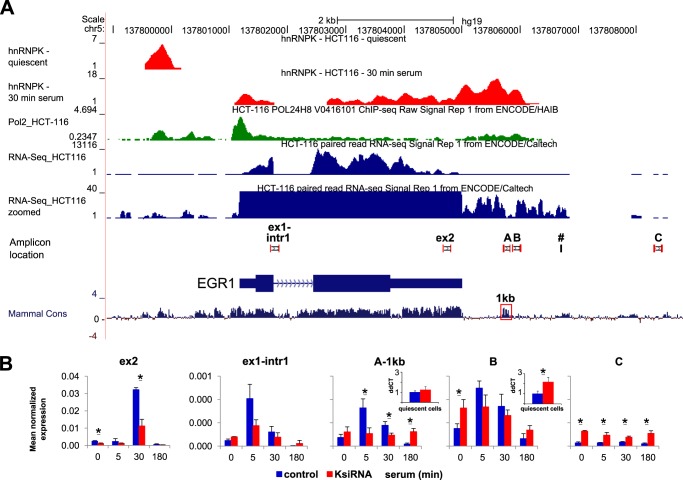
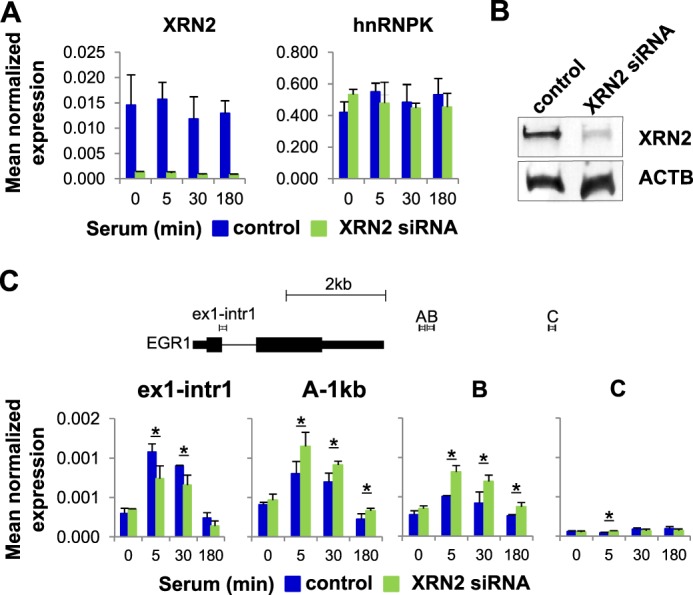
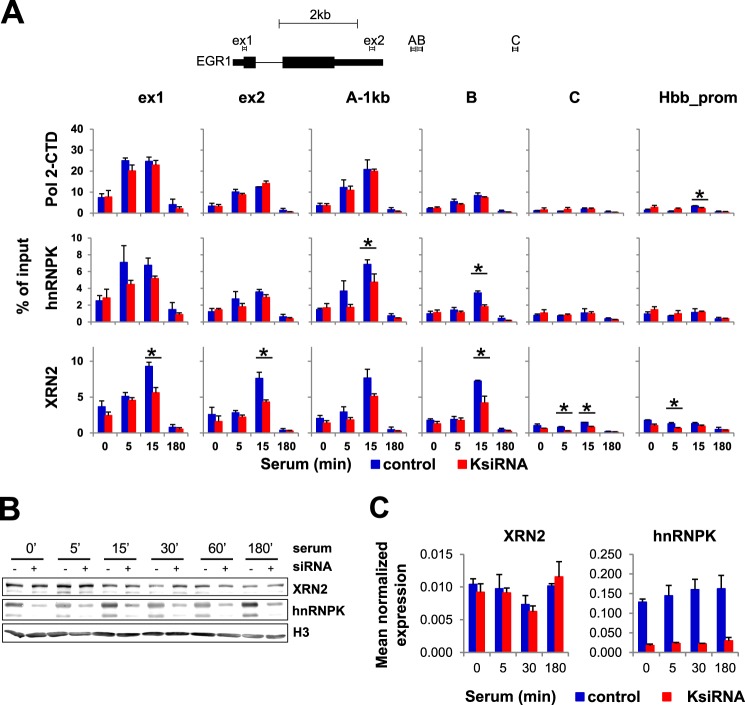
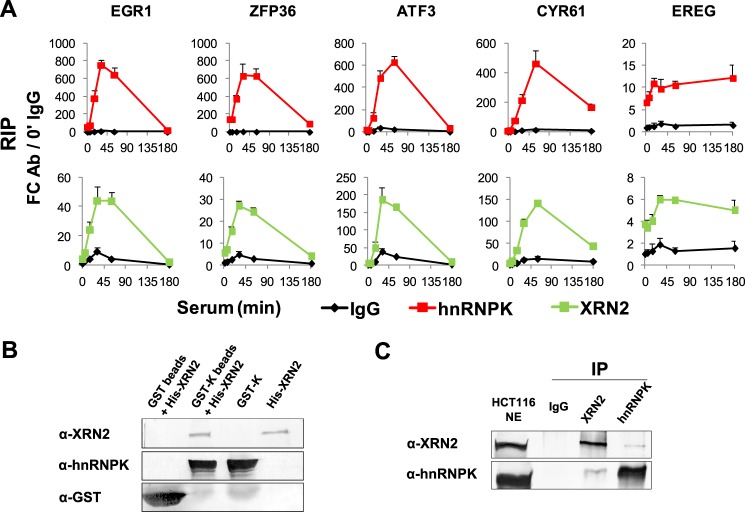
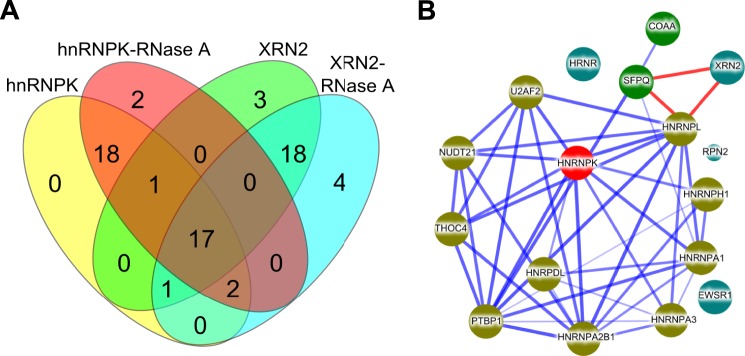
The heterogeneous nuclear ribonucleoprotein K (hnRNPK) is a nucleic acid-binding protein that acts as a docking platform integrating signal transduction pathways to nucleic acid-related processes. Given that hnRNPK could be involved in other steps that compose gene expression the definition of its genome-wide occupancy is important to better understand its role in transcription and co-transcriptional processes. Here, we used chromatin immunoprecipitation followed by deep sequencing (ChIP-Seq) to analyze the genome-wide hnRNPK-DNA interaction in colon cancer cell line HCT116. 9.1/3.6 and 7.0/3.4 million tags were sequenced/mapped, then 1809 and 642 hnRNPK binding sites were detected in quiescent and 30-min serum-stimulated cells, respectively. The inspection of sequencing tracks revealed inducible hnRNPK recruitment along a number of immediate early gene loci, including EGR1 and ZFP36, with the highest densities present at the transcription termination sites. Strikingly, hnRNPK knockdown with siRNA resulted in increased pre-RNA levels transcribed downstream of the EGR1 polyadenylation (A) site suggesting altered 3'-end pre-RNA degradation. Further ChIP survey of hnRNPK knockdown uncovered decreased recruitment of the 5'-3' exonuclease XRN2 along EGR1 and downstream of the poly(A) signal without altering RNA polymerase II density at these sites. Immunoprecipitation of hnRNPK and XRN2 from intact and RNase A-treated nuclear extracts followed by shotgun mass spectrometry revealed the presence of hnRNPK and XRN2 in the same complexes along with other spliceosome-related proteins. Our data suggest that hnRNPK may play a role in recruitment of XRN2 to gene loci thus regulating coupling 3'-end pre-mRNA processing to transcription termination.

Keywords: Chromatin Immunoprecipitation (ChiP); Gene Expression; Mass Spectrometry (MS); RNA Polymerase II; Transcription Termination; XRN2; hnRNPK.


Figures

FIGURE 1.
FIGURE 1.
Human colon HCT116 carcinoma cell global and local hnRNPK binding distribution in relationship to TSSs and at two immediate early genes, respectively. A, genome-wide hnRNPK occupancy (blue) plotted relative to the nearest TSSs in a region spanning ±1 kb. IgG (red) denotes the unspecific ChIP-Seq signal in the same regions. The y axis indicates a sum of tags aligned at each position, for all TSSs in the ENSEMBL database. The signal was normalized to the equalize component from each TSS, regardless of the total number of tags in its vicinity. Binding profiles were generated with jChIP software (available at www.ire.pw.edu.pl/∼kchojnowski/jChIP/). B, hnRNPK ChIP-Seq signal at EGR1 and ZFP36 genes. After filtering out tags overlapping with the IgG library sequence, reads were mapped on human genome (version; hg19) and linked with the UCSC genome browser (genome.ucsc.edu). The y axis indicates the number of tags aligned at each position in the genome. C, ChIP analysis (11) of serum HCT116 time course binding profile of Pol2 and hnRNPK to EGR1, ZFP36 loci, and β-globin (HBB) promoter. ChIP analysis of sheared chromatin from a time course of serum-treated primers (10% FBS for 0, 5, 15, 30, 60, and 180 min). qPCR was done using primers (Table 1) spanning an area as shown in B. ChIP data are expressed as DNA recovery in percentage (%) of input (mean ± S.D., n = 3).
FIGURE 2.
FIGURE 2.
Diverse effects of hnRNPK protein knockdown on its RNA partners. siRNA, the HCT116 WT human colon carcinoma cell line was transfected with α-hnRNPK siRNA and control (NC) siRNA, and subjected to serum time course followed by RNA extraction, DNase I treatment, and qRT-PCR. The results were normalized for RPLP0 mRNA (mean ± S.D., n = 3). RIP, whole cell lysates of HCT116 WT treated with serum were used in a microplate-based RIP assay with the antibody to rabbit IgG and hnRNPK (#54). The results are expressed as a fold-change of RNA binding to #54 antibody over IgG at 0′ time point (mean ± S.D., n = 3).
FIGURE 3.
FIGURE 3.
HnRNPK knockdown increases abundance of pre-mRNA downstream EGR1. A, occupancy profiles of hnRNPK and Pol2 at the EGR1 locus in HCT116 cell line. UCSC browser (hg19) profile of hnRNPK (red), Pol2 (green), ChIP-seq and RNA-Seq (blue) track (y axis; a number of tags aligned at each position in the genome, hnRNPK; reads per million, Pol2) together with locations of amplicons from qRT-PCR and ChIP studies. Coordinates shown represent the chr5:137,798,894–137,808,801 chromosomal region. The tracks for Pol2 and RNA-Seq were taken from the ENCODE dataset deposited at the UCSC browser under accession codes wgEncodeEH001627 and wgEncodeEH001425, respectively. B, effect of hnRNPK knockdown on nascent pre-mRNA levels along EGR1 and the downstream poly(A) site (see Fig. 2 siRNA for experimental details), primer sequences are listed in Table 1. Insert, RT with gene-specific primer (#, denotes its location) in quiescent cells. Pre-mRNA levels were calculated using the relative ΔΔ (dd) Ct method. Statistical analysis of differences between mean cDNA levels for control and K-depleted cells was performed using t tests. A p value of < 0.05 (*) was considered significant. Red square points to the 1-kb region that overlaps with a high level of DNA sequence homology found in mammals.
FIGURE 4.
FIGURE 4.
XRN2 depletion augments inducible pre-mRNA levels downstream of the EGR1 gene. A and C, HCT116 WT human colon carcinoma cells line were transfected with either XRN2 siRNA or NC siRNA in the presence of Lipofectamine RNAiMAX. 24 h after transfection, cells were switched to 0.5% FBS medium, and 24 h after quiescence, cells were treated with 10% FBS for 0, 5, 30, and 180 min followed by RNA extraction, DNase I treatment, and qRT-PCR. The results were normalized for RPLP0 mRNA (mean ± S.D., n = 4). A p value of <0.05 (*) was considered significant. Graphical depiction of amplicons localization at the EGR1 gene corresponds to coordinates presented at Fig. 3A. B, quiescent XRN2-depleted HCT116 cells prepared the same as in A; C were harvested and lysates were resolved by SDS-PAGE and electrotransferred to PVDF membrane. Blotted proteins were assessed by Western blot analysis using the antibodies to XRN2 (ab72181) and β-Actin (ab6276).
FIGURE 5.
FIGURE 5.
HnRNPK knockdown decreases the 5′-3′ exonuclease XRN2 recruitment do EGR1 locus. A, HCT116 WT human colon carcinoma cell lines were transfected with either hnRNPK siRNA or NC siRNA in the presence of Lipofectamine RNAiMAX. 24 h after transfection, cells were switched to 0.5% FBS medium, and 24 h after quiescence, cells were treated with 10% FBS for 0, 5, 15, and 180 min then fixed, chromatin isolated, and sheared. Matrix ChIP assay was done using antibodies to Pol2, hnRNPK, and XRN2. ChIP results are shown for the PCR product depicted on the gene schematic. ChIP data are expressed as DNA recovery in percentage (%) of input (mean ± S.D., n = 3). Statistical analysis of differences between mean DNA recovery for control and K-depleted chromatin was performed using t tests. A p value of <0.05 (*) was considered significant. B, hnRNPK-depleted HCT116 cells prepared as in A were treated with 10% FBS for 0, 5, 15, 30, 60, and 180 min, then harvested, and lysates were resolved by SDS-PAGE and electrotransferred to PVDF membrane. Blotted proteins were assessed by Western blot analysis using the antibodies to hnRNPK #54, XRN2 (ab72181), and H3 (ab1791). C, cells prepared as in A were subjected to a serum time course followed by RNA extraction, DNase I treatment, and qRT-PCR. Results were normalized for RPLP0 mRNA (mean ± S.D., n = 3).
FIGURE 6.
FIGURE 6.
HnRNPK and XRN2 are present in the same RNP complex. A, RIP assay, HCT116 whole cell lysates from time course experiments were used in microplate-based RIP assay with the antibody to rabbit IgG, hnRNPK (#54), and XRN2. Results are expressed as a fold-change of RNA binding over IgG reference at 0 min time point (mean ± S.D., n = 3). B, bacterially expressed recombinant hnRNPK and XRN2 protein interactions. Purified GST and GST-hnRNPK proteins bound to glutathione beads were incubated with His-XRN2 protein. Proteins eluted from the beads were analyzed by SDS-PAGE, transferred to PVDF membrane, and visualized by immunostaining using antibodies to hnRNPK #54, XRN2 (ab72181), and GST (ab92). C, reciprocal co-IPs with mock IgG, anti-XRN2, and anti-hnRNPK antibody. IPs were resolved by SDS-PAGE, then electrotransferred to PVDF membrane and visualized by immunoblot using anti-XRN2 and anti-hnRNPK antibody. 10 μg of NE was loaded to denote the position of proteins.
FIGURE 7.
FIGURE 7.
Shotgun mass spectrometry reveals the presence of hnRNPK and XRN2 in the same spliceosome complexes. A, nuclei pellets were fixed with formaldehyde and quenched with glycine, then resuspended in IP buffer with or without RNase A treatment followed by sonication. Nuclear extracts precleared with mock IgG and IP reactions using either anti-XRN2 or anti-hnRNPK antibody were performed. Mock IgG, hnRNPK, and XRN2 immunoprecipitates were reduced, alkylated, digested with trypsin, and subjected to MS analyses The Venn diagram depicts a number of proteins identified in IP reactions using anti-hnRNPK and anti-XRN2 antibody. B, a protein interaction network constructed with STRING (32) for a set of 17 human proteins common for hnRNPK and XRN2 IP reactions. Stronger associations are represented by thicker lines. Lines shown in light blue represent protein-protein interactions deposited in STRING database, lines shown in red represent XRN2 interactions shown by Kaneko et al. (33). Node color depicts the type of interaction with hnRNPK in the STRING database: dark yellow, green, and dark blue represent direct, indirect, and no interaction, respectively.

References

    1. Bomsztyk K., Denisenko O., Ostrowski J. (2004) HnRNP K. One protein multiple processes. Bioessays 26, 629–638 - PubMed
    1. Du Q., Melnikova I. N., Gardner P. D. (1998) Differential effects of heterogeneous nuclear ribonucleoprotein K on Sp1- and Sp3-mediated transcriptional activation of a neuronal nicotinic acetylcholine receptor promoter. J. Biol. Chem. 273, 19877–19883 - PubMed
    1. Shi L., Ko S., Kim S., Echchgadda I., Oh T. S., Song C. S., Chatterjee B. (2008) Loss of androgen receptor in aging and oxidative stress through Myb proto-oncoprotein-regulated reciprocal chromatin dynamics of p53 and poly(ADP-ribose) polymerase PARP-1. J. Biol. Chem. 283, 36474–36485 - PMC - PubMed
    1. Michelotti E. F., Michelotti G. A., Aronsohn A. I., Levens D. (1996) Heterogeneous nuclear ribonucleoprotein K is a transcription factor. Mol. Cell. Biol. 16, 2350–2360 - PMC - PubMed
    1. Takimoto M., Tomonaga T., Matunis M., Avigan M., Krutzsch H., Dreyfuss G., Levens D. (1993) Specific binding of heterogeneous ribonucleoprotein particle protein K to the human c-myc promoter, in vitro. J. Biol. Chem. 268, 18249–18258 - PubMed

Publication types

MeSH terms