. 2014 Feb;29(2):304-15.
doi: 10.1002/jbmr.2038.

Delayed bone regeneration is linked to chronic inflammation in murine muscular dystrophy

Affiliations

Delayed bone regeneration is linked to chronic inflammation in murine muscular dystrophy

Rana Abou-Khalil et al. J Bone Miner Res. 2014 Feb.

Abstract

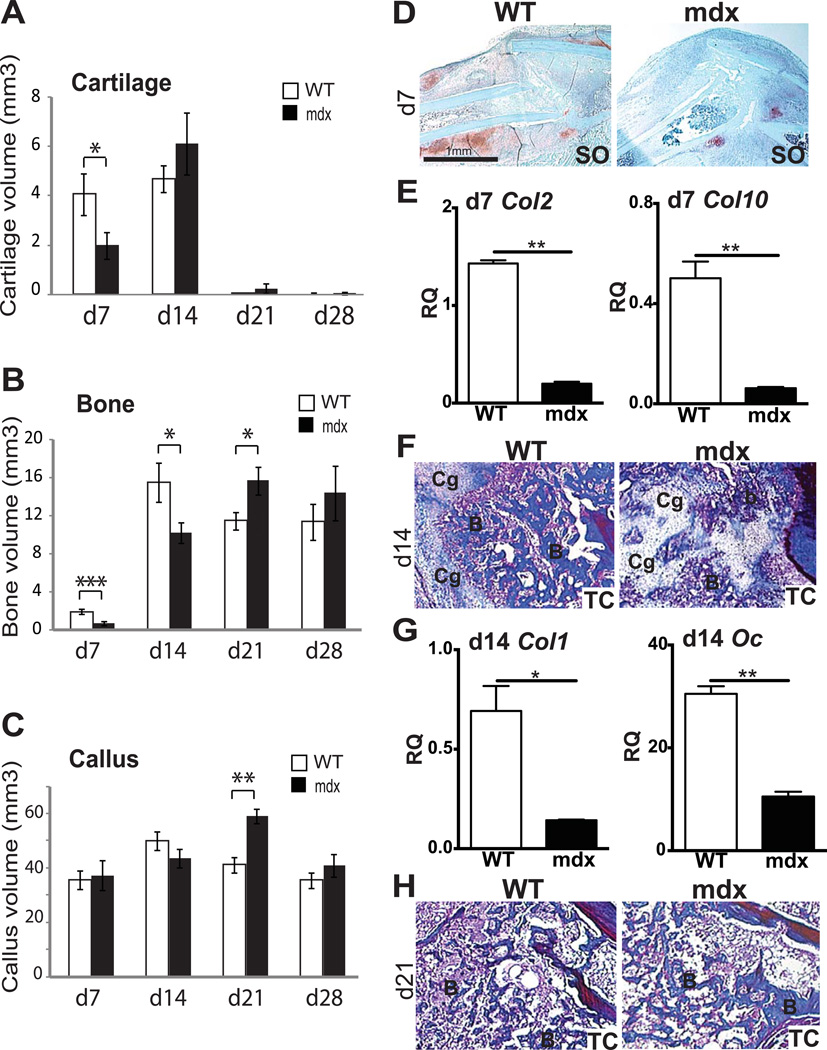
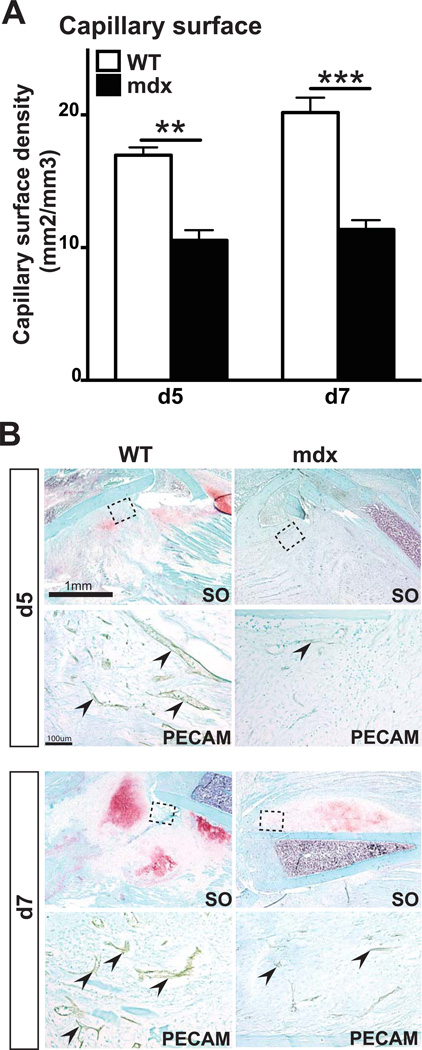
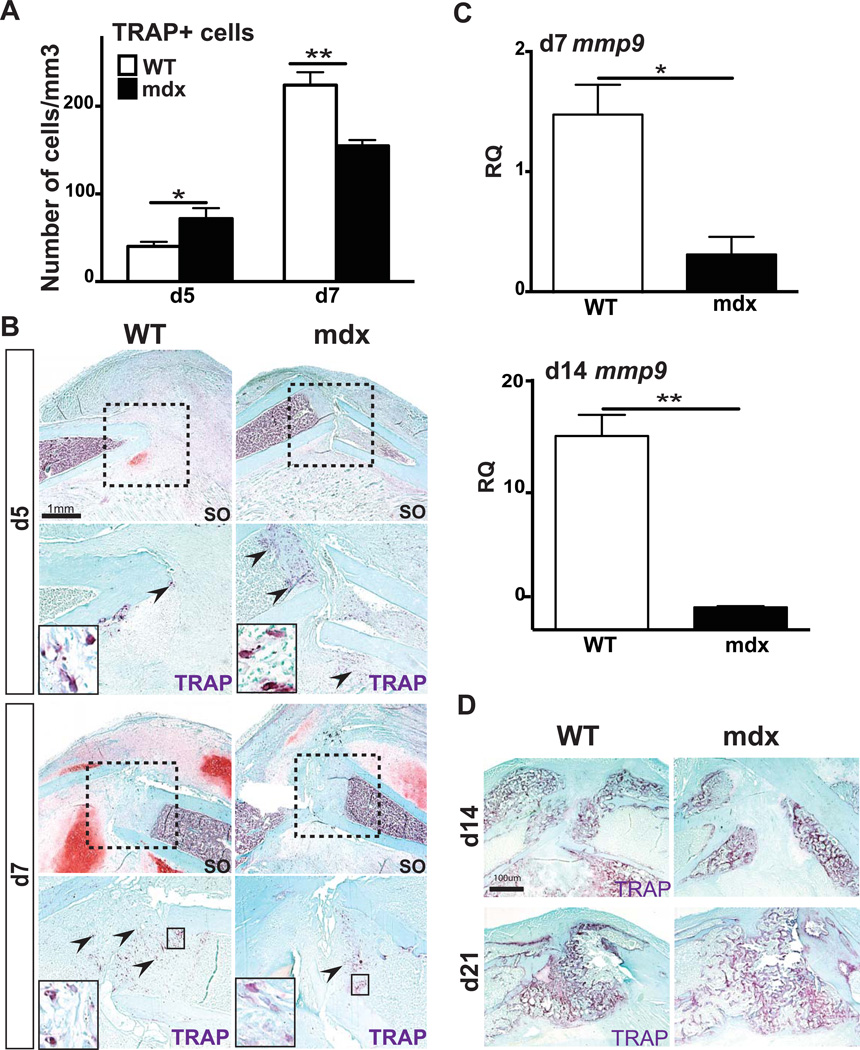
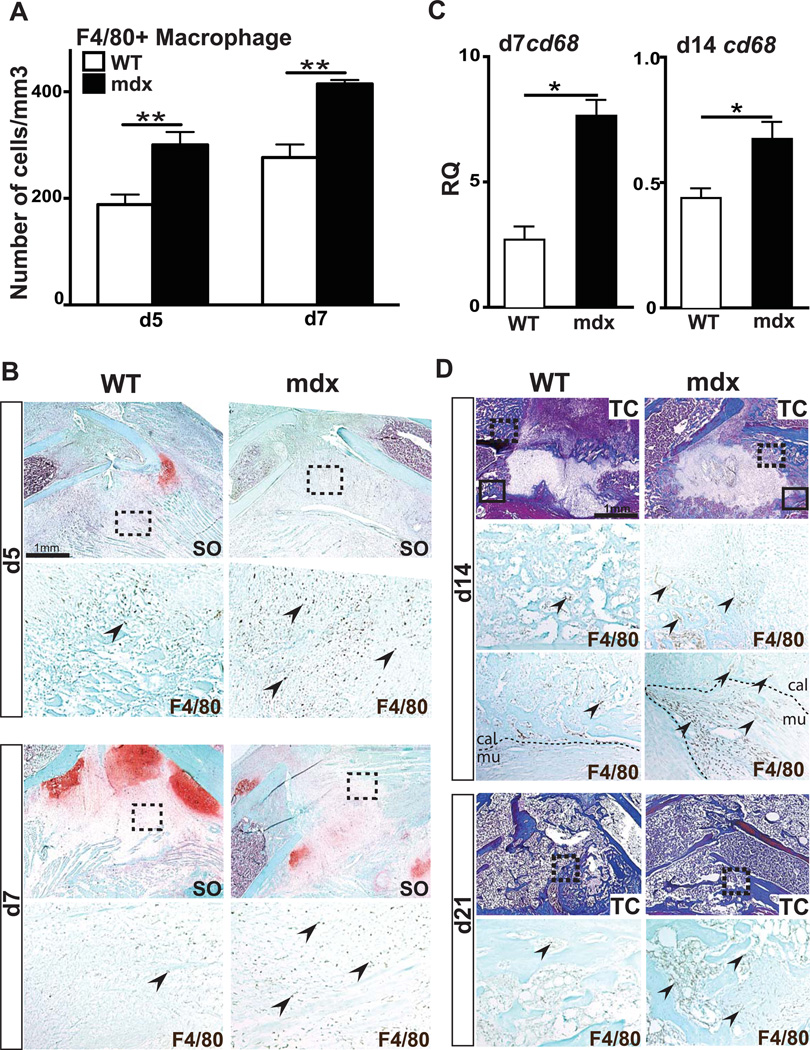
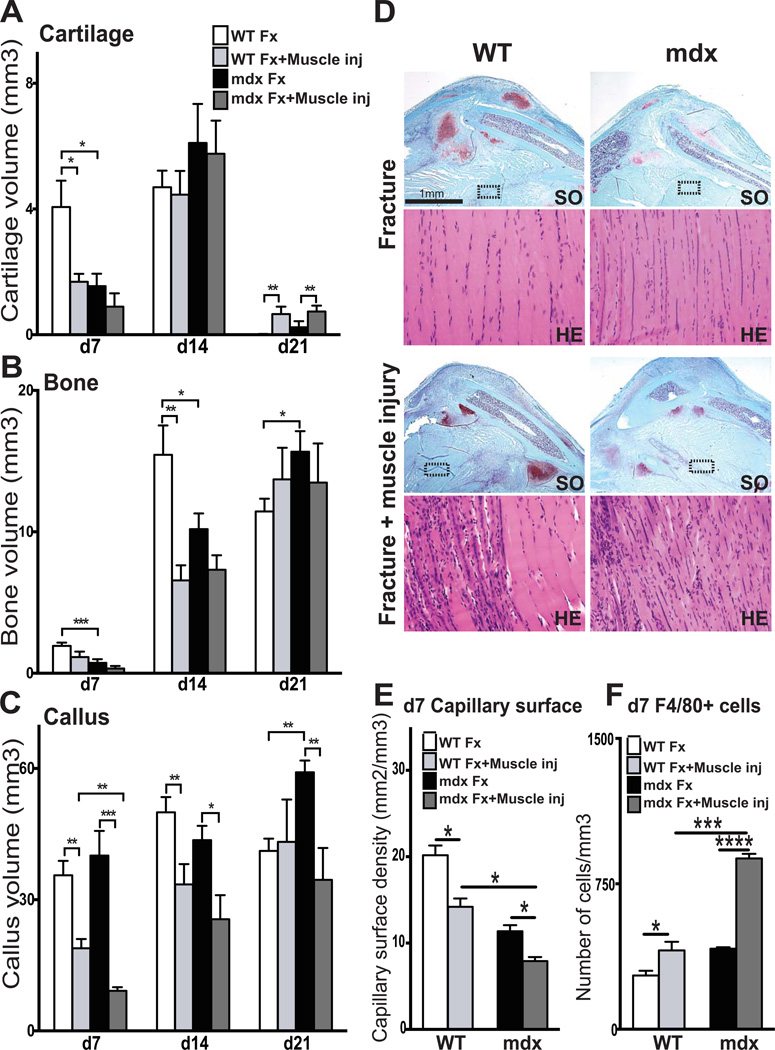
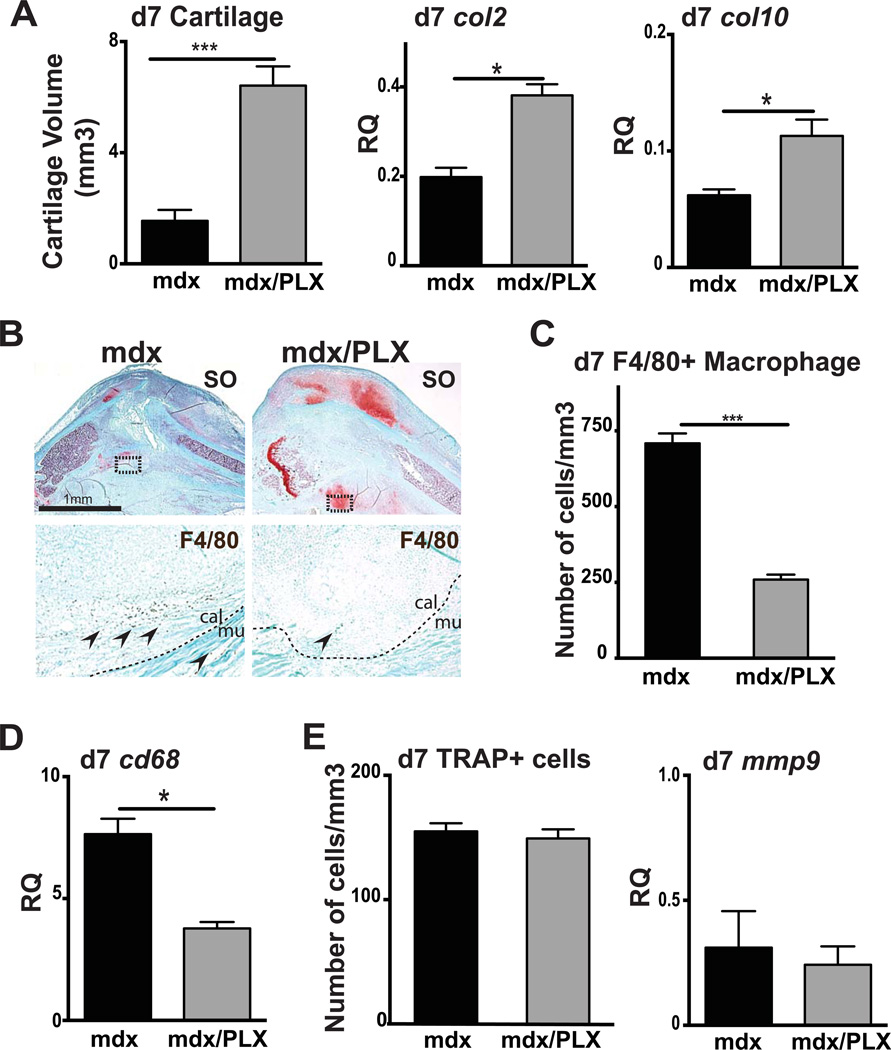
Duchenne muscular dystrophy (DMD) patients exhibit skeletal muscle weakness with continuous cycles of muscle fiber degeneration/regeneration, chronic inflammation, low bone mineral density, and increased risks of fracture. Fragility fractures and associated complications are considered as a consequence of the osteoporotic condition in these patients. Here, we aimed to establish the relationship between muscular dystrophy and fracture healing by assessing bone regeneration in mdx mice, a model of DMD with absence of osteoporosis. Our results illustrate that muscle defects in mdx mice impact the process of bone regeneration at various levels. In mdx fracture calluses, both cartilage and bone deposition were delayed followed by a delay in cartilage and bone remodeling. Vascularization of mdx fracture calluses was also decreased during the early stages of repair. Dystrophic muscles are known to contain elevated numbers of macrophages contributing to muscle degeneration. Accordingly, we observed increased macrophage recruitment in the mdx fracture calluses and abnormal macrophage accumulation throughout the process of bone regeneration. These changes in the inflammatory environment subsequently had an impact on the recruitment of osteoclasts and the remodeling phase of repair. Further damage to the mdx muscles, using a novel model of muscle trauma, amplified both the chronic inflammatory response and the delay in bone regeneration. In addition, PLX3397 treatment of mdx mice, a cFMS (colony stimulating factor receptor 1) inhibitor in monocytes, partially rescued the bone repair defect through increasing cartilage deposition and decreasing the number of macrophages. In conclusion, chronic inflammation in mdx mice contributes to the fracture healing delay and is associated with a decrease in angiogenesis and a transient delay in osteoclast recruitment. By revealing the role of dystrophic muscle in regulating the inflammatory response during bone repair, our results emphasize the implication of muscle in the normal bone repair process and may lead to improved treatment of fragility fractures in DMD patients.

Keywords: ANGIOGENESIS; BONE; CARTILAGE; CHRONIC INFLAMMATION; MACROPHAGE; MUSCLE REGENERATION; MUSCULAR DYSTROPHY; OSTEOCLASTOGENESIS; REGENERATION.


Conflict of interest statement

Disclosures

All authors state that they have no conflicts of interest.

Figures

Figure 1
Figure 1. Effects of muscular dystrophy on tibial fracture repair in mice
Histomorphometric measurements of (A) total cartilage volume, (B) total bone volume and (C) total callus volume at days 7 (d7), 14 (d14), 21 (d21) and 28 (d28) post-fracture in wild type (WT) and mdx mice. (D) Safranin-O (SO) staining of longitudinal sections of WT (left) and mdx (right) callus tissues at day 7 (d7) of bone regeneration illustrate the proteoglycan-containing cartilage (red, D). (E) Relative quantification (RQ) by RTqPCR of collagen 2 (col2) (left) and collagen 10 (col10) (right) mRNA within wild type (WT) and mdx calluses at day 7 (d7). Expression level was normalized to GAPDH mRNA. (F–H) Trichrome (TC) staining of longitudinal sections of WT (left) and mdx (right) callus tissues at (F) day 14 (d14) and (H) day 21 (d21) of bone regeneration denote bone matrix deposition (Blue, F–H). B, bone; Cg, cartilage. (G) Relative quantification (RQ) by RTqPCR of the osteogenic markers collagen 1 (col1) (left) and osteocalcin (oc) (right) mRNA within wild type (WT) and mdx calluses at day 14 (d14). Expression level was normalized to GAPDH mRNA. Error bars represent ±SEM. One-way, two-way ANOVA and unpaired Student’s t test, P values *p<0.05, **p<0.001, ***p<0.0005 (n=5 or 6 per group for histomorphometric analyses; n=3 for gene expression). Scale bar: 1 mm (D), 50 λm (E), 50 λm (F–G).
Figure 2
Figure 2. Effects of muscular dystrophy on vascularization of the fracture callus
(A) Stereological quantification of blood vessels within the callus of wild type (WT) and mdx mice. Blood vessel surface density is significantly decreased in mdx compared to WT mice after 5 (d5) and 7 days (d7) of bone regeneration. (B) Safranin-O (SO) staining and PECAM immunohistochemical staining (arrows, area corresponds to dashed box in SO staining) on adjacent sections of WT and mdx fracture calluses after 5 days (d5) and 7 days (d7) of bone regeneration. Error bars represent ±SEM. Unpaired student’s t test, P values **p<0.001, ***p<0.0005 (n=5 or 6 per group). Scale bar: 1mm, 100 µ (B).
Figure 3
Figure 3. Effects of muscular dystrophy on osteoclasts during fracture repair
(A) Stereological quantification of TRAP+ osteoclasts within wild type (WT) and mdx calluses after 5 days (d5) and 7 days (d7) of bone regeneration. (B) Safranin-O (SO) staining and representative TRAP staining (arrows, area corresponds to dashed box in SO staining) on adjacent sections of WT and mdx fracture calluses at day 5 (d5) and day 7 (d7) of bone regeneration. (C) Relative quantification (RQ) by RTqPCR of matrix metalloproteinase-9 (mmp9) (right) mRNA, marker of osteoclasts, within WT and mdx calluses at day 7 (d7) and day 14 (d14). Expression level was normalized to GAPDH mRNA. (D) Representative TRAP staining in WT and mdx fracture calluses at day 14 (d14) and day 21 (d21) of bone regeneration. Error bars represent ±SEM. Student’s t test, P values *p<0.05, **p<0.001 (n=5 or 6 per group for TRAP staining, n=3 per group for gene expression). Scale bar: 1mm, 100 µ (B).
Figure 4
Figure 4. Effects of muscular dystrophy on macrophage recruitment during fracture repair
(A) Stereological quantification of F4/80+ cells within wild type (WT) and mdx calluses after 5 (d5) and 7 days (d7) of bone regeneration. (B) Safranin-O (SO) staining and representative F4/80 staining (arrows, area corresponds to dashed box in SO) on adjacent sections of WT and mdx calluses at day 5 (d5) and day 7 (d7) of bone regeneration. (C) Relative quantification (RQ) by RTqPCR of cd68 mRNA, marker of macrophages, at days 7 (d7) and 14 (d14) within WT and mdx calluses. Expression level was normalized to GAPDH mRNA. (D) Trichrome (TC) staining and representative F4/80 staining (arrows, area corresponds to dashed box in TC staining) on adjacent sections of WT and mdx fracture calluses at day 14 (d14) and day 28 (d28) of bone regeneration. By d14, there is an increase in F4/80+ macrophages at the interface between callus (cal) and muscle (mu) (arrows, area corresponds to black box in TC staining). Error bars represent ±SEM. Unpaired student’s t test, P values *p<0.05, **p<0.001 (n=5 or 6 per group for F4/80 immunohistochemical staining, n=3 per group for gene expression). Scale bar: 1 mm, 100 µ (B).
Figure 5
Figure 5. Combined effects of muscular dystrophy and muscle injury on fracture repair
Histomorphometric measurements of (A) total cartilage volume, (B) total bone volume and (C) total callus volume at 7 (d7), 14 (d14), 21 (d21) and 28 (d28) days post-injury in wild type (WT) and mdx mice (Fx= Bone Fracture alone; Fx+Muscle inj= Fracture combined with muscle injury). (D) Safranin-O (SO) and Hematoxylin-Eosin (H&E) staining of wild type (WT) and mdx fracture calluses after fracture alone (top) or fracture combined with muscle injury (bottom) at day 7 (d7) post-injury. (E–F) Stereological quantification of blood vessels (E) and F4/80+ macrophages (F) within WT and mdx calluses at day 7 (d7) post fracture (Fx= Bone Fracture alone; Fx+Muscle inj= Fracture combined with muscle injury). Error bars represent ±SEM. ANOVA and unpaired Student’s t test, P values *p<0.05, **p<0.001, ***p<0.0005, ****p<0.0001 (n=5 or 6 per group, n=3 per group for gene expression). Scale bar: 1 mm, 100 µ (D).
Figure 6
Figure 6. Effects of PLX3397 treatment, a cFMs inhibitor, on fracture healing
(A) Histomorphometric measurements of total cartilage volume at 7 days (d7) post-injury in mdx mice (mdx) and PLX3397-treated mdx mice (mdx/PLX) (left). Relative quantification (RQ) by RTqPCR of collagen 2 (col2) (center) and collagen 10 (col10) (right) mRNA within mdx and PLX3397-treated mdx calluses at day 7 (d7) post-fracture. Expression level was normalized to GAPDH mRNA. (B) Safranin-O (SO) staining and representative F4/80 staining (arrows, area corresponds to dashed box in SO staining) on adjacent sections of control mdx and PLX3397-treated mdx fracture callus (mdx/PLX) at day 7 (d7) post-injury. (C) Stereological quantification of F4/80+ cells within mdx and PLX3397-treated mdx calluses (mdx/PLX) after 7 days (d7) of bone regeneration. (D) Relative quantification (RQ) by RTqPCR of cd68 mRNA, marker of macrophages, within mdx and PLX3397-treated mdx calluses (mdx/PLX) at day 7 (d7). Expression level was normalized to GAPDH mRNA. (E) Stereological quantification of TRAP+ cells within mdx and PLX3397-treated mdx calluses (mdx/PLX) after 7 days (d7) of bone regeneration (left). Relative quantification (RQ) by RTqPCR of matrix metallopeptidase-9 (mmp9) mRNA (right), marker of osteoclasts, within mdx and PLX3397-treated mdx calluses (mdx/PLX) at day 7 (d7). Expression level was normalized to GAPDH mRNA. Error bars represent ±SEM. Unpaired Student’s t test, P values *p<0.05, ***p<0.0005 (n=5 or 6 per group, n=3 per group for gene expression). Scale bar: 1 mm, 100 µ (B).

References

    1. Sudkamp NP, Haas NP, Sinnig M, Sottmann G, Tscherne H. [Incidence of pseudarthroses in open fractures: analysis of 948 open fractures] Aktuelle Traumatol. 1993;23(2):59–67. PubMed PMID: 8098572. - PubMed
    1. Yazar S, Lin CH, Lin YT, Ulusal AE, Wei FC. Outcome comparison between free muscle and free fasciocutaneous flaps for reconstruction of distal third and ankle traumatic open tibial fractures. Plastic and reconstructive surgery. 2006;117(7):2468–2475. discussion 76-7.PubMed PMID: 16772958. - PubMed
    1. Evans KD, Oberbauer AM. Alendronate inhibits VEGF expression in growth plate chondrocytes by acting on the mevalonate pathway. Open Orthop J. 2009;3:83–88. Epub 2009/10/17.PubMed PMID: 19834579; PubMed Central PMCID: PMC2761671. - PMC - PubMed
    1. Cairns DM, Uchimura T, Kwon H, Lee PG, Seufert CR, Matzkin E, et al. Muscle cells enhance resistance to pro-inflammatory cytokine-induced cartilage destruction. Biochem Biophys Res Commun. 2010;392(1):22–28. Epub 2010/01/02. PubMed PMID: 20043873; PubMed Central PMCID: PMC2841304. - PMC - PubMed
    1. Einhorn TA. The cell and molecular biology of fracture healing. Clinical Orthopaedics and Related Research. 1998;46(355 Suppl):S7–S21. - PubMed

Publication types

MeSH terms