. 2013 Aug 15;191(4):1692-703.
doi: 10.4049/jimmunol.1201767. Epub 2013 Jul 15.

B cell-specific deficiencies in mTOR limit humoral immune responses

Affiliations

B cell-specific deficiencies in mTOR limit humoral immune responses

Shuling Zhang et al. J Immunol. .

Abstract

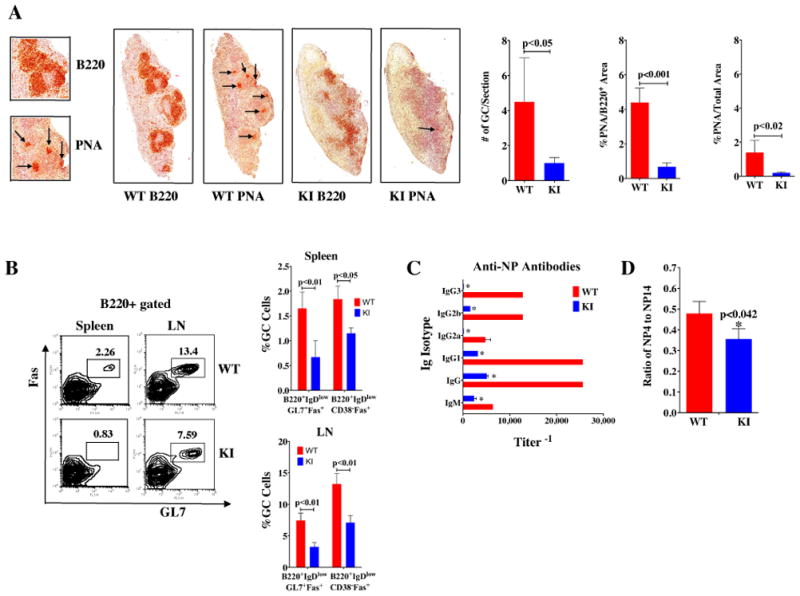
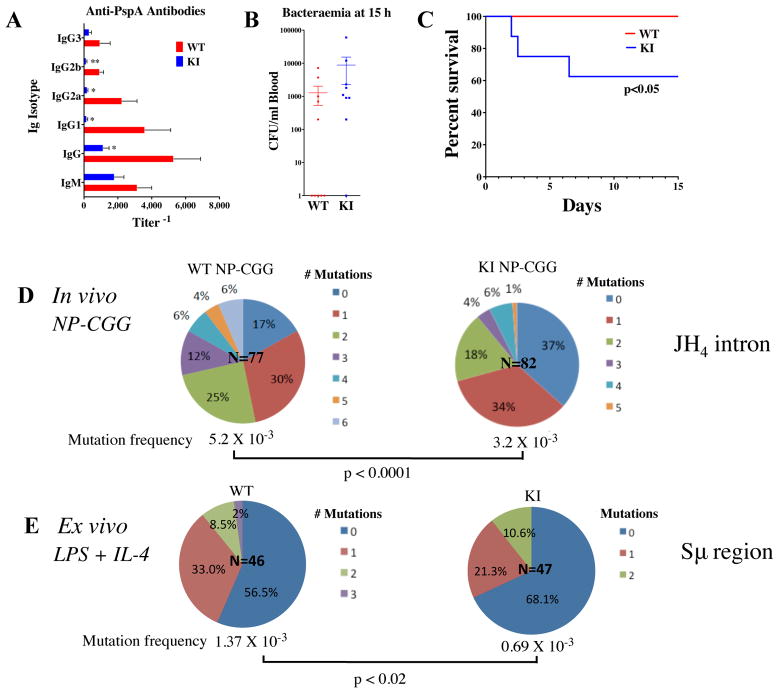
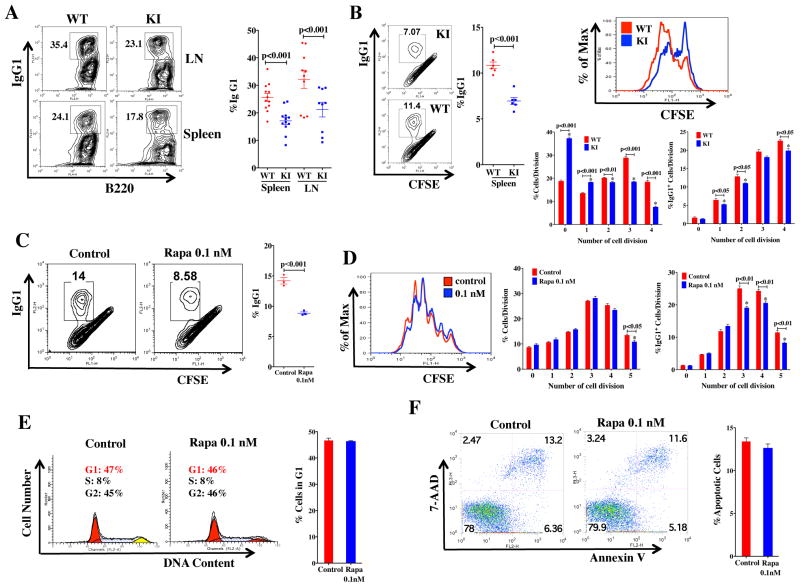
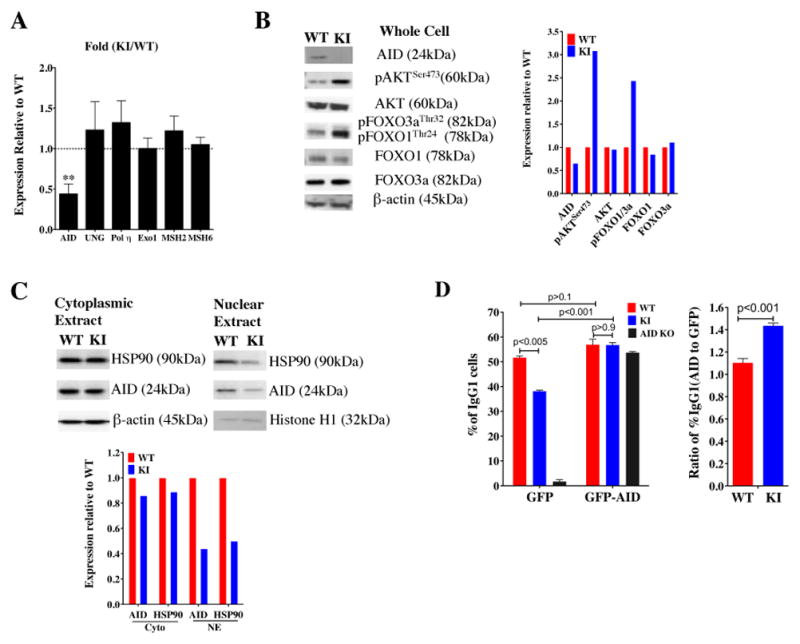
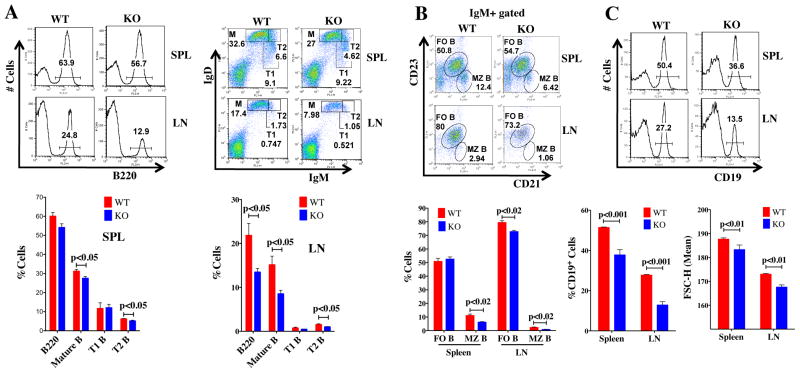
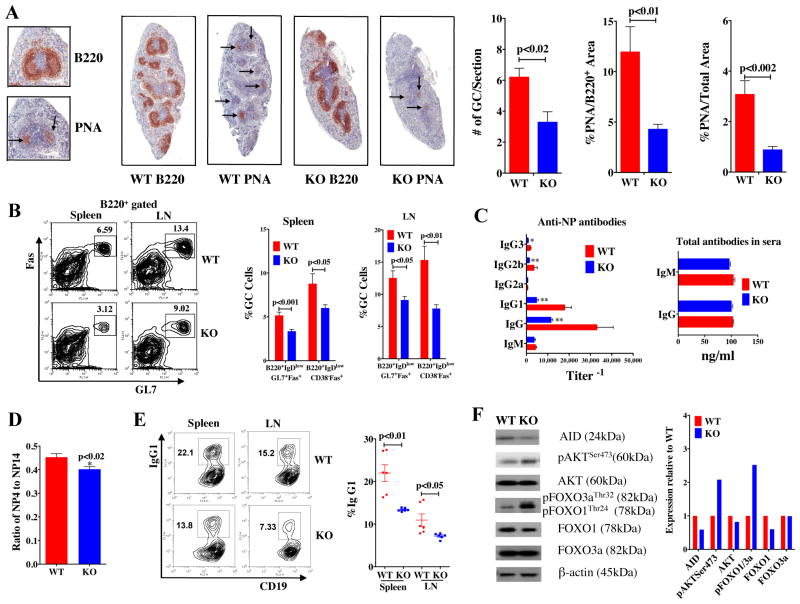
Generation of high-affinity Abs in response to Ags/infectious agents is essential for developing long-lasting immune responses. B cell maturation and Ab responses to Ag stimulation require Ig somatic hypermutation (SHM) and class-switch recombination (CSR) for high-affinity responses. Upon immunization with either the model Ag 4-hydroxy-3-nitrophenylacetyl hapten (NP) conjugated to chicken γ globulin lysine (NP-CGG) or heat-killed Streptococcus pneumoniae capsular type 14 protein (Pn14), knock-in (KI) mice hypomorphic for mTOR function had a decreased ability to form germinal centers, develop high-affinity anti-NP-specific or anti-Pn14-specific Abs, and perform SHM/CSR. Hypomorphic mTOR mice also had a high mortality (40%) compared with wild-type (WT) (0%) littermates and had lower pneumococcal surface protein A-specific Ab titers when immunized and challenged with live S. pneumoniae infection. Mice with mTOR deleted in their B cell lineage (knockout [KO]) also produced fewer splenic germinal centers and decreased high-affinity Ab responses to NP-CGG than did their WT littermates. CSR rates were lower in mTOR KI and KO mice, and pharmacologic inhibition of mTOR in WT B cells resulted in decreased rates of ex vivo CSR. RNA and protein levels of activation-induced cytidine deaminase (AID), a protein essential for SHM and CSR, were lower in B cells from both KI and B cell-specific KO mice, concomitant with increases in phosphorylated AKT and FOXO1. Rescue experiments increasing AID expression in KI B cells restored CSR levels to those in WT B cells. Thus, mTOR plays an important immunoregulatory role in the germinal center, at least partially through AID signaling, in generating high-affinity Abs.


Figures

Figure 1
Figure 1. Constitutive reductions in mTOR impair GC formation and decrease anti-NP antibodies in response to NP-CGG
KI and WT (n = 5/group) mice were immunized i.p. with NP-CGG in Rehydragel. Spleens were collected on day 14 for IHC staining and FACS analysis. A) Splenic sections were stained with B220 or PNA. The numbers of GCs and the area of PNA staining was evaluated from scans of spleen sections stained with B220 or PNA using color deconvolution analysis software (Aperio Technologies). B) The cells from spleens and lymph nodes (LN) were stained with B220, GL7, Fas, CD38, and IgD antibodies. There were fewer GC B cells in KI than WT. Data are presented as mean ± SEM; p-values are indicated. C) Sera from KI and WT mice immunized with NP-CGG were collected on day 14 for measurement of Ag-specific IgM and IgG isotype antibody titers. Data are presented as mean ± SEM: *significance p<0.01. D) The relative affinities of anti-NP Abs were determined using an ELISA with BSA coupled to NP at different ratios, namely, NP4-BSA and NP14-BSA.
Figure 2
Figure 2. Prior challenge of mTOR hypomorphic KI mice does not protect them from challenge with live Streptococcus pneumoniae (Pn14)
mTOR KI mice (n = 9) and wild-type littermates (n = 10) were immunized with 1–5×10⁶ CFU live Pn14 and challenged at d14 with 1×10⁸ CFU live Pn14/mouse. A) At day 14 before high dose challenge, KI mice had lower anti-IgG responses (*p<0.05, **p <0.01) than WT mice, B) 15 hours after high dose challenge, more KI mice were bacteremic than WT mice and C) 14 days after high dose challenge, KI mice had a higher rate of mortality than WT mice (p<0.05). The proportions of Ig sequences from WT and KI mice with defined numbers of mutations D,E) were determined. D) Somatic hypermutation (SHM) frequency in immunoglobulin JH 4 intron (Ig-JH4) sequences from WT and KI GC (B220+GL7+Fas+) splenic B cells isolated directly from mice immunized with NP-CGG. E) Mutation frequency in immunoglobulin switch μ (Sμ) region from WT and KI splenic CD43 resting B cells stimulated ex vivo with LPS and IL-4 for 120 hrs (IgG1 induction). The number highlighted in the center of the chart is the total number of sequences analyzed.
Figure 3
Figure 3. CSR frequency in mTOR hypomorphs and rapamycin treated WT cells
A) CD43 resting B cells purified from spleens and LNs of KI and WT mice (age 5–12 wks) were stimulated with LPS and IL4 for 72 hours and cells were stained with B220 and IgG1 antibodies (n=9 for LNs, n=12 for spleens). B) CD43 cells from spleens of KI and WT mice (age 8–10 wks) were stained with CFSE, and then stimulated with LPS plus IL-4 (IgG1 induction) for 72 hours. The cells were stained with IgG1 (n = 6 samples) antibody and analyzed with FACS and FlowJo. Percentages of total cell number and IgG1+ cells in each division are presented. C–F) Rapamycin decreases CSR in CD43 B cells from wild-type mice. CD43 resting B cells purified from spleens of WT mice were stimulated (≥ 72hrs) with LPS and IL-4 to induce IgG1 switching over time (≥ 72hrs). C, D) Purified CD43 resting B cells were stained with CFSE, and then stimulated with LPS and IL-4. The cells were stained with IgG1 antibody. Cell proliferation was analyzed with CFSE staining (D), and percentages of total cell number and IgG1+ cells in each division are presented. FACS analyses were performed with PI-staining for cell cycle (E) or Annexin V and 7AAD staining for apoptosis (F) in CD43− resting B cells induced to switch to IgG1. Representative experiments are shown from two of three replicates (n=3). Cells were analyzed with FACS and FlowJo and data are presented as mean ± SEM; *significance p values (p<0.05) are indicated.
Figure 4
Figure 4. AID expression is lower in mTOR hypomorphic KI mice
A) CD43 resting B cells from WT and KI spleens were stimulated with LPS and IL4 for 48 hours. mRNA expression of AID, UNG, Polη, ExoI, MSH2, and MSH6 were measured by real-time PCR. The results are displayed as relative fold changes of mRNA expression in KI compared with WT, upon normalization by 18S RNA (mean ± SD, n = 3). B) Western blots of AID signaling in CD43 resting B cells from WT and KI spleens stimulated with LPS and IL4 for 48 hours. C) Nuclear protein levels of HSP90 and its client protein, AID are lower in CD43 resting B cells from KI spleens stimulated with LPS and IL-4 for 48 hours. The fold change was normalized to the WT protein level, after normalization by β-actin. Western blots were repeated in at least two experiments. D) CD43 resting B cells isolated from spleens of WT or KI mice were infected with retroviruses expressing AID-GFP or GFP, and stimulated with LPS and IL-4 for 72 hours. CSR was measured by IgG1 cell surface expression. The percentage or ratio of IgG1+ cells from AID-GFP to GFP retrovirus infection was calculated in GFP+ cells. AID-KO mice were included as controls. Two independent experiments were in agreement.
Figure 5
Figure 5. B cell subpopulations are altered in the lymph node and spleens of B-cell specific KO mice
A,B) Cells isolated from spleens and LNs of WT and KO mice were stained with antibodies to B220, CD23, and CD21, IgM and IgD. Flow cytometry analyses revealed that B cell subpopulations (mature, transitional T2, follicular and marginal zone B cells) were decreased in KO tissues. Stages of B cells were identified by the following cell surface markers: M: mature B cells (IgDhighCD21+IgMB220+); T: transitional B cells (T1: B220+IgDIgMhigh; T2: B220+IgDhighIgMhigh); follicular B cells (FO B: IgMlowIgDhighCD21intCD23+); marginal zone B cells (MZ B: IgMhighIgDlowCD21highCD23). The age of the mice ranged from 8 to 12 weeks (n= 8). C) The percentage and size of CD19+ B cells in KO mice. D) FACs analysis of cells from spleens and lymph nodes (LN) stained with B220, GL7, Fas, CD38, and IgD antibodies. There were fewer GC B cells in KO than WT mice following NP-CGG priming. Data are presented as mean ± SEM; p-values are indicated.
Figure 6
Figure 6. mTOR KO in CD19+ B cells impairs GC formation and decreases anti-NP antibody response to NP-CGG
KO (n=7) and WT (n = 5) mice were immunized i.p. with NP-CGG in Rehydragel. Spleens were collected on day 14 for IHC staining. A) Splenic sections were stained with B220 and PNA. The numbers of GCs and the area of PNA staining were evaluated from scans of spleen sections stained with B220 or PNA using color deconvolution analysis software (Aperio Technologies). B) FACs analysis of cells from spleens (SPL) and lymph nodes (LN) stained with B220, GL7, Fas, CD38 and IgD antibodies. C) Sera from KO and WT mice immunized with NP-CGG were collected on day 14 for measurement of Ag-specific IgM and IgG isotype antibody titers. Data are presented as mean ± SEM: significance * p<0.05 and ** p<0.01. D) The relative affinities of anti-NP Abs were determined using an ELISA with BSA coupled to NP at different ratios, namely, NP4-BSA and NP14-BSA. E) CD43 resting B cells purified from spleens and LNs of KO and WT mice (age 8–10 wks) were stimulated with LPS and IL-4 for 72 hours and cells were stained with CD19 and IgG1 antibodies (n=6). The cells were analyzed with FACS and FlowJo. Data are presented as mean ± SEM; p-values are indicated. F) CD43 CD19+ resting B cells from WT and KO LNs were stimulated with LPS and IL4 for 48 hours. WB analyses of protein expression in KO relative to WT mice. AID expression levels were lower while pAKTSer473 and pFOXO1Thr24 levels were higher in KI or KO mice relative to WT.

References

    1. Laplante M, Sabatini DM. mTOR signaling at a glance. J Cell Sci. 2009;122:3589–3594. - PMC - PubMed
    1. Zoncu R, Efeyan A, Sabatini DM. mTOR: from growth signal integration to cancer, diabetes and ageing. Nat Rev Mol Cell Biol. 2011;12:21–35. - PMC - PubMed
    1. Cutler C, Antin JH. Sirolimus for GVHD prophylaxis in allogeneic stem cell transplantation. Bone Marrow Transplant. 2004;34:471–476. - PubMed
    1. Xu X, Ye L, Araki K, Ahmed R. mTOR, linking metabolism and immunity. Semin Immunol. 2012;24:429–435. - PMC - PubMed
    1. Saemann MD, Remuzzi G. Time to rethink immunosuppression by mTOR inhibitors? Nature Reviews. 2009;5:611–612. - PubMed

Publication types

MeSH terms