

doi: 10.1212/WNL.0b013e31829bfe89.
Mitochondrial encephalomyopathies--fifty years on: the Robert Wartenberg Lecture
Affiliations
- PMID: 23858410
- PMCID: PMC3959764
- DOI: 10.1212/WNL.0b013e31829bfe89
Item in Clipboard
Mitochondrial encephalomyopathies--fifty years on: the Robert Wartenberg Lecture
Neurology.
.
No abstract available
Conflict of interest statement
The author reports no disclosures relevant to the manuscript. Go to
Figures
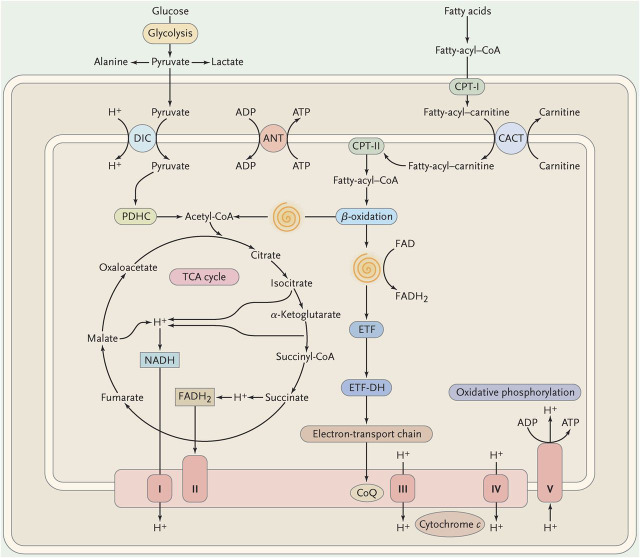
The spirals represent the cyclic reactions of the β-oxidation pathway resulting in the formation of acetyl-coenzyme A (CoA) and the reduction of flavoprotein. ADP = adenosine diphosphate; ATP = adenosine triphosphate; ANT = adenine nucleotide translocase; CACT = carnitine-acylcarnitine translocase; CoQ = coenzyme Q; CPT = carnitine palmitoyltransferase; DIC = dicarboxylate carrier; ETF = electron-transfer flavoprotein; ETF-DH = electron-transfer flavoprotein dehydrogenase; FAD = flavin adenine-dinucleotide; FADH = reduced flavin adenine-dinucleotide; NADH = reduced nicotinamide adenine dinucleotide; PDHC = pyruvate dehydrogenase complex; TCA = tricarboxylic acid; I = complex I; II = complex II; III = complex III; IV = complex IV; V = complex V. (Modified with permission from DiMauro and Schon, New England Journal of Medicine 2003;348:2656–2668.)
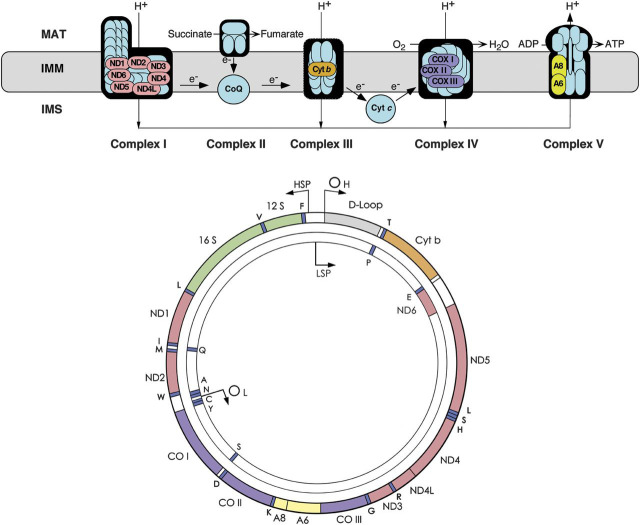
Genes and corresponding gene products are similarly color-coded. ND denotes the subunits of NADH-coenzyme Q oxidoreductase (complex I); cyt b = cytochrome b; subunits of cytochrome c oxidase are labeled CO in the mtDNA scheme and COX in the respiratory chain rendition; A6 and A8 indicate subunits 6 and 8 of ATP synthase. The 22 tRNA genes are denoted by one-letter amino acid nomenclature; 12S and 16S denote ribosomal RNAs (rRNAs). OH and OL are the origin of heavy- and light-strand replication; HSP and LSP are the promoters of heavy- and light-strand transcription. ADP = adenosine diphosphate; ATP = adenosine triphosphate; IMM = inner mitochondrial membrane; IMS = intermembrane space; MAT = mitochondrial matrix.
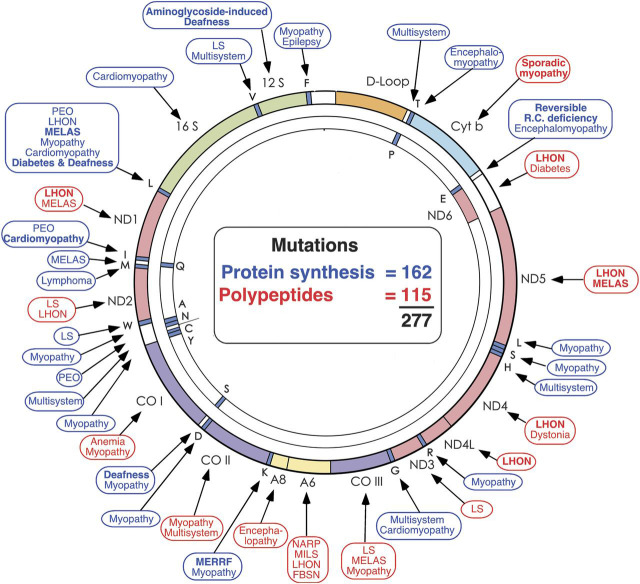
Disorders caused by mutations in protein-coding genes are shown in red; disorders caused by mutations in genes controlling protein synthesis are shown in blue. FBSN = familial bilateral striatal necrosis; LHON = Leber hereditary optic neuropathy; LS = Leigh syndrome; MELAS = mitochondrial encephalomyopathy, lactic acidosis, and strokelike episodes; MERRF = myoclonus epilepsy and ragged-red fibers; MILS = maternally inherited Leigh syndrome; NARP = neuropathy, ataxia, retinitis pigmentosa; PEO = progressive external ophthalmoplegia. (Modified with permission from DiMauro and Schon, New England Journal of Medicine 2003;348:2656-2668.)
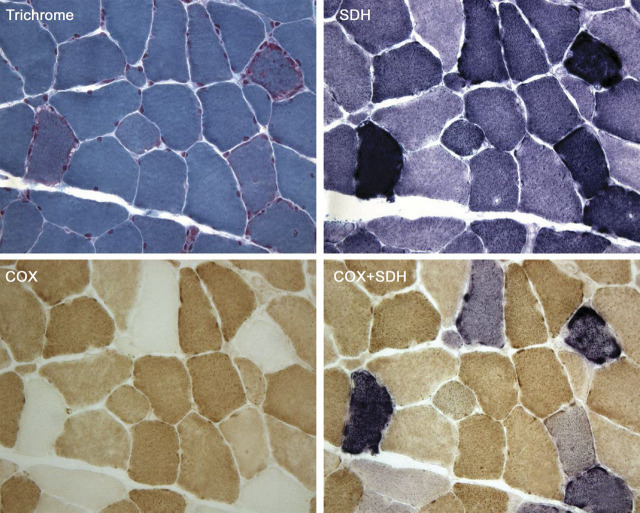
The modified Gomori trichrome shows classic ragged-red fibers, which stain intensely with the succinate dehydrogenase (SDH) stain (“ragged-blue”) and appear pale with the cytochrome c oxidase (COX) stain. The same fibers appear more or less intensely blue when the SDH and COX stain are superimposed.
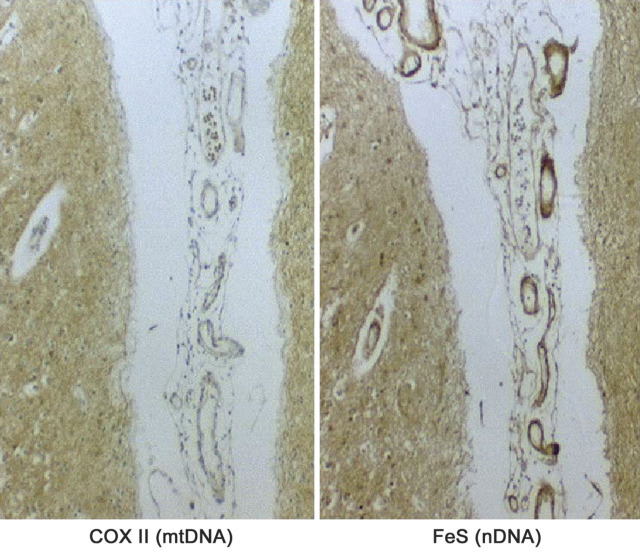
(Reprinted with permission from Tanji et al., Semin Cell Dev Biol 2001;12:429-439.)
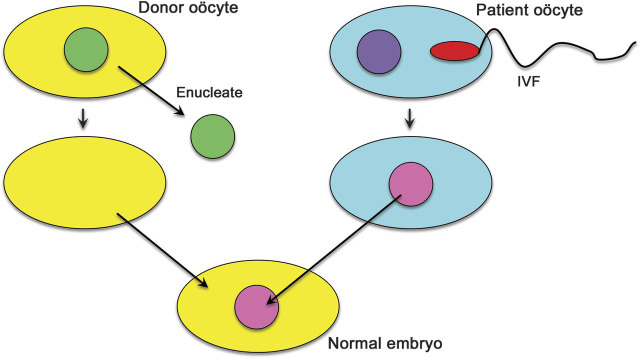
For explanation, see text.
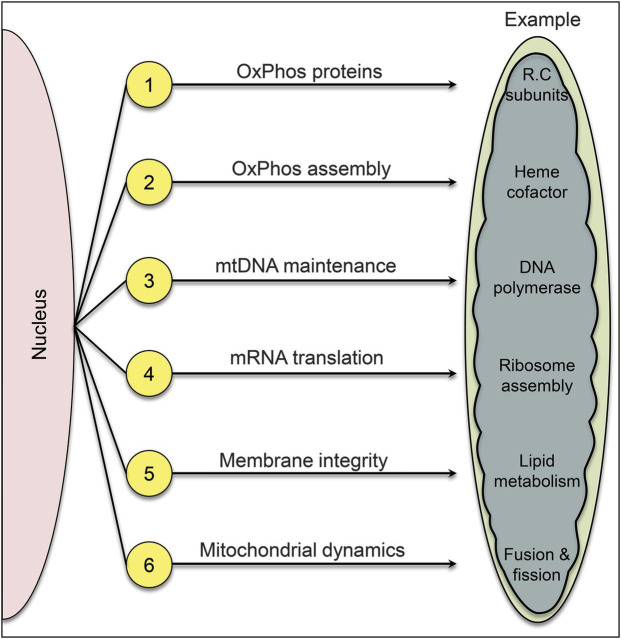
1, “Direct hits”; 2, “indirect hits”; 3, defects of intergenomic communication resulting in mitochondrial DNA depletion and multiple mitochondrial DNA deletions; 4, defects of mRNA translation; 5, defects of the inner mitochondrial membrane phospholipid milieu; 6, defects of mitochondrial dynamics.
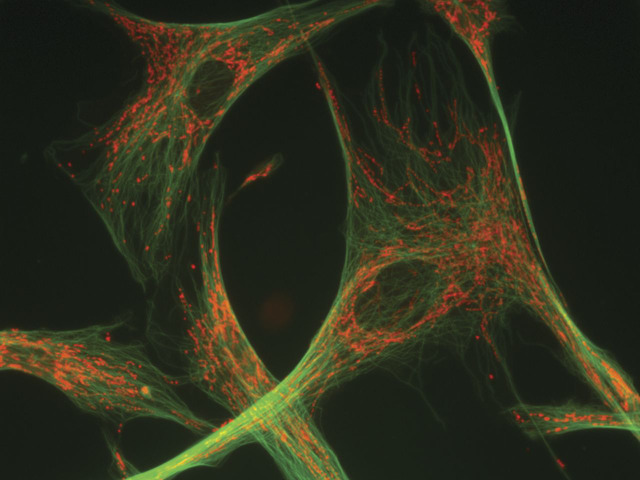
Courtesy of Dr. Estela Area-Gómez.
Comment in
-
Mitochondrial encephalomyopathies--fifty years on: the Robert Wartenberg Lecture.Neurology. 2014 Feb 18;82(7):643-4. doi: 10.1212/01.wnl.0000444333.07261.53. Neurology. 2014. PMID: 24536065 No abstract available.
-
Author response.Neurology. 2014 Feb 18;82(7):644. Neurology. 2014. PMID: 24745040 No abstract available.
References
-
- Rowland LP. Molecular genetics, pseudogenetics, and clinical neurology. Neurology 1983;23:1179–1195. - PubMed
-
- Holt IJ, Harding AE, Morgan Hughes JA. Deletions of muscle mitochondrial DNA in patients with mitochondrial myopathies. Nature 1988;331:717–719. - PubMed
-
- Wallace DC, Singh G, Lott MT, et al. . Mitochondrial DNA mutation associated with Leber's hereditary optic neuropathy. Science 1988;242:1427–1430. - PubMed
-
- Sagan L. On the origin of mitosing cells. J Theor Biol 1967;14:255–274. - PubMed
Publication types
MeSH terms
Grants and funding
LinkOut - more resources
Full Text Sources
Other Literature Sources