. 2013 Sep;163(1):205-15.
doi: 10.1104/pp.113.223511. Epub 2013 Jul 15.

Transcriptional dynamics of two seed compartments with opposing roles in Arabidopsis seed germination

Affiliations

Transcriptional dynamics of two seed compartments with opposing roles in Arabidopsis seed germination

Bas J W Dekkers et al. Plant Physiol. 2013 Sep.

Abstract

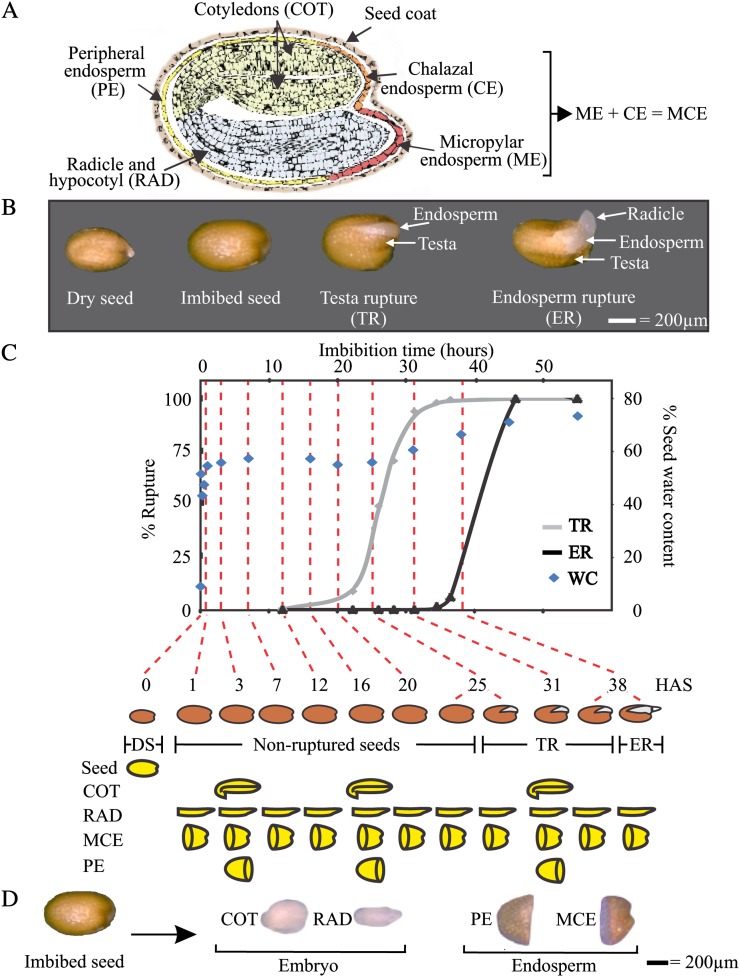
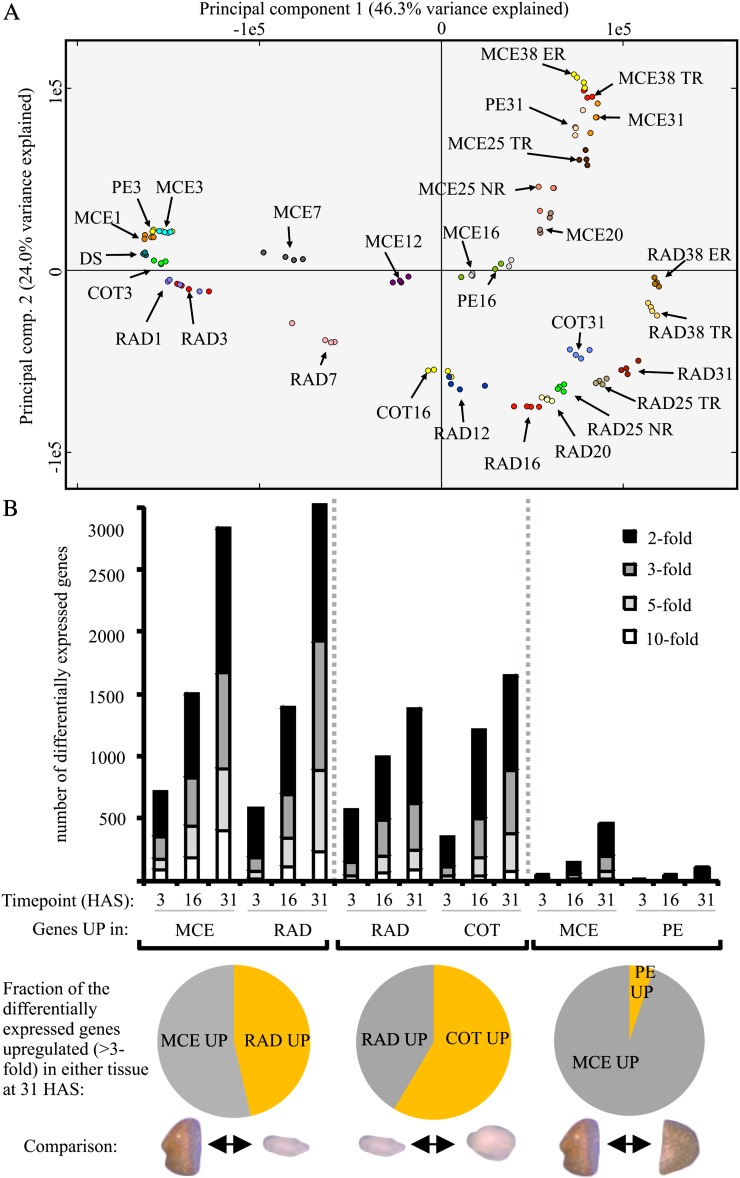
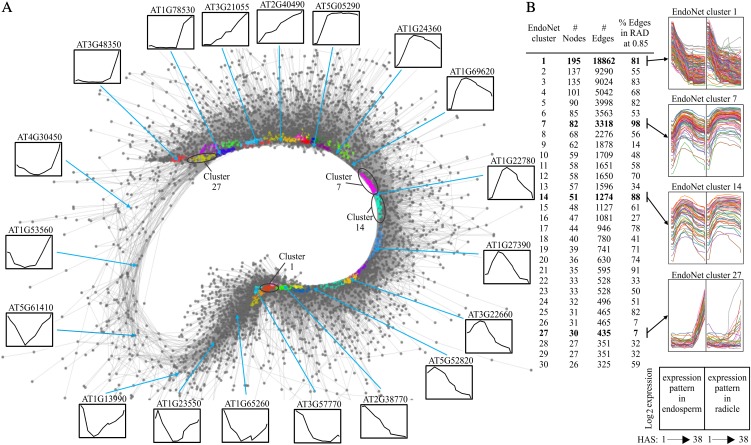
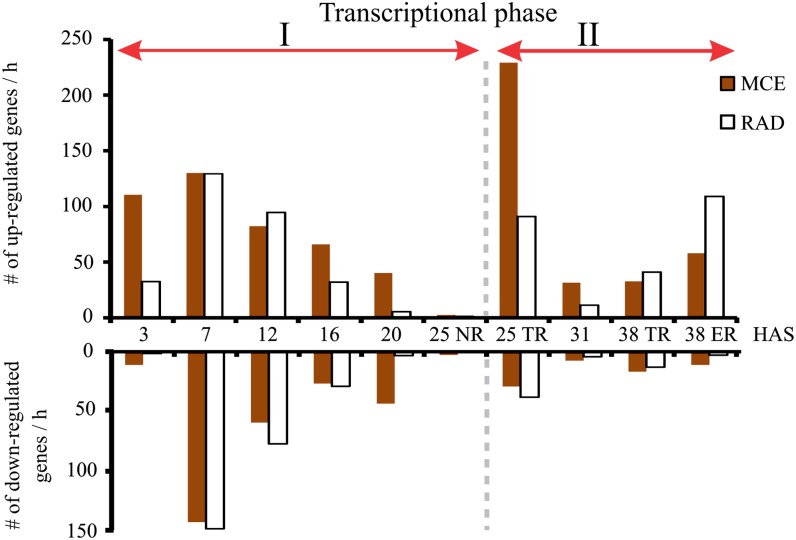
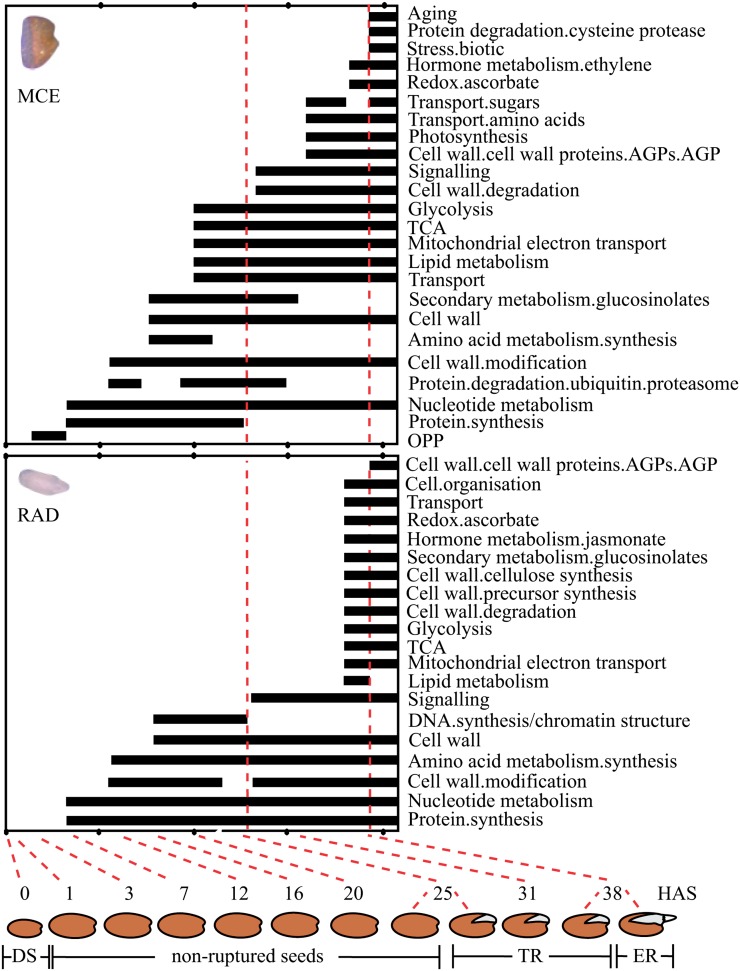
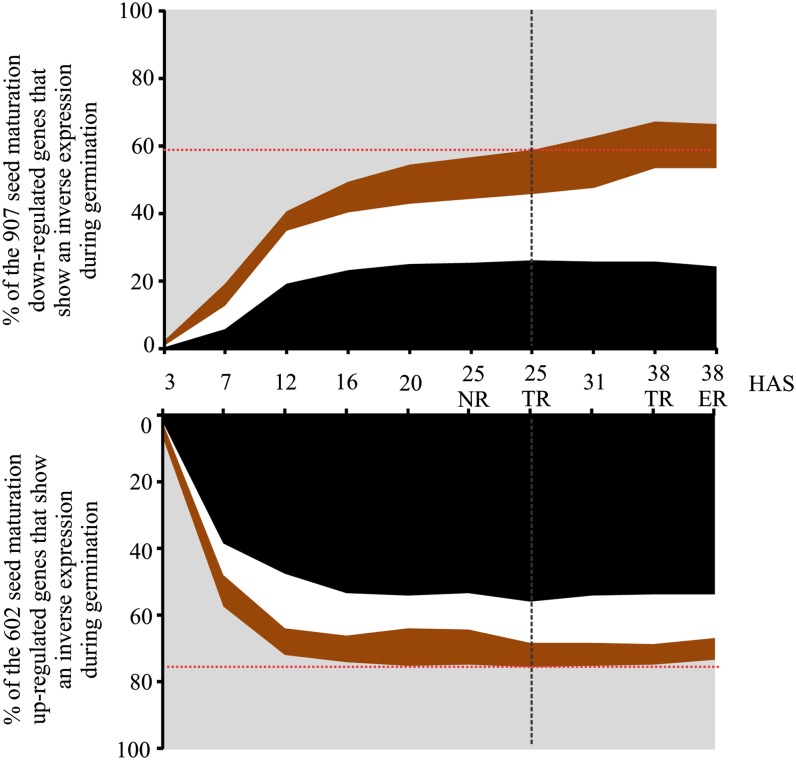
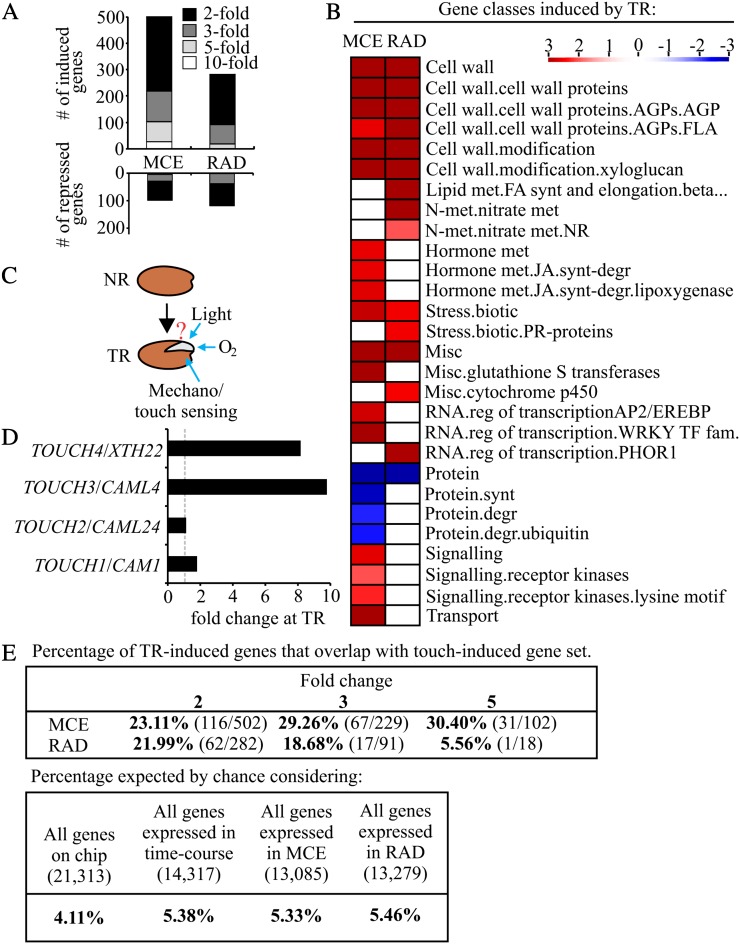
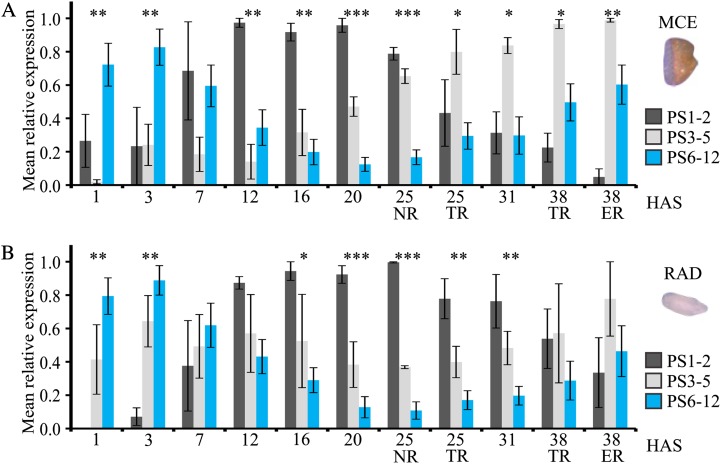
Seed germination is a critical stage in the plant life cycle and the first step toward successful plant establishment. Therefore, understanding germination is of important ecological and agronomical relevance. Previous research revealed that different seed compartments (testa, endosperm, and embryo) control germination, but little is known about the underlying spatial and temporal transcriptome changes that lead to seed germination. We analyzed genome-wide expression in germinating Arabidopsis (Arabidopsis thaliana) seeds with both temporal and spatial detail and provide Web-accessible visualizations of the data reported (vseed.nottingham.ac.uk). We show the potential of this high-resolution data set for the construction of meaningful coexpression networks, which provide insight into the genetic control of germination. The data set reveals two transcriptional phases during germination that are separated by testa rupture. The first phase is marked by large transcriptome changes as the seed switches from a dry, quiescent state to a hydrated and active state. At the end of this first transcriptional phase, the number of differentially expressed genes between consecutive time points drops. This increases again at testa rupture, the start of the second transcriptional phase. Transcriptome data indicate a role for mechano-induced signaling at this stage and subsequently highlight the fates of the endosperm and radicle: senescence and growth, respectively. Finally, using a phylotranscriptomic approach, we show that expression levels of evolutionarily young genes drop during the first transcriptional phase and increase during the second phase. Evolutionarily old genes show an opposite pattern, suggesting a more conserved transcriptome prior to the completion of germination.


Figures

Figure 1.
Figure 1.
Seed compartments and seed germination kinetics of Arabidopsis seeds. A, A section through an Arabidopsis seed depicting the different seed compartments. B, Different stages during seed germination including TR (which exposes the underlying endosperm layer) and ER (also known as RAD protrusion or germination sensu stricto). C, Arabidopsis seed germination analyzed by measuring TR (gray line), ER (black line), and seed water content (WC; blue diamonds). Below the graph, the time points and physiological stages (dry, NR, TR, and ER) are indicated for each sample. The 29 samples that were analyzed are schematically shown below the germination graph by the yellow pictograms. D, The four seed sections that were used for transcriptome analysis.
Figure 2.
Figure 2.
Transcriptional differences between seed compartments. A, PCA of the 116 samples. The four replicates of all 29 samples are indicated by color. B, Tissue differences are represented by the number of differentially expressed genes at three time points during imbibition (3, 16, and 31 HAS, the time points in which all four tissues were sampled). Comparisons were made between endosperm and embryo (MCE versus RAD), between embryo tissues (RAD versus COT), and between both endosperm samples (MCE versus PE). The bars show the number of differentially expressed genes at a 2-, 3-, 5-, and 10-fold cutoff. The pie diagrams below the graph indicate the fraction of the total number of differentially expressed genes (at a 3-fold cutoff level) in either of the two tissues that were compared at 31 HAS.
Figure 3.
Figure 3.
The endosperm coexpression network, EndoNet. A, Sample layout of EndoNet. The nodes (genes) are indicated by gray circles, and edges (gray lines) are drawn between two nodes if their correlation of expression is above 0.932. The 30 largest clusters are indicated by different colors. To visualize the gene expression profiles captured in the network, the expression profiles of exemplar genes are shown around the network. B, Details of the largest 30 clusters are shown, including the number of nodes, edges, and the percentage of edges that are shared with RadNet (at a cutoff of 0.85). The expression profiles of genes in the EndoNet clusters 1, 7, 12, and 27 are shown (the positions of these clusters in EndoNet are shown A). The right side of the graph depicts the expression profiles of the same set of genes in the RAD samples.
Figure 4.
Figure 4.
Arabidopsis seed germination is characterized by two transcriptional phases. The number of differentially expressed genes (both up- and down-regulated) between consecutive time points (3 was compared with 1, 7 with 3, 12 with 7, etc.) in the MCE (white bars) and RAD (brown bars) with a reasonable fold change (taking a 3-fold difference as the cutoff) are presented. The two transcriptional phases, phase I from 1 to 25 HAS NR and phase II from 25 HAS NR to 38 HAS ER, are indicated by the red arrows.
Figure 5.
Figure 5.
Temporal differences between endosperm and embryo using ORA. The overrepresented gene categories of the up-regulated genes of the germination time course (all time points were compared with 1 HAS) were identified in the MCE (top graph) and the RAD (bottom graph) using PageMan (Usadel et al., 2006). Selected categories are summarized in the graphs, and black bars show the time points during germination at which the indicated gene categories are overrepresented. OPP, Oxidative pentose phophate pathway.
Figure 6.
Figure 6.
Inverse expression of seed maturation genes during germination in temporal and spatial detail. The top panel shows the percentage of up-regulated genes during germination among a set of 907 genes that are down-regulated during seed maturation. The bottom panel shows the percentage of down-regulated genes during germination among a set of 602 genes that are up-regulated during seed maturation. Genes expressed specifically in the MCE (in brown), in the RAD (in white), and in both (in black) are indicated.
Figure 7.
Figure 7.
Genes induced with respect to TR show a large overlap with touch-induced signaling. A, Number of differentially expressed genes at 25 HAS TR (compared with 25 HAS NR) in the MCE and RAD at different fold change cutoffs. B, Gene classes overrepresented in the TR-induced gene sets in the MCE and RAD. C, Schematic presentation of effectors that could be responsible for the large gene expression changes observed at TR. D, Expression behavior of four TOUCH genes at TR in the MCE. E, Table shows the percentage of the TR up-regulated genes in the MCE and the RAD (at 2-, 3-, and 5-fold cutoff) that overlap with the 934 touch up-regulated genes. The percentage expected by chance is indicated using the number of genes present on the chip, genes expressed in the germination time course, genes expressed in the MCE, and genes expressed in the RAD. degr, Degradation; FA, fatty acid; fam, family; FLA, fasciclin-like arabinogalactan; JA, jasmonic acid; met, metabolism; misc, miscellaneous; NR, non-ruptured; PR, pathogenesis-related; reg, regulation; synt, synthesis; TF, transcription factor.
Figure 8.
Figure 8.
Relative expression of evolutionarily old and young genes across the Arabidopsis germination time course. Plotted are the relative expression levels ± se of genes of PS1 and PS2, PS3 to PS5, and PS6 to PS12 across the Arabidopsis germination time course in the MCE (A) and RAD (B) compartments. The significance between the relative expression levels between the groups is indicated at each time point by asterisks: *P < 0.05, **P < 0.01, ***P < 0.001. For the phylostratigraphic map and the mean relative expression of individual phylostrata, see Supplemental Figure S9.

References

    1. Bassel GW, Lan H, Glaab E, Gibbs DJ, Gerjets T, Krasnogor N, Bonner AJ, Holdsworth MJ, Provart NJ. (2011) Genome-wide network model capturing seed germination reveals coordinated regulation of plant cellular phase transitions. Proc Natl Acad Sci USA 108: 9709–9714 - PMC - PubMed
    1. Belmonte MF, Kirkbride RC, Stone SL, Pelletier JM, Bui AQ, Yeung EC, Hashimoto M, Fei J, Harada CM, Munoz MD, et al. (2013) Comprehensive developmental profiles of gene activity in regions and subregions of the Arabidopsis seed. Proc Natl Acad Sci USA 110: E435–E444 - PMC - PubMed
    1. Bethke PC, Libourel IG, Aoyama N, Chung YY, Still DW, Jones RL. (2007) The Arabidopsis aleurone layer responds to nitric oxide, gibberellin, and abscisic acid and is sufficient and necessary for seed dormancy. Plant Physiol 143: 1173–1188 - PMC - PubMed
    1. Braam J. (2005) In touch: plant responses to mechanical stimuli. New Phytol 165: 373–389 - PubMed
    1. Breeze E, Harrison E, McHattie S, Hughes L, Hickman R, Hill C, Kiddle S, Kim YS, Penfold CA, Jenkins D, et al. (2011) High-resolution temporal profiling of transcripts during Arabidopsis leaf senescence reveals a distinct chronology of processes and regulation. Plant Cell 23: 873–894 - PMC - PubMed

Publication types

Substances