. 2013 Jul 30;110(31):12643-8.
doi: 10.1073/pnas.1310212110. Epub 2013 Jul 15.

Clonal precursor of bone, cartilage, and hematopoietic niche stromal cells

Affiliations

Clonal precursor of bone, cartilage, and hematopoietic niche stromal cells

Charles K F Chan et al. Proc Natl Acad Sci U S A. .

Abstract

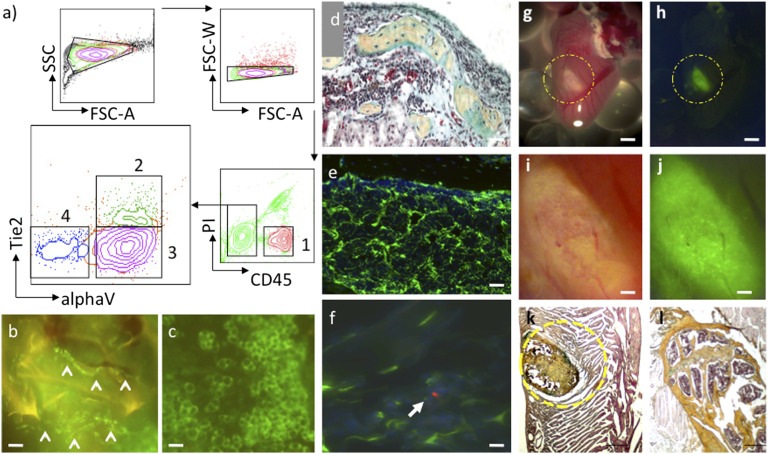
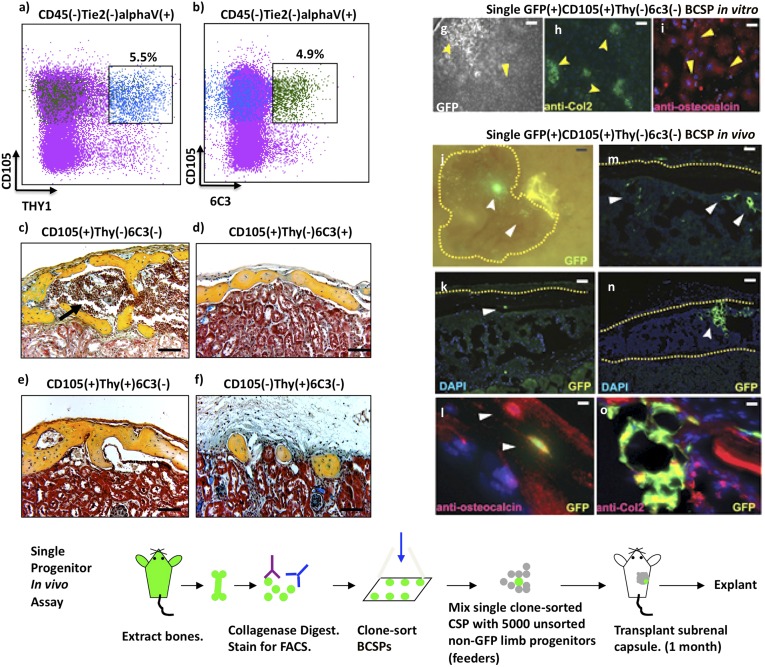
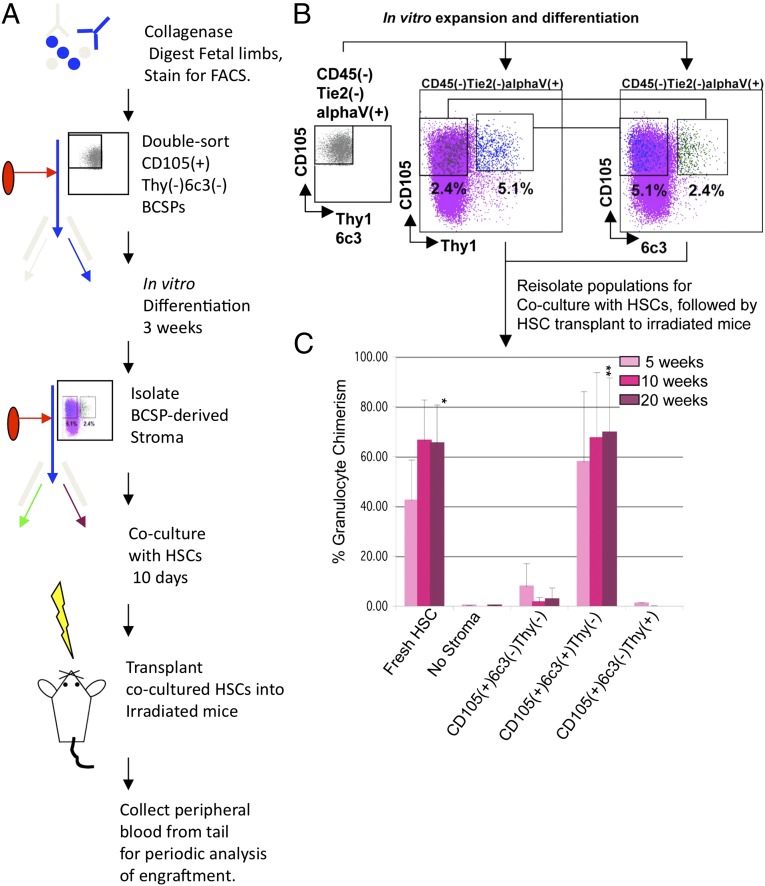
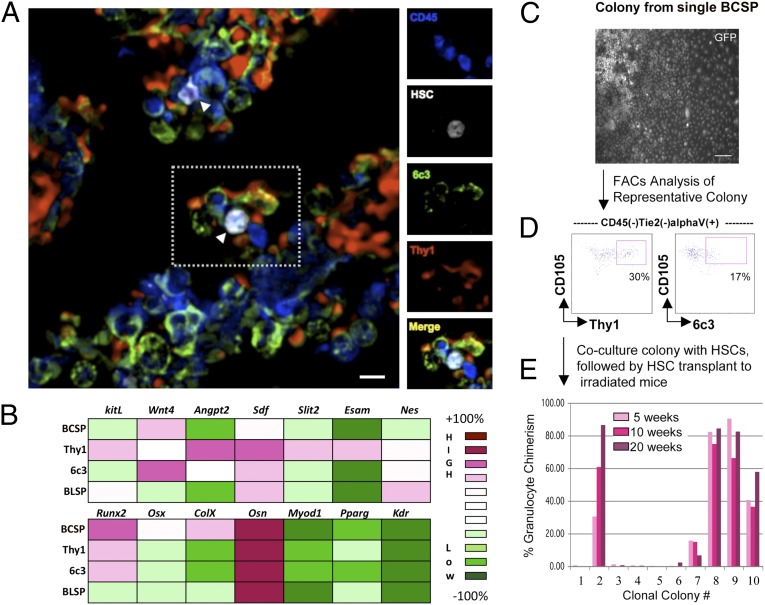
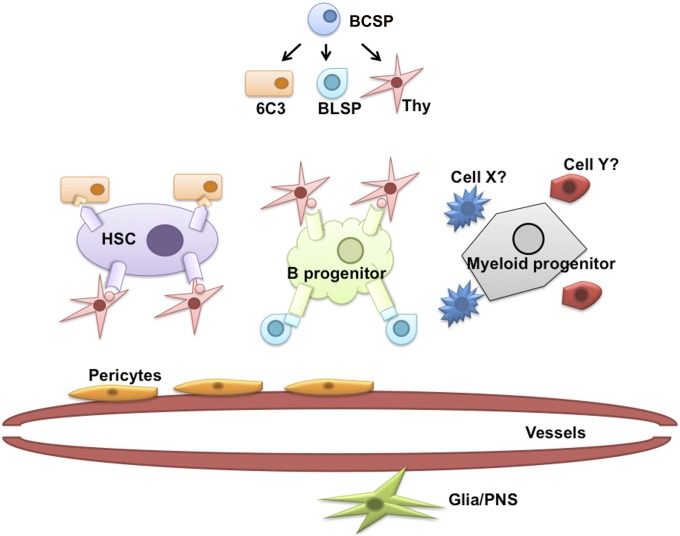
Organs are composites of tissue types with diverse developmental origins, and they rely on distinct stem and progenitor cells to meet physiological demands for cellular production and homeostasis. How diverse stem cell activity is coordinated within organs is not well understood. Here we describe a lineage-restricted, self-renewing common skeletal progenitor (bone, cartilage, stromal progenitor; BCSP) isolated from limb bones and bone marrow tissue of fetal, neonatal, and adult mice. The BCSP clonally produces chondrocytes (cartilage-forming) and osteogenic (bone-forming) cells and at least three subsets of stromal cells that exhibit differential expression of cell surface markers, including CD105 (or endoglin), Thy1 [or CD90 (cluster of differentiation 90)], and 6C3 [ENPEP glutamyl aminopeptidase (aminopeptidase A)]. These three stromal subsets exhibit differential capacities to support hematopoietic (blood-forming) stem and progenitor cells. Although the 6C3-expressing subset demonstrates functional stem cell niche activity by maintaining primitive hematopoietic stem cell (HSC) renewal in vitro, the other stromal populations promote HSC differentiation to more committed lines of hematopoiesis, such as the B-cell lineage. Gene expression analysis and microscopic studies further reveal a microenvironment in which CD105-, Thy1-, and 6C3-expressing marrow stroma collaborate to provide cytokine signaling to HSCs and more committed hematopoietic progenitors. As a result, within the context of bone as a blood-forming organ, the BCSP plays a critical role in supporting hematopoiesis through its generation of diverse osteogenic and hematopoietic-promoting stroma, including HSC supportive 6C3(+) niche cells.

Keywords: endochondral ossification; lymphopoiesis.


Conflict of interest statement

The authors declare no conflict of interest.

Figures

Fig. 1.
Fig. 1.
Skeletal tissue is composed of lineage restricted tissue progenitors. (A) FACS of dissociated bone and bone marrow stroma based on differential expression of CD45, Tie2, and alphaV integrin separates cells into lineage-restricted progenitors of hematopoietic (1), endothelial/adiopose (2), and skeletal (3) tissue (FSC-A, forward scatter area; FSC-W, forward scatter width). A fourth population (4) generates only slow growing fibroblastic cells. (B) GFP(+) vessels (arrowheads) derived from subcapsular renal transplantation of population 2 in A (“a-2”) isolated from actin-GFP mice. (Scale bar, 20 μm.) (C) GFP(+) adipocytes derived from transplantation of population a-2. (Scale bar, 20 μm.) (D) Pentachrome stain of cross-section of ectopic bone derived from transplantation of population a-3. [In pentachrome, red (fibrin) indicates muscle/vascularized tissue; yellow (reticular fibers/collagen) indicates bone; green/blue (mucin) indicates cartilaginous tissue; and black, nuclei and elastic fibers.] (Scale bar, 50 μm.) (E) Cross-sectional fluorescence image of ectopic bone in D showing spongy bone marrow stroma derived from transplantation of population a-3. (Scale bar, 50 μm.) (F) An RFP(+)-labeled hematopoietic stem cell (arrowhead) homes to GFP(+) stromal cells in ectopic bone from transplantation of population a-3. (Scale bar, 10 μm.) (G and H) Bright-field and fluorescent image of ectopic GFP-labeled bone derived from transplant of GFP bone marrow stromal tissue to myocardium. (Scale bar, 1 mm.) (I and J) Higher-magnification images of G and H. (Scale bar, 100 μm.) (K) Pentachrome stain of cross-section of ectopic bone (yellow dotted circle) in cardiac tissue in G–J. (Scale bar, 100 μm.) (L) Pentachrome stain of cross-section of femoral head for comparison. (Scale bar, 100 μm.)
Fig. 2.
Fig. 2.
CD105, Thy1, and 6C3 label distinct osteogenic populations that are clonally derived from a single CD105(+)Thy(−)6C3(+) common skeletal progenitor. (A and B) FACS analysis of CD45(−)Tie2(−)alphaV(+) skeletal cells indicating differential expression of CD105 versus Thy1 (A), and CD105 versus 6C3 (B). (Green dots are 6C3+ events, blue are Thy1+, and purple are all other events.) Expression of 6C3 (B) in populations that differentially express Thy1 (A) is indicated by linked boxes. (C–F) Micrographs showing osteogenic differentiation of 2,000 skeletal cells with indicated surface phenotypes after subcapsular renal transplantation (pentachrome stain). The black arrow indicates a marrow cavity. [Scale bar (E and F), 100 μm.] (G–I) In vitro clonal analysis of CD105(+)Thy(−)6C3(−)BCSPs. (G) Representative CD105(+)Thy(−) clones; the forked arrowhead indicates a chondrocyte cluster and the solid arrow indicates an osteoblast cluster. (Scale bar, 100 μm.) (H) Anti-Col2 immunostaining and higher magnification of the cell aggregate indicated by the forked arrowhead in G; positive cells (green) have a cuboidal chondrocyte morphology. (Scale bar, 500 μm.) (I) Osteocalcin immunostaining and higher magnification of the aggregate indicated by the solid arrowhead in G shows positive cells (red) with fibroblast morphology. (Bottom and J–O) In vivo clonal analysis of CD105(+)Thy(−)6C3(−) BCSPs. (Bottom) Schematic of the in vivo single cell skeletal progenitor transplant assay. (Scale bar, 100 μm.) (J) An epifluorescent stereomicroscope image showing ectopic bone under the renal capsule 1 mo after transplantation of a single GFP+ transgenic BCSP with 5,000 non-GFP fetal bone cells. The forked arrowhead points to a chondrogenic cluster (green); the solid arrowhead points to scattered osteoblasts in peripheral regions of the graft (green); the dotted yellow line delineates the cortical bone area in J, K, M, and N. (Scale bar, 100 μm.) (K) A representative section of the graft displayed in J, showing osteoblasts (solid arrowhead) in the cortical bone area. (Scale bar, 100 μm.) (L) A high-power image of a section adjacent to that in K after immunostaining with anti-osteocalcin antibody. Upper arrow points to a GFP(−) osteocalcin(+) individual osteocyte in cortical bone (red). Lower arrow points to GFP(+), osteocalcin(+) osteocyte (yellow). (M) A representative section of the graft displayed in G showing GFP-labeled stromal cells (arrowheads). (Scale bar, 20 μm.) (N) A different representative section of the graft displayed in G showing a chondrocyte cluster (forked arrowheads). (Scale bar, 20 μm.) (O) A high-power image of a section adjacent to that in K after immunostaining with anti-collagen-2 antibody shows GFP(+), collagen2(+) chondrocytes (green and yellow). (Scale bar, 20 μm.)
Fig. 3.
Fig. 3.
A BCSP-derived CD105(+)Thy(−)6C3(+) osteogenic stromal population possesses functional HSC niche activity. (A) Diagram of experimental scheme. (B) 200,000 CD45(−)Tie2(−)CD51(+)CD105(+)Thy(−)6C3(−) BCSPs were sorted (Left) from limb bones and allowed to expand and differentiate in vitro for 21 d. Then (Center and Right), CD105(+) Thy1(+) (blue dots) and CD105(+)6C3(+) (green dots) were reisolated and plated with 250 freshly isolated HSCs in serum-free media containing SCF, thrombopoietin (TPO), insulin-like growth factor 1 (IGF1), and fibroblast growth factor 2 (FGF2) (purple dots are neither Thy1+ nor 6C3+). After 10 d, the cocultures were transplanted into lethally irradiated congenic recipients. Donor granulocyte chimerism was measured in the peripheral blood 5, 10, and 20 wk after transplantation. (C) Three mice were analyzed per group, and the results were averaged. Freshly sorted HSCs were transplanted for comparison. Only HSCs cocultured with CD105(+)6C3(+) stroma gave levels of engraftment comparable to the fresh HSC transplants. *P < 0.05 by ANOVA; **P < 0.0001 by ANOVA.
Fig. 4.
Fig. 4.
Evidence that different types of osteogenic stroma act cooperatively to generate diversity in hematopoietic progenitor niches. (A) Newly transplanted HSC homes to 6C3(+) and Thy1(+) stroma in situ. Merged immunofluorescent image showing 6C3(+) stroma (green) and Thy1(+) stroma (red) in a cross-section of a femur from a mouse that received a transplant of RFP-labeled HSCs (white; arrowheads). The side panels show individual stains for CD45 (blue), HSCs (white), 6C3 (green), and Thy1 (red) for the region in the dotted box in A. (B) A heat map of select gene expression by microarray analysis in skeletogenic stromal populations. Skeletogenic populations are in rows and genes are in columns; the color code for expression levels is to the right. The top heat map indicates absolute expression of select genes implicated in HSC maintenance. The bottom heat map indicates absolute expression of select genes involved in osteogenesis; expression of genes involved in myogenesis (Myod1), adipogenesis (Pparg) and vasculargenesis (Kdr) are shown for comparison. (C) A single bone, cartilage, stromal progenitor (BCSP) generates stromal colonies that support HSCs. PI(−)CD45(−)Tie2(−)CD51(+)CD105(+)Thy(−)6C3(−) cells were single-cell sorted from limb bones and allowed to differentiate for 21 d in vitro. A brightfield image of a representative multipotent colony with a chondrocyte cluster, fibroblastic osteoblasts, and stromal cells. (Scale bar, 100 nm.) (D) FACS analysis of a representative multipotent colony that is capable of supporting HSCs. The presence of Thy(+) and 6C3(+) populations is indicated in the boxed region of the respective FACS plots. (E) 400 freshly isolated Lin(−)Ckit(+)Sca1(+)CD34(−)Slamf1(+) cells were added to the single cell-derived colonies and cultured for 10 d in serum-free media containing SCF, TPO, IGF1, and FGF2. After 10 d, 10 of the cocultured colonies were transplanted into lethally irradiated congenic recipients. At 5, 10, and 20 wk, the donor granulocyte chimerism was measured in the peripheral blood of each recipient.
Fig. 5.
Fig. 5.
Assembly of diverse niches by selective combination of BCSP-derived skeletal stroma. Proposed model of niche generation involving combinations of BCSP-derived skeletal stromal subtypes. BCSP is the progenitor of distinct stromal variants including Thy+ and 6C3 + stroma, which collectively expresses distinct repertoires of cytokines necessary for support of HSCs and HSC-derived hematopoietic progenitors. BCSP-derived stroma likely act in concert with other bone marrow populations including cells of hematopoietic, vasculature, and even glial origins to regulate hematopoiesis at the niche level.

References

    1. Moore KA, Lemischka IR. Stem cells and their niches. Science. 2006;311(5769):1880–1885. - PubMed
    1. Ehninger A, Trumpp A. The bone marrow stem cell niche grows up: Mesenchymal stem cells and macrophages move in. J Exp Med. 2011;208(3):421–428. - PMC - PubMed
    1. Calvi LM, et al. Osteoblastic cells regulate the haematopoietic stem cell niche. Nature. 2003;425(6960):841–846. - PubMed
    1. Sacchetti B, et al. Self-renewing osteoprogenitors in bone marrow sinusoids can organize a hematopoietic microenvironment. Cell. 2007;131(2):324–336. - PubMed
    1. Yamazaki S, et al. Nonmyelinating Schwann cells maintain hematopoietic stem cell hibernation in the bone marrow niche. Cell. 2011;147(5):1146–1158. - PubMed

Publication types

MeSH terms

LinkOut - more resources